An ultrasensitive molecularly imprinted electrochemical sensor based on graphene oxide/carboxylated multiwalled carbon nanotube/ionic liquid/gold nanoparticle composites for vanillin analysis

Xiaojiao Wang, Chuannan Luo*, Leilei Li and Huimin Duan
Key Laboratory of Chemical Sensing & Analysis in Universities of Shandong (University of Jinan), School of Chemistry and Chemical Engineering, University of Jinan, Jinan 250022, P.R. China. E-mail: chm_yfl518@163.com; Tel: +86 53189736065

Received 4th August 2015 , Accepted 26th October 2015

First published on 26th October 2015


Abstract

An imprinted electrochemical sensor based on graphene oxide/carboxylated multiwalled carbon nanotube/ionic liquid/gold nanoparticles/molecularly imprinted polymers (GO/CCNTs/IL/AuNPs/MIPs) has proved highly ultrasensitive and selective in the analysis of vanillin in spiked water samples. The GO/CCNTs/IL/AuNPs composite was utilized to improve the electrochemical response and sensitivity of the sensor. The molecularly imprinted polymer membrane was prepared by electropolymerization and could specifically determine vanillin. Under optimized conditions, the prepared molecular imprinting electrode material showed fast rebinding dynamics, and was successfully applied to vanillin detection with a wide linearity range from 1.00 × 10⁻⁸ to 2.50 × 10⁻⁶ mol L−1 and a detection limit of 6.23 × 10⁻¹⁰ mol L−1. The proposed imprinted electrochemical sensor also exhibited high repeatability (relative standard deviation of 3.16%) and stability (3.8%) for the analysis of real samples.

1. Introduction

Vanillin is a kind of phenolic compound which is one of the most widely used and important flavouring materials worldwide such as in confectionery, beverages, pharmaceuticals, cream products and perfumes.1,2 It can not only maintain the desirable flavor and aroma properties of the food but also has beneficial health effects such as inhibition of cardiac disease mortality and antisickling effect in sickle cell anaemia sufferers.3,4 However, the excessive intake of vanillin can lead to some undesirable consequences to consumers (like headaches, nausea and vomiting), and can affect liver and kidney functions.5 The maximum usage of vanillin is 7 mg/100 g (FAO/WHO 1992) while in infant food vanillin is forbidden.6 Therefore, from the viewpoint of food safety and addiction, it is crucial to control vanillin content in food products and developing a new electrode material for the simple, sensitive, economic and rapid detection of vanillin is very important.

Up to now, various methods are available for the detection of vanillin, such as gas chromatography,7 high performance liquid chromatography (HPLC),8 UV-vis spectrophotometry9 and capillary electrophoresis.10 Some satisfactory results have been obtained. Nevertheless, the electrochemical sensors have advantages such as low-cost instrumentation, fast analysis, and improved sensitivity. Due to the simplicity, portability, low cost and rapid analysis, electrochemical technology represents a promising alternative for vanillin sensing. However, detection of vanillin at bare electrode has the relatively high overpotential11 and interference lead to their selectivity and sensitivity not good enough. To overcome the barriers of poor selectivity and sensitivity, molecularly imprinted polymers (MIPs)12 and nanomaterials13 have been introduced in the modified electrodes.

MIPs have some specific advantages, such as great specific recognition ability,14 low cost of preparation, high stability, high surface-to-volume ratio and good selectivity.15,16 Unfortunately, application of traditional MIPs was limited by low density of imprinted sites, slow binding time, incomplete template removal and weak electrical conductivity, which limit its application in the field of sensors.17–19 Fortunately, many new class multifunctional materials are used to change these disadvantages.20 Multifunctional nanomaterials molecularly imprinted electrode materials not only have high selectivity but also have great sensitivity.

Multifunctional nanomaterials which could improve interfacial electron transfer also have been used to modify electrodes such as carbon nanomaterials and metal nanoparticles. Carbon nanomaterials have been regarded as effective materials to improve the electron transport rate.21 Graphene oxide (GO) has a one-atom-thick layer of sp2-bonded carbon.22 Owing to its unique and novel properties including high surface area and good chemical stability,23 GO has attracted considerable attentions. However, GO tends to re-stack and agglomerate. To avoid the deteriorating effect of re-stacked GO sheets as well as to improve the electrical conduction through the insulating GO film thickness, multiwalled carbon nanotube (CNTs) were composited with GO.24,25 Furthermore, CNTs are able to bridge the gaps between GS to form a three-dimensional conductive network, providing smoothly conductive pathways for electron conduction and hopping in composites.25 CNTs have high thermal conductivity, and high aspect ratio.26 In addition, by decorating metal nanoparticles on carbon nanoparticles, a new way is provided to develop catalytic and optoelectronic materials.27 Gold nanoparticles (AuNPs) have many excellent properties such as large surface-to-volume ratio, good electrical properties, high surface reaction activity, small particle size and good surface properties.28 They also can form covalent bond sand combine with materials containing many functional groups, such as CN, NH3, or SH.29 Therefore, we used AuNPs to fabricate electrochemical sensor to improve the electrical conductivity of the sensor. GO/CCNTs/AuNPs was prepared via π–π stacking and self-assembly to improve the electrical conductivity of the sensor. Ionic liquids (IL), a new class of conductive materials made of molten organic cations and various anions.30 Due to ionic liquids unique physical properties of wide electrochemical windows, commendable chemical and thermal stability, high ionic conductivity and low toxicity, it can be used not merely as the supporting electrolyte but also as the modifier in modified electrode.31

In this work, the electrochemical activities of vanillin on GO/CCNTs/IL/AuNPs/MIPs modified electrode were tested. Owing to the highly electrical conductivity and specific recognition of modified materials, the electrochemical activities are enhanced. The following electrochemical experiment showed that the GO/CCNTs/IL/AuNPs/MIPs had the most sensitive and selective determination signals for the trace determination of vanillin. This method offers several advantages over other techniques, including being of low environmental impact, efficient, inexpensive and rapid.

2. Experimental

2.1. Materials and reagents

1-Butyl-3-methyl imidazole hydrobromide (purity: 99%) were purchased from Aladdin Chemistry Co. Ltd. (Shanghai, China). Natural graphite powder, chloroauric acid and vanillin were purchased from Sinopharm Chemical Reagent Co. Ltd. (Beijing, China). Hydrogen peroxide (H2O2, 30%, w/v) was obtained from Chemical Reagent Co. (Tianjin, China). Ultrapure water was obtained from a youpu water purification system (18.25 MΩ, Milli-Q, Millipore, Billerica, MA) and used in all experiments. All other reagents were of analytical grade. The 0.1 mol L−1 PBS was employed as a supporting electrolyte, which was made from Na2HPO4, NaH2PO4 and H3PO4.

2.2. Apparatus

Electrochemical measurements were performed on a CHI 660D Electrochemistry Workstation (Shanghai CH Instruments Co., China) with a conventional three electrode system: a modified glassy carbon working electrode, an Ag/AgCl (saturated KCl) reference electrode, and a platinum foil counter electrode. EIS was performed on a CHI 604D Electrochemical Workstation (Shanghai CH Instruments Co., China). SEM images were recorded by a JSM-6300 scanning electron microscope (JEOL, Japan). The FT-IR spectrum was recorded by a Nicolet 400 Fourier transform infrared spectrometer (Madison, WI). XRD was performed on a Focus D8 (Brooke AXS Co. Ltd., Germany). All electrochemical measurements were performed at room temperature.

2.3. Preparation of GO/CCNTs/IL/AuNPs nanoparticles

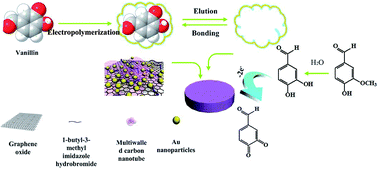
The GO/CCNTs/IL/AuNPs nanoparticles were synthesized via a one-step chemical co-reduction method according to the following report. The synthesis process of electrode materials is illustrated in Scheme 1. In brief, firstly, graphene oxide (GO) was synthesized from graphite through oxidization by using HNO3, H2SO4, and KMnO4 as reported.32 Then GO, CCNTs and ionic liquid (1-butyl-3-methylimidazolium bromide) (IL) (GO/CCNTs/IL = 1[thin space (1/6-em)]:[thin space (1/6-em)]1[thin space (1/6-em)]:[thin space (1/6-em)]2) with a total amount of about 0.5 g were added into 80 mL of ethylene glycol (EG) and 3.65 mL of 1 mol L−1 HAuCl4 solution and ultrasonically treated for 3 h to form a homogeneous dispersion. The mixture was heated to 120 °C for 24 h with stirring. The resulting dispersion solution was filtered and washed by deionized water for several times. After dried, the GO/CCNTs/IL/AuNPs nanoparticles were collected.
image file: c5ra15521e-s1.tif
Scheme 1 Schematic diagram of GO/CCNTs/IL/AuNPs/MIPs composites apply to the electrode.

2.4. Preparation of MIPs and non-molecularly imprinted polymers (NIPs) sensors

Bare GCE was polished with 0.05 μm alumina slurry, rinsed thoroughly with deionized water repeatedly and dried at room temperature. The step by step fabrication process of the MIPs/GO/CCNTs/IL/AuNPs/GCE was shown below: firstly, 5.0 μL of GO/CCNTs/IL/AuNPs homogeneous solution was drop-coated on the GCE surface and dried at room temperature. After that, pyrrole polymer film with the vanillin templates was electrochemically deposited onto the modified electrode through CV electropolymerization in 0.10 mol L−1 of pyrrole phosphate buffer solution (PBS, pH 7.0) containing 0.30 mol L−1 of vanillin. CV was conducted between −0.60 V and +1.00 V with a scanning rate of 0.05 V s−1 for several cycles to obtain an excellent imprinted film. After the electropolymerization, the composite film modified electrode was dried and then extracted by 0.10 mol L−1 of phosphate buffer solution (PBS, pH 7.0) repeatedly. Thus, MIPs sensor was obtained. The NIPs sensor was fabricated with the same method mentioned above but without the addition of vanillin.

2.5. Electrochemical measurements

Electrochemical measurements to characterize were carried out in 2 × 10⁻³ mol L−1 K3[Fe(CN)6] solution containing 0.1 mol L−1 KCl. Amperometric responses of the sensor were recorded by differential pulse voltammetry (DPV). DPV was performed in 0.10 mol L−1 PBS (pH 7.0) containing 0.1 mol L−1 KCl at the potential range from 0.1 to 0.9 V. All measurements were performed at room temperature.

3. Results and discussion

3.1. Characterization of nanomaterials

The morphology of the GO is characterized by TEM image (Fig. 1A). GO shows a typical crumpled and wrinkled sheet structure, which provides a large rough surface for the further modification. The surface of GO/CCNTs, GO/CCNTs/IL and GO/CCNTs/IL are shown by SEM in Fig. 1B–D. A large quantity of CCNTs entangled into a network structure with GO is shown in Fig. 1B. This result indicates that the stacking of GO is impeded by CCNTs and the space between GO is enlarged effectively. GO and CCNTs have intrinsically high electrical conductivity and large surface area as well as the network structure can serve as fast electronic conducting channels for the further modification. As shown in Fig. 1C, the surface of GO/CCNTs/IL tends to roughness. It is indicated that IL has been successfully composited on the surface of GO/CCNTs. Fig. 1D shows the image of GO/CCNTs/IL/AuNPs which has some bright spots. The surface doped AuNPs are expected to enhance electronic transmission rate.
image file: c5ra15521e-f1.tif
Fig. 1 TEM image of (A) GO, SEM image of (B) GO/CCNTs, (C) GO/CCNTs/IL and (D) GO/CCNTs/IL/AuNPs.

To further verify the formation of the GO/CCNTs, the differences in FT-IR spectrums (Fig. 2A) before and after carboxylation are investigated. As shown in Fig. 2A(a), before carboxylation, the peaks at 1401 and 1121 cm−1 correspond to the C–H/O–H bending vibrations and the peak at 3440 cm−1 corresponds to the O–H stretching vibration of water molecule and OH in the lattice. The surface of CCNTs is modified with COOH groups after reacting with H2SO4/HNO3 (curve b). The bands attributed to the C[double bond, length as m-dash]O stretching vibration at 1720 cm−1, O–H bending vibrations at 1121 cm−1 and O–H bending vibration at 3440 cm−1 increased. Simultaneously, additional absorption band which are assigned to the C–H stretching at 617 cm−1 appeared. It suggests that COOH groups have been successfully grafted onto the surface of GO/CCNTs during the modification process.


image file: c5ra15521e-f2.tif
Fig. 2 (A) FTIR of different modified material: (a) CNTs, (b) CCNTs. (B) CVs of (a) GO/CCNTs/GCE in pH 7.0 PBS, (b) GO/CCNTs/IL/GCE in pH 7.0 PBS, (c) GO/CCNTs/IL/AuNPs/GCE in pH 7.0 PBS and (d) GO/CCNTs/IL/AuNPs/MIPs/GCE after removing of the template in pH 7.0 PBS containing 2 × 10⁻³ mol L−1 vanillin at 100 mV s−1, E/V vs. Ag/AgCl (sat. KCl). (C) EIS of different modified electrodes in 2.0 × 10⁻³ mol L−1 K3Fe(CN)6 solution containing 0.1 mol L−1 KCl at a bias potential of 0.17 V: (a) GO/CCNTs/IL/AuNPs/GCE, (b) bare GCE, (c) GO/CCNTs/IL/AuNPs/MIPs/GCE after removing of the template, (d) MIPs/GCE before removing of the template.

3.2. Cyclic voltammograms of variously modified electrodes

The different electrochemical behaviors of various modified electrodes are investigated by cyclic voltammetry in pH 7.0 PBS containing 2 × 10⁻³ mol L−1 vanillin at 0.1 V s−1. As shown in Fig. 2B, (a) GO/CCNTs/GCE, (b) GO/CCNTs/IL/GCE, (c) GO/CCNTs/IL/AuNPs/GCE and (d) MIPs/GO/CCNTs/IL/AuNPs/GCE after removing of the template are depicted by typical cyclic voltammograms with the scan range from −0.6 to 1.4 V. Peak current for the vanillin redox processes shows strong connection on the increasing of dropped different materials. As shown in Fig. 2B, the cyclic voltammogram of GO/CCNTs/GCE show a low oxidation or reduction peaks in pH 7.0 PBS (curve a). After added IL into the dropped materials, the little increased of response current was discovered (curve b). ILs possessed excellent ionic conductivity, which contributes to the good charge transfer ability of the electrochemical characteristics of variously modified electrodes. As the AuNPs could improve the electrical conductivity of modified electrode, obviously increased redox peak current was obtained when the AuNPs were modified on the electrode (curve c). When the MIPs were composited on modified electrode, slight decrease of the redox current had been observed (curve d), indicating that the MIPs film blocked the electron transfer. But the current response is higher than the current response of bare electrode. The reason might be attributed to the fact that the synthesized GO/CCNTs/IL/AuNPs possessed high conductivity and good electron transfer efficiency, which facilitated the electron communication between the solution and the base electrode.

EIS is used to monitor the interfacial properties of surface-modified electrode.34 The EIS of variously modified electrodes are monitored in a solution of 2.0 × 10⁻³ mol L−1 [Fe(CN)6]3−/4− and 0.1 mol L−1 KCl at a bias potential of 0.17 V. The typical impedance spectrum includes a semicircle portion at higher frequencies corresponds to the electron-transfer resistance (Ret) and the linear part at lower frequencies corresponds to the diffusion process. The stepwise modification process is shown by the impedance spectra (Fig. 2C). It is observed that the EIS of bare GCE (curve b) and GO/CCNTs/IL/AuNPs/GCE after removing of the template (curve a) displayed an almost straight line in the Nyquist plot. However, curve (a) is steeper than curve (b), indicating that GO/CCNTs/IL/AuNPs was an excellent electric conducting material and accelerated the electron transfer. Subsequently, when the electrode was modified by MIPs, the Ret increased (curve d). It was indicated that the MIPs is successfully composited on the surface and formed an additional barrier and blocked the electron exchange between the redox probe and the electrode. After removing the template, the Ret decreased (curve c), which suggested that the indicating that the template was successfully removed and formed some cavities which facilitated the electron exchange between the redox.

3.3. Optimization of analytical conditions

3.3.1. Effect of amount of GO/CCNTs/IL/AuNPs. The relationship between the peak currents of vanillin and the amount of GO/CCNTs/IL/AuNPs on the GCE is investigated. After open circuit accumulation 3.0 min, the peak currents of vanillin increase when the amount of GO/CCNTs/IL/AuNPs suspension increased from 3.0 to 5.0 μL. However, when the amount of GO/CCNTs/IL/AuNPs exceeded 5.0 μL, the peak currents decrease dramatically (Fig. 3A). The results may be attributed to the thicker film of GO/CCNTs/IL/AuNPs, which blocked the electrical conductivity. Consequently, a GO/CCNTs/IL/AuNPs suspension of 5.0 μL is utilized to modify the GCE.
image file: c5ra15521e-f3.tif
Fig. 3 The effect of (A) amount of GO/CCNTs/IL/AuNPs, (B) pH, (C) accumulation time and (D) scanning cycles of the electropolymerization of MIPs. Scan range from 0.1 to 0.9 V, scan rate 0.1 V s−1 in the PBS (pH = 7.0) consisting of 0.1 mol L−1 of KCl and 2.0 × 10⁻³ mol L−1 vanillin.
3.3.2. Effect of pH value. The effect of pH value on the electrochemical behavior of vanillin is performed in the range from 5.0 to 8.0 in PBS solutions. After open circuit accumulation 3.0 min, the peak currents is increased with the increasing of pH value from 5.0 to 7.0 and then decrease when the pH exceeded 7.0 (Fig. 3B). Therefore, PBS with pH 7.0 is used as the supporting electrolyte in all subsequent experiments.
3.3.3. Effect of accumulation time. The sensitivity of the test is undoubtedly improved by the accumulation time. As shown in Fig. 3C, the peak currents of vanillin decrease to linear relationship when the accumulation time increases from 1.0 to 3.0 min. The result might owe to the increased amount of vanillin on the GO/CCNTs/IL/AuNPs. After that, no further decrease is observed due to the surface saturation, therefore, 3.0 min is chosen for subsequent experiments.
3.3.4. Effect of scanning cycles. In order to improve the sensitivity and stability of the sensor, the optimum number of scanning cycles is determined during the electropolymerization process. After open circuit accumulation 3.0 min, the peak currents are increased with the number of cycles from 7.0 to 10.0. It is because that the imprinted polymers membranes became very thin and easy to break when removing the template molecule. When the scan cycles are more than ten cycles, the peak currents are decreased. It is indicated that the imprinted polymer membrane is too thick, template molecules situated at the central area of the polymer membranes cannot completely be removed from polymers matrix. Therefore, we chose ten cycles as the optimum scan cycles during the electropolymerization process.

3.4. Determination of vanillin concentration by differential pulse voltammetric (DPV)

The differential pulse voltammetric (DPV) is an electrochemical method with highly sensitive and low detection limit, and is used for the determination of trace amounts of vanillin under the optimum conditions. Fig. 4 shows the typical DPV response for different concentrations of vanillin in this experiment. DPV is determined in the phosphate butter solution (pH = 7) consisting of 0.1 mol L−1 of KCl and scan range is from 0.1 to 0.9 V. The peak currents of the electrochemical sensor increases with the increasing of vanillin concentrations, and the resulting calibration plots are a good linear over the range from 1.00 × 10⁻⁸ to 2.50 × 10⁻⁶ mol L−1. The linear regression equations is I (μA) = 6.1454 × 10⁻⁷ + 0.7299c (10−6 mol L−1) with a correlation coefficient (R) of 0.9991. The detection limit is estimated to be 6.23 × 10⁻⁹ mol L−1 at a signal-to-noise ratio of 3σ (where σ is the standard deviation of the blank, n = 11). The proposed method in this work compared with the reported methods previously33–36 has wide linear range and low detection limit. The synergic effect of GO/CCNTs, IL and AuNPs can be further confirmed. The detailed specific features are shown in Table 1. It indicates that this method is preferable in the determination of trace amount of vanillin.
image file: c5ra15521e-f4.tif
Fig. 4 Calibration curves between vanillin concentration and peak current. Inset: DPV curves of GO/CCNTs/IL/AuNPs/MIPs/GCE in vanillin solution with concentrations of 0.001–2.5 μM. The concentration of vanillin in curves from down to up were as follows: 1.0 × 10⁻⁸, 5.0 × 10⁻⁸, 1.0 × 10⁻⁷, 2.5 × 10⁻⁷, 3.5 × 10⁻⁷, 1.5 × 10⁻⁶, 2.5 × 10⁻⁶ mol L−1, respectively.
Table 1 Analytical properties of different modified electrodes
Electrode Technique Linear range (10−6 mol L−1) Detection limit (10−8 mol L−1) Reference
a Multi-walled carbon nanotubes chemically modified by 2,9,16,23-tetraaminophthalocyaninatocobalt modified glassy carbon electrode.b Graphene–polyvinylpyrrolidone composite modified acetylene black paste electrode.c Differential pulse voltammetry.d Square-wave voltammetry.e Derivative voltammetry.
Graphene/GCE DPVc 0.6–48 5.6 33
MWCNTs–TAPcCo/GCEa SWVd 4.2–5000 40 34
AuPd–graphene/GCE DPV 0.1–7 2 35
GR–PVP/ABPEb DVe 0.01–7 1 36
GO/CCNTs/IL/AuNPs/MIPs modified glassy carbon electrode DPV 0.0005–2.5 0.0167 This work


3.5. Selectivity of the electrochemical sensor

In order to apply the sensor to the analysis of vanillin in practical samples (food items), the interferences of some related phenolic compounds which may be present together with vanillin are examined under the optimal conditions. The results are shown in Fig. 5. The tolerable limits of coexistent species are taken as a relative error not larger than 5%.8 Under the optimum conditions, the detection of 1.0 × 10⁻⁴ mol L−1 vanillin has not been affected by 0.01 mol L−1 2,4,6-trinitrophenol, hydroquinone, paranitrophenol and resorcinol. The results indicate that the proposed method could be applied to the detection of vanillin in the samples. The influences of some common ions on the determination of vanillin (1.0 × 10⁻⁴ mol L−1) are also studied in the experiment. The results indicate that the concentration of 200 times of ascorbic acid, NH4+, Na+, K+, Fe2+, SO42−, CO32− did not affect the determination of vanillin. The results indicate that the sensor had a good selectivity.
image file: c5ra15521e-f5.tif
Fig. 5 The effect of different interference substances on determination of vanillin.

3.6. Reproducibility and stability of the electrochemical sensor

The reproducibility of the electrochemical sensor was determined to the sensor inter-assay precision. The precision of the analytical method was evaluated by analyzing vanillin for six replicate determinations. The relative standard deviation (RSD) values of the precision were 3.16% at vanillin concentrations of 2.5 × 10⁻⁶ mol L−1. Similarly, the RSD values of the precision were 2.98–3.62% toward the above mentioned concentration. Thus, the precision and reproducibility of the proposed electrochemical detection were accepted.

In the application and development of the proposed electrochemical sensor, stability is a key factor. To investigate the stability of the modified electrode, it was stored at 4 °C and measured at intervals of 2 day. 3.8% decrease of the initial response was observed (Fig. 6). The result indicated that the modified electrode had a good stability. The little decrease might be the activation of electrode decreasing with the increasing of store time.


image file: c5ra15521e-f6.tif
Fig. 6 The effect of stability on determination of vanillin.

3.7. Determination of vanillin in spiked water samples

To prepare the spiked water samples, known concentration of vanillin solution were added into tap water. The recovery and relative standard deviation of the amino acid were determined and presented in Table 2. The excellent recovery of the samples indicated that the proposed method can be successfully applied in the detection of vanillin concentration in water sample.
Table 2 The determination of vanillin in water samples (n = 11)
Sample Added (10−6 mol L−1) Found (10−6 mol L−1) RSD (%) Recovery (%)
1 0.10 0.098 3.37 98.0
2 0.13 0.126 5.04 96.9
3 0.17 0.174 3.76 103.4
4 0.20 0.198 4.21 99.0


4. Conclusion

In this work, GO/CCNTs/IL/AuNPs/MIPs were utilized as efficient materials to fabricate imprinted electrochemical sensor for detecting vanillin. The nanomaterials exhibited a high electrochemical activity and sensitivity. CCNTs and IL combined with GO could avoid GO agglomeration and increase the adsorption sites. The AuNPs were used to improve the electrical conductivity of the sensor. With the addition of MIPs of vanillin, the specially recognize to vanillin could be realized. Based on the composites, the imprinted electrochemical sensor showed good performance for trace amounts of vanillin, such as a wide linear range, low detection limit, high selectivity, acceptable reproducibility and excellent stability. It was successfully used to detect vanillin in spiked water sample. A useful platform which was prepared of imprinted electrochemical sensor and applied in the actual sample was provided by the developed method.

Acknowledgements

This work was supported by the National Natural Science Foundation of China (NSFC, No. 21345005 and 21205048), the Shandong Provincial Natural Science Foundation of China (No. ZR2012BM020) and the Scientific and technological development Plan Item of Jinan City in China (No. 201202088).

References

  1. F. Bettazzi, I. Palchetti, S. Sisalli and M. Mascini, A disposable electrochemical sensor for vanillin detection, Anal. Chim. Acta, 2006, 555, 134–138 CrossRef CAS.
  2. Y. X. Liu, Y. Z. Liang, H. Lian, C. Z. Zhang and J. Y. Peng, Sensitive Voltammetric Determination of Vanillin with an Electrolytic Manganese Dioxide–Graphene Composite Modified Electrode, Int. J. Electrochem. Sci., 2015, 10, 4129–4137 CAS.
  3. T. R. Silva, D. Brondani, E. Zapp and I. C. Vieira, Electrochemical Sensor Based on Gold Nanoparticles Stabilized in Poly(Allylamine hydrochloride) for Determination of Vanillin, Electroanalysis, 2015, 27, 465–472 CrossRef CAS.
  4. Y. Zhao, Y. L. Du, D. B. Lu, L. T. Wang, D. Y. Ma, T. Z. Ju and M. L. Wu, Sensitive determination of vanillin based on an arginine functionalized graphene film, Anal. Methods, 2014, 6, 1753–1758 RSC.
  5. L. Jiang, Y. P. Ding, F. Jiang, L. Li and F. Mo, Electrodeposited nitrogen-doped graphene/carbon nanotubes nanocomposite as enhancer for simultaneous and sensitive voltammetric determination of caffeine and vanillin, Anal. Chim. Acta, 2014, 833, 22–28 CrossRef CAS PubMed.
  6. L. H. Huang, K. Y. Hou, X. Jia, H. B. Pan and M. Du, Preparation of novel silver nanoplates/graphene composite and their application in vanillin electrochemical detection, Mater. Sci. Eng., C, 2014, 38, 39–45 CrossRef CAS PubMed.
  7. A. Pérez-Silva, E. Odoux, P. Brat, F. Ribeyre, G. Rodriguez-Jimenes and V. Robles-Olvera, et al., GC-MS and GC-olfactometry analysis of aroma compounds in a representative organic aroma extract from cured vanilla (Vanilla planifolia G. Jackson) beans, Food Chem., 2006, 99, 728–735 CrossRef.
  8. K. N. Waliszewski, V. T. Pardio and S. L. Ovando, A simple and rapid HPLC technique for vanillin determination in alcohol extract, Food Chem., 2006, 101, 1059–1062 CrossRef.
  9. A. Longares-Patrón and M. P. Cañizares-Macías, Focused microwaves-assisted extraction and simultaneous spectrophotometric determination of vanillin and p-hydroxybenzaldehyde from vanilla fragans, Talanta, 2006, 69, 882–887 CrossRef PubMed.
  10. M. Heller, L. Vitali, M. A. L. Oliveira, A. C. O. Costa and G. A. Micke, A rapid sample screening method for authenticity control of whiskey using capillary electrophoresis with online preconcentration, J. Agric. Food Chem., 2011, 59, 6882 CrossRef CAS PubMed.
  11. P. H. Deng, Z. F. Xu, R. Y. Zeng and C. X. Ding, Electrochemical behavior and voltammetric determination of vanillin based on an acetylene black paste electrode modified with graphene–polyvinylpyrrolidone composite film, Food Chem., 2015, 180, 156–163 CrossRef CAS PubMed.
  12. K. Haupt and K. Mosbach, Molecularly imprinted polymers and their use in biomimetic sensors, Chem. Rev., 2000, 100, 2495–2504 CrossRef CAS PubMed.
  13. X. J. Li, X. J. Wang, L. L. Li, H. M. Duan and C. N. Luo, Electrochemical sensor based on magnetic graphene oxide@gold nanoparticles-molecular imprinted polymers for determination of dibutyl phthalate, Talanta, 2015, 131, 354–360 CrossRef CAS PubMed.
  14. J. O. Mahony, K. Nolan, M. R. Smyth and B. Mizaikoff, Molecularly imprinted polymers—potential and challenges in analytical chemistry, Anal. Chim. Acta, 2005, 534, 31–39 CrossRef CAS.
  15. I. Porobic, D. Kontrec and M. Soskic, Molecular recognition of indole derivatives by polymers imprinted with indole-3-acetic acid: A QSPR study, Bioorg. Med. Chem., 2013, 21, 653–659 CrossRef CAS PubMed.
  16. V. Suryanarayanan, C. T. Wu and K. C. Ho, Molecularly imprinted electrochemical sensors, Electroanalysis, 2010, 22, 1795–1811 CrossRef CAS.
  17. B. Rezaei, O. Rahmanian and A. A. Ensafi, An electrochemical sensor based on multiwall carbon nanotubes and molecular imprinting strategy for warfarin recognition and determination, Sens. Actuators, B, 2014, 196, 539–545 CrossRef CAS.
  18. P. Chen, P. Nien, C. Hu and K. Ho, Detection of uric acid based on multi-walled carbon nanotubes polymerized with a layer of molecularly imprinted PMAA, Sens. Actuators, B, 2010, 146, 466–471 CrossRef CAS.
  19. Z. Zhang, Y. Hu, H. Zhang and S. Yao, Novel layer-by-layer assembly molecularly imprinted sol–gel sensor for selective recognition of clindamycin based on Au electrode decorated by multi-wall carbon nanotube, J. Colloid Interface Sci., 2010, 344, 158–164 CrossRef CAS PubMed.
  20. M. C. Blanco-Lopez, M. J. Lobo-Castanon, A. J. Miranda-Ordieres and P. Tunon-Blanco, Electrochemical sensors based on molecularly imprinted polymers, Trends Anal. Chem., 2004, 23, 36–48 CrossRef CAS.
  21. M. M. Barsan, M. E. Ghica and C. M. A. Brett, Electrochemical sensors and biosensors based on redox polymer/carbon nanotube modified electrodes: A review, Anal. Chim. Acta, 2015, 881, 1–23 CrossRef CAS PubMed.
  22. Z. Bilkova, M. Slovakova, A. Lyka, D. Horak, J. Lenfeld and J. Turkova, et al. Oriented immobilization of galactose oxidase to bead and magnetic bead cellulose and poly(HEMA-co-EDMA) and magnetic poly(HEMA-co-EDMA) microspheres, J. Chromatogr. B: Biomed. Sci. Appl., 2002, 770, 25–34 CrossRef CAS.
  23. N. Li, X. M. Zhang, Q. Song, R. G. Song, Q. Zhang and T. Kong, et al. The promotion of neurite sprouting and outgrowth of mouse hippocampal cells in culture by graphene substrates, Biomaterials, 2011, 32, 9374–9382 CrossRef CAS PubMed.
  24. Z. J. Fan, J. Yan, L. J. Zhi, Q. Zhang, T. Wei and J. Feng, et al. A Three-Dimensional Carbon Nanotube/Graphene Sandwich and Its Application as Electrode in Supercapacitors, Adv. Mater., 2010, 22, 3723–3728 CrossRef CAS PubMed.
  25. S. Y. Yang, K. H. Chang, H. W. Tien, Y. F. Lee and S. M. Li, et al. Design and tailoring of a hierarchical graphene–carbon nanotube architecture for supercapacitors, J. Mater. Chem., 2011, 21, 2374–2380 RSC.
  26. H. Im and J. Kim, Thermal conductivity of a graphene oxide–carbon nanotube hybrid/epoxy composite, Carbon, 2012, 50, 5429–5440 CrossRef CAS.
  27. H. Bai, Li C, Shi GQ. Functional Composite Materials Based on Chemically Converted Graphene, Adv. Mater., 2011, 23, 1089–1115 CrossRef CAS PubMed.
  28. L. L. Fan, C. N. Luo, M. Sun, X. J. Li and H. M. Qiu, Highly selective adsorption of lead ions by water-dispersible magnetic chitosan/graphene oxide composites, Colloids Surf., 2013, B 103, 523–529 CrossRef PubMed.
  29. R. Singh, R. Verm, A. Kaushik, G. Sumana, S. Sood, R. K. Gupta and B. D. Malhotra, Chitosan–iron oxide nano-composite platform for mismatch-discriminating DNA hybridization for Neisseria gonorrhoeae detection causing sexually transmitted disease, Biosens. Bioelectron., 2011, 26, 2967 CrossRef CAS PubMed.
  30. A. Safavi, N. Maleki, O. Moradlou and M. Sorouri, Direct electrochemistry of hemoglobin and its electrocatalytic effect based on its direct immobilization on carbon ionic liquid electrode, Electrochem. Commun., 2008, 10, 420–423 CrossRef CAS.
  31. Z. H. Wang and F. Li, An ionic liquid-modified graphene based molecular imprinting electrochemical sensor for sensitive detection of bovine hemoglobin, Biosens. Bioelectron., 2014, 61, 391–396 CrossRef CAS PubMed.
  32. L. L. Fan, C. N. Luo, X. J. Li, F. G. Lu, H. M. Qiu and M. Sun, Fabrication of novel magnetic chitosan grafted with graphene oxide to enhance adsorption properties for methyl blue, J. Hazard. Mater., 2012, 215–216, 272–279 CrossRef CAS PubMed.
  33. J. Peng, C. Hou and X. Hu, A graphene-based electrochemical sensor for sensitive detection of vanillin, J. Electrochem. Sci. Eng., 2012, 7, 1724–1733 CAS.
  34. D. J. Kong, S. F. Shen, H. Y. Yu, J. D. Wang and N. S. Chen, Chemical modification of multi-walled carbon nanotubes by tetraaminophthalocyaninatocobalt for the electrocatalytic oxidation of vanillin, Chin. J. Inorg. Chem., 2010, 26, 817–821 CAS.
  35. L. Shang, F. Zhao and B. Zeng, Sensitive voltammetric determination of vanillin with an AuPd nanoparticles–graphene composite modified electrode, Food Chem., 2014, 151, 53–57 CrossRef CAS PubMed.
  36. P. H. Deng, Z. F. Xu, R. Y. Zeng and C. X. Ding, Electrochemical behavior and voltammetric determination of vanillin based on an acetylene black paste electrode modified with graphene–polyvinylpyrrolidone composite film, Food Chem., 2015, 180, 156–163 CrossRef CAS PubMed.

This journal is © The Royal Society of Chemistry 2015