Photoluminescence enhancement from silicon quantum dots located in the vicinity of a monolayer of gold nanoparticles

A. L. Muñoz-Rosasa, A. Rodríguez-Gómez*b, J. A. Arenas-Alatorreb and J. C. Alonso-Huitróna
aInstituto de Investigaciones en Materiales, Universidad Nacional Autónoma de México, A.P. 70-360, Coyoacán 04510, Mexico D. F., Mexico
bInstituto de Física, Universidad Nacional Autónoma de México, A.P. 20-364, Coyoacán 01000, Mexico D. F., Mexico. E-mail: arodriguez@fisica.unam.mx

Received 16th September 2015 , Accepted 26th October 2015

First published on 26th October 2015


Abstract

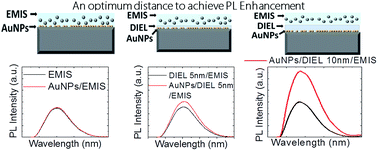
In this paper we show that it is possible to carry out a functional coupling between a thin film of silicon quantum dots embedded in a silicon nitride matrix (SiQDs) and a monolayer of gold nanoparticles by using dry and low temperature techniques, such as those used in microelectronics industry, i.e., Remote Plasma Enhanced Chemical Vapor Deposition (RPECVD) and Sputtering. The coupled structure showed 105% of photoluminescence (PL) enhancement, compared with PL observed from the SiQDs without the gold monolayer. The SiQDs used as light emitters have an average diameter of 3.1 nm, a particle density of 6.04 × 10¹² particles per cm2 and a maximum PL peak at 505 ± 5 nm. Additionally, the gold nanoparticles were designed with the following characteristics: the particles are embedded in a silicon nitride matrix, show quasi-spherical shapes, an average diameter of 2.9 nm, a particle density of 2.52 × 10¹² particles per cm2 and their surface plasmon resonance is located at 540 ± 3 nm. We found that there is an optimum separation distance between SiQDs and the gold monolayer to achieve the maximum photoluminescence enhancement. For our structure, such optimal distance was 10 ± 1 nm. We consider that there could be two combined physical effects responsible of the enhancement: (a) a plasmonic diffraction-limited coupling and (b) a change of the scattering mechanisms of the primary laser light.

Introduction

Silicon is extensively used in the photovoltaic and microelectronics industries due to its physical characteristics, abundance and its relative ease manipulation.1–3 However, silicon photonic applications are scarce because as an indirect band semiconductor its emission efficiency is very low.4

Several works have reported that when silicon is confined in spherical three-dimensional regions of not more than 10 nm in diameter, a slight alignment between the maximum of the valence band and the minimum of the conduction band occurs. This phenomenon is known as quantum confinement effect (QCE).5–12 The QCE greatly improves the silicon photoluminescent (PL) and electroluminescent (EL) efficiencies to rates of about 2%, but additionally, QCE allows the modulation of the emission energy.13–19

By using the QCE some research groups have tried to manipulate silicon at the nanoscale to fabricate multiple luminescent devices ranging from ambient lighting to light emitting diodes (LEDs) for multiple purposes.20–22 Unfortunately, although the EL emission efficiencies have improved due to the QCE,23,24 these are not yet enough to contrive the full range of silicon-based devices that the modern society demands.

Some research works have observed a considerable improvement of the integrated emission intensity from silicon emitting quantum dots (SiQDs) when these are adequately coupled with nanostructured noble metal particles.25–35 Therefore, the fabrication of coupled silicon–metal nanostructures could be one possible solution for the manufacture of multiple luminescent devices based on silicon.36 However, it must be emphasized that fabrication processes to make silicon–noble metal coupling structures which show photoluminescence enhancement are not simple. Indeed, to our knowledge, the best enhancements ratios from these kind of structures have been reported by two research groups (Biteen et al. and Benami et al.),26–31 and both groups are characterized by using similar equipment and methodologies for their preparation.

In those works published by Biteen et al. the used methodology can be summarized in four steps: (i) implantation of Si+ ions into a SiO2 substrate, (ii) three-stage annealing into argon or hydrogen atmospheres to generate SiQDs and to eliminate defect states in SiO2 matrix, (iii) substrate etching by using an aqueous HF solution to diminish the distance from the substrate surface to the implanted SiQDs, and (iv) deposition of a nanoporous gold layer over the etched surface of SiO2, or else, fabrication of a silver particles pattern by means of nanolithography. Meanwhile, Benami et al. carry out steps (i) and (ii) in akin way to Biteen's methodology, and add a third step in which the sample is implanted with Ag2+ ions at different energies to vary the distance between the SiQDs and the silver nanoparticles that are formed after a second annealing process.

The results provided by both groups are encouraging, because they throw light on two alluring effects observed when nanoconfined silicon particles are located in the vicinity of noble metals nanoparticles. First, they provide experimental evidence of twofold to even threefold PL enhancement, compared to the PL from those SiQDs which are not coupled. Second, they report different degrees of PL quenching when SiQDs are placed right next to metal particles in an homogenous mixture. To wit, those effects allow us to glimpse that distances between silicon and metal particles are critical in order to prevent quenching and to achieve enhancements. However, there are three unattended issues we believe must be addressed in order to harness this PL enhancement effect in designing functional commercial devices, which are: (a) fabrication techniques must be highly compatible with those used in microelectronic industry, (b) it is essential to give a comprehensive description of particle characteristics of both metal and SiQDs, and (c) it should be clarified the existent relationship between PL enhancement and the separation distance between SiQDs and metal particles.

In this work, we have tailored a multilayered structure (coupling silicon to gold) which exhibits a twofold PL enhancement. For its fabrication, we have combined Remote Plasma Enhanced Chemical Vapor Deposition (RPECVD) and Sputtering techniques into a method which has a very strong rapport with those used in the microelectronics industry, i.e. dry, low temperature, economical and fast depositions. Further, our paper offers a thorough study of size and particle density of both gold and silicon nanoparticles; and it is also briefly discussed the role played by the surrounding medium in which particles are embedded when the PL enhancement is achieved. Finally, our methodology allowed us to carry out a good analysis of the separation distances between SiQDs and the monolayer of gold nanoparticles (AuNPs) in order to obtain PL enhancement.

Experimental section

The AuNPs were deposited using a Cressington 108 Sputter Coater with Au target (99.9999% purity) in 0.8 mbar argon atmosphere. Quartz and silicon n-type (100) high resistivity (200 Ω cm) were used as substrates. Prior to deposition, quartz substrates were solvent cleaned with trichloroethylene and acetone. Silicon substrates were dipped in P-etch solution to remove native oxide.37 Two thin films of silicon nitride with different chemical compositions and thickness were deposited using a Remote Plasma Enhanced Chemical Vapor Deposition (RPECVD) system whose characteristics have been reported previously.38 Substrate temperature of 300 °C, radio frequency power of 150 W and pressure of the reaction chamber of 300 mT were used as deposition parameters. The flow rates of H2, Ar and SiH2Cl2 were 10, 75 and 5 sccm respectively for all the deposited films. Flow rate of NH3 was settled in 600 sccm for purposes of growing a non-radiative silicon nitride thin insulating film (DIEL) and 200 sccm for growing silicon quantum dots embedded in a chlorinated silicon nitride matrix film (EMIS). The thickness of these layers was varied for all the fabricated structures by controlling the deposition time.

Null ellipsometry was used to measure thickness (Th) of the films using a manual Gaertner 117 ellipsometer equipped with a He–Ne laser (λ = 632 nm). Photoluminescence (PL) measurements were carried out in a totally dark room at ambient temperature using an unfocused beam of 25 mW from a Kimmon He–Cd laser operating at 325 nm (3.81 eV). The PL spectra were recorded with a Fluoromax-Spex spectrofluorometer using as signal detector an optical fiber normal to the sample emission. Ultraviolet-visible (UV-vis) transmission measurements were carried out in the range from 200 to 1100 nm using a double-beam PerkinElmer Lambda 35 UV-vis spectrophotometer. The shape, size and distribution of the AuNPs and SiQDs were confirmed by high resolution electron microscopy (HRTEM) and high angle annular dark field (HAADF) using a field emission gun (JEM-2010F) which operates at 200 kV near the Scherrer focus, with a theoretical point to point resolution of 0.19 nm. The HRTEM images in planar view of the samples were recorded with a CCD camera and treated with a digital analysis program. A Field Emission-Scanning Electron Microscope (JEOL7600F FE-SEM) was used to observe shape and distribution of the AuNPs for different growing times.

Results and discussion

Taking into consideration the possible existence of an optimal separation distance between SiQDs and AuNPS for our system, we tailored our structure in three stages. First stage reports and discuss the methodology we used to fabricate the “emitter field”, i.e., the deposition of the SiQDs by means of RPECVD. In this stage we also perform an analysis of our selected films (DIEL and EMIS) to be implemented in the final multilayered structure. In second stage we used Sputtering technique to fabricate the gold nanoparticles monolayer (AuNPs). Additionally, in second stage we discuss about the particle characteristics of the AuNPs, e.g. particle size, particle shape and particle density. Finally, in the third stage we performed the tuning between the SiQDs and AuNPs films, we did this engineering by varying the separation distances between the films and recording the PL changes from each coupled structure.

Fabrication and selection of the emission field (SiQDs)

Quantum confinement (QC) in silicon clusters can be identified as strong, medium and weak. Strong QC exists when the Bohr radius of the exciton is larger than the size of the confined system (∼5.3 nm). The latter implies that the probability of radiative transitions from silicon nanoparticles will increase when particle diameters fall below 10 nm approximately, because their band energy will become quasi-direct.39 Then, we might expect the maximum possible PL efficiencies for those emitter fields conformed by clusters with sizes below 5 nm. Therefore, our first design objective is to fabricate a set of thin films containing SiQDs with strong QC effect.

On the other hand, and in order to avoid in a feasible extent the non radiative recombination from charge carriers in our films, passivation of silicon quantum dots was carried out by means of a chlorinated precursor (SiH2Cl2) whose use has demonstrated diminished dangling bonds and therefore the non radiative localized states.40

The Fig. 1 contains the photoluminescence spectra of seven thin films constituted by SiQDs embedded in a silicon nitride matrix. Those samples were used in a previous study41 and were deposited by using our RPECVD system with different NH3 flow rates. With the exception of sample E, which has a film thickness of 375 nm, all other samples of the group have thicknesses ranging between 78 and 85 nm. The PL integrated intensity associated to each sample depends mostly on the amount of SiQDs the sample has, i.e., SiQDs density (Si-ρ); while the location of the maximum PL peak (MPLp) depends on the SiQDs average size (Si-Ø).


image file: c5ra19114a-f1.tif
Fig. 1 Photoluminescent spectra of seven thin films containing SiQDs embedded in a chlorinated silicon nitride matrix using different NH3 flow rates. PL integrated intensity and location of the main peak are related to superficial density and average size of the particles respectively. “Reprinted from A. Rodríguez, J. Arenas, A. L. Pérez-Martínez and J. C. Alonso, Role of ammonia in depositing silicon nanoparticles by remote plasma enhanced chemical vapor deposition, Mater. Lett., 2014, 125, 44–47, with permission from Elsevier”.

By maintaining unaltered the previously reported deposition conditions,41 but feeding our RPECVD system with different ammonia flows (Aflow), we can change Si-Ø and therefore predict the MPLp of the deposited film. The linear model expressed in eqn (1), is a tool that allows us to grow SiQDs in a controlled way.41

 
MPLp = −0.3079 × Aflow + 557.6328 (1)

The model has an accuracy of 99% to fabricate SiQDs films with a maximum PL peak between 400 and 540 nm. However, it is important to take into consideration that blue shifts will sacrifice Si-ρ, with the consequent integrated intensity decrement. An appropriate example is seen in the emission spectrum of sample E from Fig. 1, which has a four times bigger thickness that sample C, but a ten times lower integrated intensity. Hence, when the Aflow rises up to 600 sccm it is possible to grow a film with Si-ρ very close to zero. A film with Si-ρ ≈ 0 could be considered as a pure silicon nitride dielectric ≈ Si3N4.42

The Fig. 2 shows the emission spectra from EMIS film (200 sccm Aflow) and DIEL film (600 sccm Aflow). DIEL and EMIS films have similar thicknesses, 96.5 and 97.9 nm respectively. However, EMIS has PL intensity 22 times higher than DIEL due to its higher Si-ρ. Additionally, DIEL film exhibits almost identical optical characteristics to those shown by stoichiometric silicon nitride reported elsewhere.42,43 Therefore, in our structure design we will use DIEL type growths for all those design steps where a dielectric of Si3N4 is needed. One HRTEM image of our DIEL film is available as ESI (Fig. 1). Regarding the film thickness, it is worth to note that thickness in both EMIS and DIEL films can be controlled by variations in the deposition times.


image file: c5ra19114a-f2.tif
Fig. 2 Comparison between emission spectra from EMIS (200 sccm Aflow) and DIEL (600 sccm Aflow). Both films have about the same thickness. The integrated PL intensity from the EMIS layer is 22 times bigger than DIEL layer.

A HAADF micrograph obtained from an EMIS film is shown in Fig. 3. A uniform particle distribution throughout the sample is observed, confirming a good Si-ρ/Si-Ø ratio. This ratio gives rise to the largest PL integrated intensity within the range of 400–540 nm. A HRTEM micrograph is shown in the inset (a). The observed uniformity of the matrix indicates a very high quality of stoichiometric silicon nitride. On the other hand, the low contrast between matrix and SiQDs is expected due silicon is the base element in both components of the system. From inset (a) is also possible to see in detail the SiQDs morphology, most of the nanoparticles show spherical shapes, but there are also some particles with prolate spherical shapes in a lower proportion. The identified spheroids shapes confirm a confinement in three directions and therefore their nature of emitting quantum dots.


image file: c5ra19114a-f3.tif
Fig. 3 HAADF image obtained from an EMIS film. Uniform particle distribution throughout the sample is observed. Inset (a) of this sample shows spherical shape of the SiQDs and therefore confinement in three dimensions of the particles. Inset (b) shows the histogram of the size distribution of the SiQDs. Average size is 3.1 nm and superficial density is about 6.04 × 10¹² particles per cm2.

Moreover, inset (b) of Fig. 3 shows a histogram with the SiQDs size distribution of EMIS film. The Si-Ø is 3.1 nm, while Si-ρ is about 6.04 × 10¹² particles per cm2. By using well known eqn (2) and a value of 1.16 eV to ESiBulk, we calculated the quantum confinement constant C, resulting in a value of 11.9 nm2 eV, which is in good agreement with those confinement constants associated to other based silicon emitter fields reported elsewhere.6,7,44

 
EPL = ESiBulk + C/d2 (2)

Thence, to use EMIS type depositions as the emitter field in our structure, vests the design with two advantages: (a) EMIS film has the highest possible Si-ρ for a film grown in our RPECVD system, and consequently, the biggest PL integrated intensity. (b) Since the emitter field is embedded in silicon nitride, no interface is going to be formed when DIEL layers are deposited under or over an EMIS film. The latter, avoids Fabry–Perot reflections, to the extent feasible.45,46

Design of the gold monolayer (AuNPs)

Nanostructured noble metals show extinction plasmonic resonances in the visible section of the electromagnetic spectrum. Due that the location of these resonances depends on the surrounding medium, size, density and shape of the particle, they are an excellent resource for monitoring the quality and reproducibility of the gold-nanoparticles monolayer.47–51 For this section we have used the resonance location method to fabricate a high quality/highly reproducible monolayer of nearly spherical gold nanoparticles.

A previous work about the mechanisms of metal growing by sputtering52 pointed out that there are two important considerations that must be made in order to grow a spherical monolayer? First, the relationship between the initial nucleating centers and the particle density (Au-ρ); which cannot be changed for a determined substrate and second, the linear relationship between deposition time and particle average diameter (Au-Ø), which means that for longer deposition times, the bigger the Au-Ø.

However, nanoscale gold tends to agglomerate easily, for long deposition times these agglomerations results in nanoporous gold thin films rather than a homogeneous distribution of spherical particles. The location of the plasmonic resonance in a nanoporous gold thin film is difficult to reproduce because there are always slight changes in the location, even using identical deposition parameters. Those changes are attributed to an unpredictable location of the electric field surrounding the particles, because in nanoporous films there are not well defined particle shapes. Nevertheless, for spherical gold particles the reproducibility increases significantly, because the electrical field is located homogeneously around each particle forming the monolayer.

Therefore, to analyze and to correlate the particle characteristics of each growth we have defined the ratio RAu = Au-ρ/Au-Ø. To avoid agglomeration we seek growths with the lowest Au-Ø. On the other hand, we needed to obtain the highest possible Au-ρ, because when the electrical fields around the particles work in a collective way, it is easier to identify the extinction plasmonic resonances of the gold monolayer. Therefore, it is possible to conclude that the higher the value of RAu the better the specimen is for our purpose.

By using Sputtering technique, we carried out gold depositions on crystalline silicon wafers and quartz using short plasma times. We conducted ten growths with deposition times ranging from 1 to 10 seconds, and 1 s intervals between each deposition. Each specimen was named with the number of seconds used for its fabrication.

To determine the values of density and particle size diameter, a statistical study of the deposited AuNPs was performed. The particles were classified by size into 6 groups: Par-Ø ≤ 1 nm, 1 nm < Par-Ø ≤ 2 nm, 2 nm < Par-Ø ≤ 3 nm, 3 nm < Par-Ø ≤ 4 nm, 4 nm < Par-Ø ≤ 5 nm, 5 nm < Par-Ø ≤ 6 nm. About 50 HRTEM micrographs were obtained in different areas of each analyzed sample. The occurrence percentage of each particle group was reported in a histogram.

The described statistical analysis to obtain Au-ρ and Au-Ø was only done for depositions 4 and 5. This is because for depositions 1 and 2 it was almost impossible to detect AuNPs. In these samples we carried out observations at multiple different zones but the appearance of particles was rather sporadic. Compared to depositions 1 and 2, the sample 3 had a significant Au-ρ increase, however this sample was not subjected to analysis because at first glance its Au-ρ was estimated smaller than sample's 4.

After statistical analysis, sample 4 showed Au-ρ = 2.05 × 10¹² particles per cm2, Au-Ø = 2.66 nm, and RAu = 0.77. Meanwhile, in sample 5 was identified a good particle size homogeneity because of around 60% of the particles have sizes falling between 1 and 3 nanometers. The obtained results from sample 5 after the statistical analysis were: Au-ρ = 2.52 × 10¹² particles per cm2, Au-Ø = 2.90 nm and RAu = 0.86. The histogram of sample 5 can be found as ESI (Fig. 2).

A HRTEM micrograph showing the AuNPs distribution of sample 5 is shown in Fig. 4. It is convenient to emphasize that particle distribution is uniform all over the sample and most of the particles have quasi-spherical shapes. Additionally, inset (a) provides information concerning to the existing space between AuNPs; we measured in a random way some of those spaces, the resulting distances ranges from 0.8 to 1.5 nm. Evidently, this is purely qualitative information, because we did not make a formal statistical analysis of the separation distances. However, this is very powerful information because it allows us to understand what is happening with deposition times longer than 5 seconds. In the inset (a), a small white box frames a pair of particles that have collided during their growth. This phenomenon is not widespread in sample 5, but occasionally it is possible to notice that kind of fused particles.


image file: c5ra19114a-f4.tif
Fig. 4 HRTEM micrograph obtained from sample 5, AuNPs with RAu = 0.86 are deposited over silicon wafer. Uniform particle distribution and particle quasi-spherical shapes throughout the sample are observed. Inset (a) shows the fused particle phenomenon when growth time is increased. Inset (b) shows a characteristic gold diffraction pattern.

As previously mentioned, the reproducibility was monitored by the location of the plasmonic resonances. The absorbance spectrum represented by the continuum line in the Fig. 5 shows the plasmonic resonance location of the sample 5, which is located at 540 ± 3 nm. Several subsequent growths were made by using identical parameters to those used in sample 5, the location of the resonance and even the shape of the spectrum remain unaltered; the dotted line of Fig. 5 displays an absorbance spectrum of any subsequent deposition using the sample 5 parameters.


image file: c5ra19114a-f5.tif
Fig. 5 Absorbance spectrum of sample 5 (continuum line) and absorbance spectrum of any subsequent growth made using identical deposition parameters to those used in sample 5 (dotted line). The shape of the spectrum and the location of the resonance (540 nm) remain unaltered, confirming a very high reproducibility.

For deposition 6, fused particles phenomenon is much more widespread than sample 5. About 30% of the nanoparticles in sample 6 have collided, forming a larger and irregular particle. The incidence of particle merging promotes an Au-ρ reduction and Au-Ø increment, which in turn results in a sharp drop of RAu value. Low values of RAu distort the resonance location and therefore its reproducibility; in samples 6 to 10 it is possible to estimate at first glance that RAu values are below 0.86. Therefore, beyond growth 5 any rise in deposition time will make RAu to decrease until it reaches zero, which is the value for a nanoporous gold thin film. A Field Emission SEM micrograph from a 20 seconds deposition can be found in ESI (Fig. 3).

Engineering of the coupled silicon–gold structure

The aim of this fabrication methodology was to achieve a functional coupling between EMIS film and our selected AuNPs monolayer through the variation of the DIEL film thickness amongst them, in order to obtain an enhancement of photoluminescence from the coupled system. All tested structures were fabricated as follow: (1) deposition of a gold monolayer (AuNPs) over a silicon wafer, (2) deposition of a DIEL film over the AuNPs, (3) deposition of an EMIS film over the previously deposited DIEL layer. Deposition time of the DIEL layer was adjusted by steps of 30 seconds to get thicknesses of 5 nm, 10 nm, 15 nm, and so on. Meanwhile, deposition time was accurately adjusted to obtain EMIS films with thicknesses of 90 nm for all the fabricated structures.

In Fig. 6 are showed the absorption spectra of some layered structures on quartz substrate: [i] absorption spectrum of DIEL layer (10 nm), [ii] absorption spectrum of gold nanoparticles surrounded by DIEL layer (10 nm), [iii] absorption spectrum of gold nanoparticles surrounded by EMIS film (90 nm). As it is expected, DIEL layer is transparent above 250 nm since stoichiometric silicon nitride has a band gap of ∼5 eV. On the other hand, when the DIEL medium surrounds the AuNPs previously deposited on the substrate it is possible to observe the resonant peak of the local surface plasmon at ∼538 nm (2.3 eV). Likewise, it can be noticed in the absorption spectrum of AuNPs/EMIS structure the presence of the metal nanoparticle resonance peak very close to that of the AuNPs/DIEL assembly in spite of different thickness of the films. This high homogeneity of the silicon nitride phase of the DIEL and EMIS layers does not distort in a high manner the resonance location of our gold monolayer, therefore the above described multilayer structures will not change the initial properties of each layer used to fabricate them.


image file: c5ra19114a-f6.tif
Fig. 6 Absorption spectra of (i) 10 nm of DIEL layer, (ii) 10 nm of DIEL layer on AuNPs and (iii) 90 nm of EMIS layer on AuNPs. All the layered structures were deposited on quartz. No considerable absorption peak-shift is observed in (ii) and (iii) despite different thickness of the films.

From Fig. 7 can be observed four different configurations of the proposed structures using DIEL layers of 0, 30, 60 and 90 seconds, which corresponded to thickness of 0, 5, 10 and 15 nm respectively. For each configuration there was one sample as reference without AuNPs deposited on the silicon substrate for comparative purposes, i.e., only steps (2) and (3) of the previously described methodology were carried out for our control sample. PL spectra of the first configuration devoid of a DIEL layer did not show change in the PL integrated intensity in spite of the presence of Au nanoparticles in one of the structures (Fig. 7a). In the second configuration were grown 30 seconds of DIEL before the EMIS film deposition (Fig. 7b). We noted an enhancement ratio of 17% of the maximum PL peak and small red-shift (502 nm to 513 nm) from the coupled structure compared with the reference. The third configuration (Fig. 7c) using 60 s of DIEL layer, showed an integrated PL enhancement of 105%, and an enhancement of the maximum PL peak of 87% from the sample with AuNPs deposited. A smaller red-shift (499 nm to 504 nm) compared with the second configuration is also noticed. Finally in Fig. 7d, it is possible to observe a reduction of the PL intensity peak ratio up to 7% and practically no peak-shift from the sample with AuNPs. This tendency of slight maximum PL peak enhancement of the coupled samples with regard to their references is persistent for 120 and 150 seconds corresponding to 20 and 25 nm of deposited DIEL layer, and can be observed in the scatter plot of Fig. 8.


image file: c5ra19114a-f7.tif
Fig. 7 Four different configurations of the proposed structures using DIEL layers of 0, 30, 60 and 90 seconds, which corresponded to thickness of 0, 5, 10 and 15 nm respectively. Deposition time was adjusted for obtaining thickness of the EMIS films of 90 nm. For each configuration there was one sample used as reference without AuNPs deposited on the silicon substrate for comparative purposes. The major PL enhancement ratio was found for a thickness of the DIEL layer of 10 nm (schematic diagrams of the structures inside each graphic are not in scale).

image file: c5ra19114a-f8.tif
Fig. 8 Scatter plot of the maximum PL peak ratio and integrated PL intensity ratio of the samples with 0, 30, 60, 90, 120 and 150 seconds of deposited DIEL layer.

As it was mentioned before, other researching groups have studied luminescence of structures metal–SiQDs as their separation distance get closer. They showed a Gaussian type PL enhancement ratio relative to their ref. 25–31. This latter is not just an effect of bringing closer different material nanoparticles, but probably an effect of different particle density distribution through determined distances of the implanted zone. Consequently, it was difficult to define a maximum PL enhancement for a defined density concentration and separation distance among metal nanoparticles and silicon nanocrystals. In our experiment the homogeneous distribution achieved of the metallic monolayer and SiQDs radiative film let us to identify clearly that there is a well specific separation distance between the AuNPs/EMIS to attain maximum light enhancement in the system. It is worth mentioning that methodical reproduction of the experiment has confirmed 10 nm DIEL thickness in our structures in order to achieve maximum light coupling.

We consider that there are two physical effects that could take place in the observed enhancement of these layered structures: (a) coupling of the light from the emitter field, (i.e. EMIS layer) to the Localized Surface Plasmon Resonance (LSPR) of the AuNPs, and (b) a change of the scattering mechanisms of the primary light (laser source of excitation) in the coupled structure.

The assumption of the enhancement due to the LSPR could be reasonable due to absorption–emission bandwidth of the SiQDs is wide enough to allow the coupling in a diffraction-limited way, as the one described by Kress et al.53 This diffraction-limited coupling (DLC) has reported that a photon or exciton dipole coming from semiconductor nanocrystals with different sizes, (i.e. different energies) can couple to the local electric field surrounding the small gold nanoparticles. Then, the integrated structure will not only emit photons but also surface plasmon polaritons (SSPs) giving place to some little amount of the observed enhancement. This type of coupling also explains in some extent the slight redshifts observed from the coupled structures. However, it is not possible to attribute the whole enhancement to the LSRP coupling, because just one slice of SiQDs contained in the EMIS layer (which is 90 nm thick) is located at the correct distance to generate SPPs.

The other amount of the observed enhancement (and the bigger one) could be attributed to the seeded AuNPs beneath the EMIS layer in which SiQDs are contained. In its final configuration the multilayer structure will change the manner of scattering and interference of the primary light (He–Cd laser 325 nm) and this should be the responsible of an increment in the photon density absorbed by SiQDs layer.

It is important to stand out that further theoretical and experimental studies are needed to determine and explain thoroughly the mechanisms responsible of the observed enhancements and the contribution percentage of each one. However, from our work it is possible to affirm conclusively that an optimum separation distance between silicon quantum dots and gold nanoparticles is needed to achieve a PL enhancement.

Conclusions

In this paper we reported a new method for manufacturing a gold–silicon coupled structure which exhibited a PL integrated enhancement of 105%. Three stages were carried out for its manufacture: design of emitter field, design of gold nanoparticles and coupling between fields.

In first stage and due the quantum confinement effect, it was possible to us to tune the maximum PL peak from emitter field to 505 nm, close enough to the resonance peak of gold nanoparticles, favoring the interaction between these two layers.

In gold nanoparticles design stage, we consider the convenience of a spherical particle because it concentrates electrical fields uniformly and therefore, just one peak of plasmonic resonance appears in a very reproducible manner. Meanwhile density and particle size played a major role regarding location of the resonance peak.

In third stage we found than a 10 nm layer of silicon nitride generated the maximum possible enhancement. We believe that there may be two combined physical effects responsible of the enhancement: (a) the LSPR diffraction-limited coupling and (b) a change of the scattering mechanisms of the primary light.

Our results show the feasibility to manufacture silicon based structures with enhanced luminescence by using dry and low temperature techniques, such as those used in microelectronic industry.

Acknowledgements

All authors would like to acknowledge the technical assistance in ellipsometry and UV-Visible spectroscopy from J. M. Garcia León and M. A. Canseco. Authors are also grateful to Jose Arturo Martinez Rodriguez for TEM sample preparation and to Fis. Roberto Hernández for technical assistance in the TEM analysis as well as the support received from Fís. Héctor de Jesús Cruz-Manjarrez Flores-Alonso in the preparation and operation of the vacuum systems used for this work. First author is grateful for the supported received by the Mexican Council for Science and Technology (CONACyT-México) through the Ph.D. scholarship No. 212453. This work was partially supported by the project PAPIIT UNAM IG100614-2.

References

  1. D. Sarti and R. Einhaus, Sol. Energy Mater. Sol. Cells, 2002, 72, 27–40 CrossRef CAS.
  2. A. Kingon, J. Maria and S. Streiffer, Nature, 2000, 406, 1032–1038 CrossRef CAS PubMed.
  3. M. Schulz, Nature, 1999, 399, 729–730 CrossRef CAS.
  4. D. J. Lockwood and L. Pavesi, Silicon Photonics, Springer Berlin Heidelberg, Berlin, Heidelberg, 2004, vol. 94 Search PubMed.
  5. D. Das and A. Samanta, Phys. Chem. Chem. Phys., 2015, 17, 5063–5071 RSC.
  6. T.-W. Kim, C.-H. Cho, B.-H. Kim and S.-J. Park, Appl. Phys. Lett., 2006, 88, 123102 CrossRef.
  7. T.-Y. Kim, N.-M. Park, K.-H. Kim, G. Y. Sung, Y.-W. Ok, T.-Y. Seong and C.-J. Choi, Appl. Phys. Lett., 2004, 85, 5355 CrossRef CAS.
  8. Y. C. Fang, Z. J. Zhang and M. Lu, J. Lumin., 2007, 126, 145–148 CrossRef CAS.
  9. A. Irrera, P. Artoni, F. Iacona, E. F. Pecora, G. Franzò, M. Galli, B. Fazio, S. Boninelli and F. Priolo, Nanotechnology, 2012, 23, 075204 CrossRef CAS PubMed.
  10. A. Rodriguez, J. Arenas and J. C. Alonso, J. Lumin., 2012, 132, 2385–2389 CrossRef CAS.
  11. W. Liao, X. Zeng, X. Wen, W. Zheng, Y. Wen and W. Yao, J. Electron. Mater., 2015, 44, 1015–1020 CrossRef CAS.
  12. B. Sain and D. Das, J. Lumin., 2015, 158, 11–18 CrossRef CAS.
  13. B. M. Monroy, G. Santana, A. Benami, A. Ortiz, J. C. Alonso, J. Fandiño, F. Cruz-Gandarilla, J. Aguilar-Hernández, G. Contreras-Puente, A. López-Suárez and A. Oliver, J. Nanosci. Nanotechnol., 2009, 9, 2902–2909 CrossRef CAS PubMed.
  14. R. Kumar Bommali, S. Preet Singh, S. Rai, P. Mishra, B. R. Sekhar, G. Vijaya Prakash and P. Srivastava, J. Appl. Phys., 2012, 112, 123518 CrossRef.
  15. P. Nguyen, D. Kepaptsoglou, Q. Ramasse and A. Olsen, Phys. Rev. B: Condens. Matter Mater. Phys., 2012, 85, 1–8 Search PubMed.
  16. Y. Q. Wang, Y. G. Wang, L. Cao and Z. X. Cao, Appl. Phys. Lett., 2003, 83, 3474 CrossRef CAS.
  17. R. Walters, J. Kalkman, A. Polman, H. Atwater and M. de Dood, Phys. Rev. B: Condens. Matter Mater. Phys., 2006, 73, 2–5 CrossRef.
  18. M. Estes and G. Moddel, Phys. Rev. B: Condens. Matter Mater. Phys., 1996, 54, 14633–14642 CrossRef CAS.
  19. F. Komarov, L. Vlasukova, I. Parkhomenko, O. Milchanin, A. Mudryi, A. Togambaeva and O. Korolik, Thin Solid Films, 2015, 579, 110–115 CrossRef CAS.
  20. A. G. Nassiopoulos, S. Grigoropoulos and D. Papadimitriou, Appl. Phys. Lett., 1996, 69, 2267–2269 CrossRef CAS.
  21. L. Pavesi, L. Dal Negro, C. Mazzoleni, G. Franzò and F. Priolo, Nature, 2000, 408, 440–444 CrossRef CAS PubMed.
  22. W. L. Ng, M. A. Lourenço, R. M. Gwilliam, S. Ledain, G. Shao and K. P. Homewood, Nature, 2001, 410, 192–194 CrossRef CAS PubMed.
  23. K. S. Cho, N.-M. Park, T.-Y. Kim, K.-H. Kim, G. Y. Sung and J. H. Shin, Appl. Phys. Lett., 2005, 86, 071909 CrossRef.
  24. J. C. Alonso, F. A. Pulgarín, B. M. Monroy, A. Benami, M. Bizarro and A. Ortiz, Thin Solid Films, 2010, 518, 3891–3893 CrossRef CAS.
  25. A. L. Tchebotareva, M. J. A. de Dood, J. S. Biteen, H. A. Atwater and A. Polman, J. Lumin., 2005, 114, 137–144 CrossRef CAS.
  26. J. S. Biteen, D. Pacifici, N. S. Lewis and H. A. Atwater, Nano Lett., 2005, 5, 1768–1773 CrossRef CAS PubMed.
  27. J. S. Biteen, N. S. Lewis, H. A. Atwater, H. Mertens and A. Polman, Appl. Phys. Lett., 2006, 88, 131109 CrossRef.
  28. H. Mertens, J. S. Biteen, H. A. Atwater and A. Polman, Nano Lett., 2006, 6, 2622–2625 CrossRef CAS PubMed.
  29. J. S. Biteen, L. A. Sweatlock, H. Mertens, N. S. Lewis, A. Polman and H. A. Atwater, J. Phys. Chem. C, 2007, 111, 13372–13377 CAS.
  30. A. Benami, A. Lopez-Suarez, L. Rodríguez-Fernández, A. Crespo-Sosa, J. C. Cheang-Wong, J. A. Reyes-Esqueda and A. Oliver, AIP Adv., 2012, 2, 012193 CrossRef.
  31. A. Benami, Y. El Hassouani, A. Oliver and A. Lopez-Suarez, Spectrosc. Lett., 2014, 47, 411–414 CrossRef CAS.
  32. D. Li, F. Wang and D. Yang, Nanoscale, 2013, 5, 3435–3440 RSC.
  33. F. Wang, D. Li, L. Jin, C. Ren, D. Yang and D. Que, Opt. Lett., 2013, 38, 2832–2834 CrossRef CAS PubMed.
  34. F. Wang, D. Li, L. Jin, C. Ren, D. Yang and D. Que, Opt. Express, 2013, 21, 1675–1686 CrossRef CAS PubMed.
  35. F. Wang, M. Wang, D. Li and D. Yang, Opt. Mater. Express, 2012, 2, 1437–1448 CrossRef CAS.
  36. E. Ozbay, Science, 2006, 311, 189–193 CrossRef CAS PubMed.
  37. J. Fandiño, G. Santana, L. Rodríguez-Fernández, J. C. Cheang-Wong, A. Ortiz and J. C. Alonso, J. Vac. Sci. Technol., A, 2005, 23, 248 Search PubMed.
  38. A. Rodriguez-Gómez, A. García-Valenzuela, E. Haro-Poniatowski and J. C. Alonso-Huitrón, J. Appl. Phys., 2013, 113, 233102 CrossRef.
  39. P. F. Trwoga, A. J. Kenyon and C. W. Pitt, J. Appl. Phys., 1998, 83, 3789 CrossRef CAS.
  40. A. Martínez, J. C. Alonso, L. E. Sansores and R. Salcedo, J. Phys. Chem. C, 2010, 114, 12427–12431 Search PubMed.
  41. A. Rodríguez, J. Arenas, A. L. Pérez-Martínez and J. C. Alonso, Mater. Lett., 2014, 125, 44–47 CrossRef.
  42. S. V. Deshpande, E. Gulari, S. W. Brown and S. C. Rand, J. Appl. Phys., 1995, 77, 6534–6541 CrossRef CAS.
  43. H. R. Philipp, J. Electrochem. Soc., 1973, 120, 295 CrossRef CAS.
  44. N.-M. Park, C.-J. Choi, T.-Y. Seong and S.-J. Park, Phys. Rev. Lett., 2001, 86, 1355–1357 CrossRef CAS PubMed.
  45. F. Giorgis, Appl. Phys. Lett., 2000, 77, 522–524 CrossRef CAS.
  46. M. Schnabel, C. Summonte, S. A. Dyakov, M. Canino, L. López-Conesa, P. Löper, S. Janz and P. R. Wilshaw, J. Appl. Phys., 2015, 117, 045307 CrossRef.
  47. S. Oldenburg, R. Averitt, S. Westcott and N. Halas, Chem. Phys. Lett., 1998, 288, 243–247 CrossRef CAS.
  48. M. Hu, J. Chen, Z.-Y. Li, L. Au, G. V. Hartland, X. Li, M. Marquez and Y. Xia, Chem. Soc. Rev., 2006, 35, 1084–1094 RSC.
  49. E. J. R. Vesseur, R. De Waele, M. Kuttge and A. Polman, Nano Lett., 2007, 7, 2843–2846 CrossRef CAS PubMed.
  50. M. A. Garcia, J. Phys. D: Appl. Phys., 2012, 45, 389501 CrossRef.
  51. C. Noguez, J. Phys. Chem. C, 2007, 111, 3806–3819 CAS.
  52. M. Hirasawa, H. Shirakawa, H. Hamamura, Y. Egashira and H. Komiyama, J. Appl. Phys., 1997, 82, 1404–1407 CrossRef CAS.
  53. S. J. P. Kress, P. Richner, S. V. Jayanti, P. Galliker, D. K. Kim, D. Poulikakos and D. J. Norris, Nano Lett., 2014, 14, 5827–5833 CrossRef CAS PubMed.

Footnote

Electronic supplementary information (ESI) available: A HRTEM micrograph obtained from a DIEL film is showed in Fig. 1. An histogram of sample 5, which are AuNPs deposited over silicon wafer is showed in Fig. 2. A Field Emission SEM micrograph from a 20 s deposition of AuNPs can be found in Fig. 3. See DOI: 10.1039/c5ra19114a

This journal is © The Royal Society of Chemistry 2015
Click here to see how this site uses Cookies. View our privacy policy here.