Swelling technique inspired synthesis of a fluorescent composite sensor for highly selective detection of bifenthrin

Xiao Weia, Tongfan Haoa, Yeqing Xub, Kai Lua, Hongji Lib, Yongsheng Yan*b and Zhiping Zhou*a
aSchool of Material Science and Engineering, Jiangsu University, Zhenjiang 212013, China. E-mail: zhouzp@ujs.edu.cn
bSchool of Chemistry and Chemical Engineering, Jiangsu University, Zhenjiang 212013, China. E-mail: jdwxtx@126.com; Fax: +86 0511 88791800; Tel: +86 0511 88790683

Received 3rd August 2015 , Accepted 8th September 2015

First published on 8th September 2015


Abstract

Pesticide pollution has become a serious problem that threatens public health, so it is necessary to develop a method that can detect pesticides rapidly and sensitively. In this study, we report a novel fluorescent imprinted sensor based on quantum dots (QDs) synthesized via a facile and versatile swelling technique for highly selective detection of bifenthrin (BI). Compared with other fluorescent molecularly imprinted polymers (MIPs), it has three significant differences: firstly, polystyrene (PS) microspheres make up the polymer matrix and were prepared in advance; secondly, the interactions are not hydrogen bonding and covalent interactions, but van der Waals and hydrophobic forces; thirdly, aqueous QDs were successful applied to the swelling process using a polymerizable surfactant. The unique fluorescent sensor (MIPs (PS)-OVDAC/CdTe QDs) possesses the strong fluorescence and sensitivity of QDs and the high selectivity of molecularly imprinted polymers as well as a uniform morphology via this novel swelling strategy. As a result, the fluorescence intensity of the MIPs (PS)-OVDAC/CdTe QDs was strongly decreased within less than 25 min upon binding BI, and the quenching fractions of the MIPs (PS)-OVDAC/CdTe QDs presented a good linearity with BI concentrations in the range of 0.5–40 μM with a correlation coefficient of 0.9918. In addition, the limit of detection (LOD) was as low as 0.08 μmol L−1 and a high imprinting factor of 4.11 was obtained. The developed method was successfully applied to the determination of BI in honey samples. The present study provides a facile and efficient strategy to develop fluorescent sensors for rapid recognition and selective detection of organic pollutants from complex matrices.

1 Introduction

Pyrethroids are a new kind of bionic pesticide that play important roles in agricultural situations.1 Due to their relatively low toxicity and high environmental compatibility, they have been used to replace organochlorines and organophosphorus insecticides and as a class of effective insecticides in numerous pest controls.2 However, pyrethroids have been confirmed to cause seizures and disturb consciousness by affecting the central nervous system of humans.3 Therefore, there is a need to develop new methods to monitor pyrethroid poisoning. To date, analytical methods such as high performance liquid chromatography (HPLC),4 liquid chromatography-mass spectrophotometry (LC/MS),5 and gas chromatography (GC)6 have been established for the determination of pyrethroids. However, these methods have shortcomings, including long analysis times, high cost, low selectivity, and possible production of secondary pollutants. Thus, the development of a rapid, facile, selective and sensitive analytical method for pyrethroid determination is of great importance.

In recent years, semiconductor quantum dots (QDs) as high-performance luminescent materials have attracted extensive attention in the scientific community due to their excellent properties, including broad absorption spectra, narrow emission spectra and good photostability.7,8 In particular, QDs are widely used as chemical sensors for the detection of analytes, such as ions,9–11 small molecules,12–14 and biological macromolecules.15–17 Meanwhile, fluorescence methods based on QDs have appeared as satisfactory techniques due to their low cost, rapid response, high sensitivity, and low detection limits.18,19 However, traditional fluorescent detection is often faced with the complication of the influence of coexisting substances. To our knowledge, a promising way to enhance the selectivity of fluorescent detection is the use of molecularly imprinted polymers (MIPs).20,21

Generally speaking, MIPs are synthesized by the polymerization of functional monomers and a cross-linker in the presence of target molecules (also called template molecules).20 After the removal of template molecules, specific recognition sites that are complementary to the template are formed in the three-dimensional cross-linked polymers.22 To date, MIPs have been widely applied in the fields of extraction and separation,23 catalysis,24 chemical sensing,25 drug delivery and controlled release26 due to their high selectivity, low cost, practicability, and easy preparation. Recently, several efficient sensors based on MIP-based QDs have been developed, which integrated the merits of the high selectivity of MIPs and the fluorescence properties of QDs. For example, Wang’s group has prepared MIP-based ionic liquid-modified CdSe/ZnS QDs for detecting tocopherol (Liu et al., 2012).27 Zhang’s group has prefabricated MIP-based CdTe QDs via a sol–gel process for optosensing of cytochrome c.28 Our group has prepared MIP-based CdTe QDs for the selective recognition of λ-cyhalothrin, and reported a facile and general method for preparing an imprinted polymer thin shell with Mn-doped ZnS QDs at the surface of silica nanoparticles for detecting 2,4-dichlorophenol.29,30 Generally, MIP-based QD composites are prepared by the copolymerization of functional monomers and cross-linkers, and both the QDs and the template molecules are encapsulated in the polymer matrices during the polymerization process.31 However, fluorescence quenching of QDs often occurred during the polymerization process due to the influence of free radicals.32 Meanwhile, the template molecules, which are encapsulated in the polymer matrices via hydrogen bonding or covalent interactions, always need more organic solvent and time during the solvent extraction process.33 Therefore, novel strategies to solve the two problems for the fabrication of MIP-based QD fluorescent sensors are required.

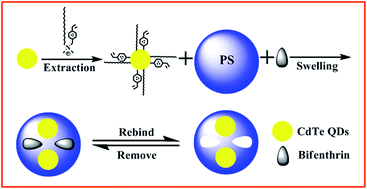
Herein, we report a facile strategy for the preparation of novel MIP-based CdTe QDs via a swelling technique. To fabricate this kind of fluorescent sensor, the QDs were first extracted into organic solvent by octadecyl-4-vinylbenzyl-dimethyl-ammonium chloride (OVDAC, a cationic surfactant). After a swelling process, both the OVDAC/CdTe QDs and template molecules (bifenthrin (BI), a kind of pyrethroid) were encapsulated in a preconceived polymer matrix (of polystyrene microspheres) to form the BI@MIPs (PS)-OVDAC/CdTe QDs. Through a simple solvent extraction process, the MIPs (PS)-OVDAC/CdTe QDs were obtained. The unique fluorescent sensor was characterized by transmission electron microscopy (TEM) and a spectrofluorometer, and then used for selective fluorescence determination of BI based on an electron-transfer-induced fluorescence quenching mechanism. To the best of our knowledge, MIP composites based on OVDAC-modified CdTe QDs synthesized via a swelling technique have not yet been reported.

2 Experimental

2.1 Materials

Octadecyl-4-vinylbenzyl-dimethyl-ammonium chloride (OVDAC) was obtained from TCI (Shanghai) Development Co., Ltd. CdCl2·2.5H2O (99.99%), tellurium powder (∼100 mesh, 99.99%), NaBH4 (99%), thioglycolic acid (TGA) (98%), acrylic acid (AA) and divinylbenzene (DVB) were all purchased from Aladdin reagent Co., Ltd (Shanghai, China). Styrene (St), potassium persulfate (KPS), ethanol, chloroform, and acetonitrile were obtained from Sinopharm Chemical Reagent Co., Ltd (Shanghai, China). Bifenthrin (BI), λ-cyhalothrin (LC), β-cyfluthrin (BC) and fenvalerate (FE) were purchased from Yingtianyi standard sample company (Beijing, China). Double distilled water was used during the whole experiment process.

2.2 Instruments

The morphologies of the prepared samples were observed by a transmission electron microscope (TEM, JEOL, JEM-2100). The fluorescence spectra were measured by a Cary Eclipse spectrofluorometer (USA) equipped with a quartz cell and a plotter unit.

2.3 The synthesis and surface modification of CdTe QDs

Aqueous CdTe QDs solution was synthesized based on the procedure described in previously published literature.34 Briefly, a certain amount of NaBH4, tellurium powder and distilled water were added to a centrifuge tube under ultrasonic conditions to produce a clear NaHTe solution. Then, the fresh NaHTe solution was injected into a N2-saturated TGA–CdCl2 solution at pH 11.2. The Cd2+/TGA/HTe solution, of which the mole ratio was 1[thin space (1/6-em)]:[thin space (1/6-em)]2.4[thin space (1/6-em)]:[thin space (1/6-em)]0.5, was refluxed at 100 °C for 15 h. In a simple process, 5.0 mL of the CdTe QD solution and 10 mg of OVDAC were added to a flask under vigorous stirring. After 2 h, a volume of chloroform was added to extract the OVDAC-coated CdTe QDs. Finally, the OVDAC-modified CdTe QDs (OVDAC-CdTe QDs) were obtained following centrifugation, washing and drying.

2.4 Synthesis of PS microspheres

Cross-linked PS microspheres were synthesized by emulsifier-free emulsion polymerization.35 Briefly, 2.0 mL of St, 0.2 mL of AA, 0.1 mL of DVB, 50 mg of KPS, and 80 mL of water were added to a three-necked flask under magnetic stirring. Then the flask was heated at 70 °C for 10 h with N2 protection. The cross-linked PS microspheres were purified by washing with water and ethanol. After drying in the vacuum oven, the cross-linked PS microspheres were obtained, with diameters of about 150 nm.

2.5 Synthesis of MIPs (PS)-OVDAC/CdTe QDs

The MIPs (PS)-OVDAC/CdTe QDs were synthesized by a swelling technique. Briefly, 20 mg of PS microspheres, 10 mg of BI, and 1.0 mg of OVDAC-CdTe QDs were dispersed into 1.0 mL of chloroform. Then the mixture solution was added into 10 mL of water under ultrasonic treatment and then stirred at 60 °C for 3 h via a swelling process. To remove the imprinted template molecules (BI), the products were washed twice with 5.0 mL of a mixture of the solvents ethanol and acetonitrile (8[thin space (1/6-em)]:[thin space (1/6-em)]2, v/v) for 5 min via high-speed centrifugation (12[thin space (1/6-em)]000 rpm). After drying in a vacuum oven, MIPs (PS)-OVDAC/CdTe QDs were obtained. The non-imprinted QD fluorescent sensors (NIPs (PS)-OVDAC/CdTe QDs) were also prepared using the same method but without addition of BI.

2.6 Fluorescence measurement

The slit width was 10 nm for both the excitation and emission, with the photomultiplier tube voltage at 700 V. The excitation wavelength was set at 320 nm with a recording emission range of 450–700 nm. MIPs (PS)-OVDAC/CdTe QDs and NIPs (PS)-OVDAC/CdTe QDs were dispersed in distilled water to get the respective freshly-made stock solutions (1.0 g L−1). BI and other pyrethroids were dissolved in ethanol to get the analyte stock solutions (1.0 mmol L−1), respectively. In a 5.0 mL colorimetric tube, a given concentration of analyte standard solution was added to a certain volume of the stock solution of MIPs (PS)-OVDAC/CdTe QDs or NIPs (PS)-OVDAC/CdTe QDs, and then, the mixture solution was diluted to volume with distilled water and mixed thoroughly. After a certain time for incubation, the mixture solution was transferred into a quartz cell for the fluorescence measurement.

3 Results and discussion

3.1 Preparation and characterization of MIPs (PS)-OVDAC/CdTe QDs

The general scheme for synthesis of the MIPs (PS)-OVDAC/CdTe QDs is illustrated in Fig. 1. In the first step, CdTe QDs were modified by a polymerizable surfactant OVDAC. After coating with OVDAC, the CdTe QDs could be extracted into organic solvents due to the long hydrocarbon chain in OVDAC. Instead of ligand exchange, electrostatic interaction was the main transformation used to obtain the desired structure. Subsequently, the OVDAC modified CdTe QDs, BI (template), and PS microspheres were dispersed in chloroform and then transferred into oil-in-water microcapsules via sonication. Then BI@MIPs (PS)-OVDAC/CdTe QDs were prepared via a facile and versatile swelling encapsulation strategy. After the templates were removed from the PS microspheres via a simple solvent extraction process, the MIPs (PS)-OVDAC/CdTe QDs were obtained and the recognition sites could selectively rebind the template molecules due to the wonderful compatibility of size, shape and chemical interactions. The UV-vis absorption spectra of the QDs and BI are shown in Fig. S1a, and, as shown in Fig. S1b, the fluorescence spectra of the QDs were also investigated in the absence and presence of BI. It was found that BI could quench the fluorescence of the QDs. As shown in Fig. 2a, the FL intensity of BI@MIPs (PS)-OVDAC/CdTe QDs was about 45% of that of NIPs (PS)-OVDAC/CdTe QDs; after the removal of BI, the FL intensity of MIPs (PS)-OVDAC/CdTe QDs was restored dramatically and increased to 96% of that of NIPs (PS)-OVDAC/CdTe QDs, indicating that BI was removed cleanly from the PS microspheres.
image file: c5ra15424c-f1.tif
Fig. 1 Schematic illustration of the preparation of MIPs (PS)-OVDAC/CdTe QDs.

image file: c5ra15424c-f2.tif
Fig. 2 (a) FL spectra of BI@MIPs (PS)-OVDAC/CdTe QDs (1), NIPs (PS)-OVDAC/CdTe QDs (2), MIPs (PS)-OVDAC/CdTe QDs (3); (b) TEM images of PS microspheres (scale bar: 200 nm); (c) TEM images of MIPs (PS)-OVDAC/CdTe QDs (scale bar: 200 nm); (d) TEM image of a single MIPs (PS)-OVDAC/CdTe QD (scale bar: 20 nm).

In the whole preparation process, no monomers or initiators were used and there were no free radicals, thereby avoiding the fluorescence quenching of QDs. Meanwhile, due to the lack of use of the functional monomers, template molecules in the polymer matrices were not bound by hydrogen bonding or covalent interactions. As we know, the BI (template) has two benzene rings in its chemical structure (Fig. S2). On the other hand, there are many benzene rings in the chains of the PS microspheres (as shown in Fig. S3a). Based on the two points discussed above, this structure similarity brings about van der Waals interactions between BI and PS. In addition, the long hydrocarbon chain on the OVDAC/CdTe QDs surface (as shown in Fig. S3b) gives rise to the hydrophobic force interaction between the QDs, BI, and PS. Therefore, these two noncovalent interactions (van der Waals and hydrophobic force) made the template molecules fix in the polymer matrices. Moreover, the template molecules could be easily removed from the binding sites by washing with ethanol and acetonitrile via centrifugation due to the small particle sizes and noncovalent interactions.

The morphology of the PS microspheres and MIPs (PS)-OVDAC/CdTe QDs were investigated by TEM. As shown in Fig. 2b, the bare PS microspheres are well-dispersed and spherical, with a size of about 150 nm in diameter. As shown in Fig. 2c and d, small particles about 3 nm can be clearly seen in the PS matrix, indicating that the CdTe QDs were incorporated into PS microspheres after swelling. It could be found that the shape of the MIPs (PS)-OVDAC/CdTe QDs was the same as the PS microspheres and the size did not change greatly. In addition, the size and shape of the NIPs (PS)-OVDAC/CdTe QDs were the same as those of the MIPs (PS)-OVDAC/CdTe QDs.

3.2 Effect of the concentration of MIPs (PS)-OVDAC/CdTe QDs

As we know, the concentration of the fluorescent sensor has a great influence on fluorescent detection systems. Too much fluorescent sensor would result in a lower sensitivity, whereas too little of the fluorescent sensor would bring about a narrow linear range. Both the sensitivity and the linear range are important for the fluorescent determination system. In this section, the concentration of MIPs (PS)-OVDAC/CdTe QDs from 4.0 mg L−1 to 28 mg L−1 and a certain concentration (10 μmol L−1) of BI were chosen to study the effects of this on the fluorescent determination system. As shown in Fig. 3a, when the concentration of MIPs (PS)-OVDAC/CdTe QDs was lower, the sensitivity was high but the linear range was narrow; when the concentration of MIPs (PS)-OVDAC/CdTe QDs was higher, the linear range was better but the sensitivity was low. Therefore, in consideration of these two key points, 16 mg L−1 was determined as the optimum value and used in the further work.
image file: c5ra15424c-f3.tif
Fig. 3 (a) Effects of the addition of MIPs (PS)-OVDAC/CdTe QDs on FL intensity. Curve 1: the function of variation rate of the FL intensity of the detection system vs. the concentration of MIPs (PS)-OVDAC/CdTe QDs; curve 2: the function of relative FL intensity vs. the concentration of MIPs (PS)-OVDAC/CdTe QDs. (b) FL intensity change of MIPs (PS)-OVDAC/CdTe QDs within 120 min. (c) FL response time of MIPs (PS)-OVDAC/CdTe QDs for BI. (Experiment condition: MIPs (PS)-OVDAC/CdTe QDs, 16 mg L−1; BI, 10 μmol L−1).

3.3 Stability and detection time

Under optimum conditions, the optical stability was estimated by the repeated detection of the FL intensity of MIPs (PS)-OVDAC/CdTe QDs every 10 min. As shown in Fig. 3b, the change of the FL intensity of MIPs (PS)-OVDAC/CdTe QDs was not obvious and the FL intensity was considerably stable for the 13 measurements within 2 h. Based on the good fluorescence stability, the response time of the detection system was also studied. As shown in Fig. 3c, the FL intensity of MIPs (PS)-OVDAC/CdTe QDs with BI was recorded at different times. It could be found that the FL intensity decreased rapidly in the initial 20 min, and then remained stable. Therefore, the MIPs (PS)-OVDAC/CdTe QD sensor had a rapid response speed for BI, and 25 min was chosen as the optimal detection time for further experiments.

3.4 Effect of pH

The effect of pH on both the FL intensity of MIPs (PS)-OVDAC/CdTe QDs and the detection was also studied as shown in Fig. 4. It could be found from Fig. 4a that the fluorescence of MIPs (PS)-OVDAC/CdTe QDs was quenched obviously under acidic conditions. On the contrary, the fluorescence of MIPs (PS)-OVDAC/CdTe QDs was slightly enhanced in the pH range of 7–12. As shown in Fig. 4b, the (F0F)/F0 reached a maximum when the pH was at 7.0. Therefore, a pH of 7.0 was selected for the further experiments.
image file: c5ra15424c-f4.tif
Fig. 4 Effects of pH variation on the FL intensity of MIPs (PS)-OVDAC/CdTe QDs (a), and the variation rate of the FL intensity response toward BI (b). (Experiment condition: MIPs (PS)-OVDAC/CdTe QDs, 16 mg L−1; BI, 10 μmol L−1).

3.5 MIPs (PS)-OVDAC/CdTe QDs with template BI of different concentrations

Under the optimal conditions, the ability of the developed MIPs (PS)-OVDAC/CdTe QDs for quantitative detection of BI was further studied. The experiment was carried out after incubation of the MIPs (PS)-OVDAC/CdTe QDs with different concentrations of the target BI for 25 min at room temperature. As a contrast, NIPs (PS)-OVDAC/CdTe QDs were also studied under the same conditions. The fluorescent detection system is based on the fluorescence quenching between QDs and the target BI. The specific binding effect between the imprinted cavity and the BI molecule generates a strong adsorption of BI, and the two noncovalent interactions (van der Waals and hydrophobic force) bring BI molecules to a close proximity and result in the FL quenching phenomenon which can be described as a charge transfer from the QDs to the BI. Under ultraviolet radiation, the electrons of the QD are in an excited state, and then the charge transfer between the QD and BI happens and causes the FL quenching behavior. Fig. 5a and b show the fluorescence spectral responses of the MIPs (PS)-OVDAC/CdTe QDs and NIPs (PS)-OVDAC/CdTe QDs with template BI at different concentrations, respectively. The fluorescence quenching in this detection system followed the Stern–Volmer equation.
 
F0/F = 1 + KSV[c] (1)
F and F0 are the FL intensities of the QDs sensor in the presence and absence of the template BI, respectively. [c] is the concentration of BI, and KSV is the quenching constant. Moreover, the ratio of KSV,MIP and KSV,NIP was defined as the imprinting factor (IF) to evaluate the selectivity of the fluorescent composite materials. As shown in Fig. 5c, the KSV,MIP was 27[thin space (1/6-em)]730 M−1, and the linear calibration curve has been constructed in the range of 0.5–40 μmol L−1 with a correlation coefficient of 0.9918. In addition, the detection limit (3σ/k) was about 0.08 μmol L−1, in which σ is the standard deviation of blank measurements (n = 11) and k is the slope of the calibration line. As shown in Fig. 5d, the KSV,NIP was about 6740 M−1, and the linear range of the calibration curve was also 0.5–40 μmol L−1 but with a correlation coefficient of 0.9959. After being calculated, it could be found that the IF (KSV,MIP/KSV,NIP) was about 4.11, indicating that the MIPs (PS)-OVDAC/CdTe QDs had higher selectivity than NIPs (PS)-OVDAC/CdTe QDs.

image file: c5ra15424c-f5.tif
Fig. 5 FL emission spectra of MIPs (PS)-OVDAC/CdTe QDs (a), and NIPs (PS)-OVDAC/CdTe QDs (b) (16 mg L−1) with addition of the indicated concentrations of BI in water solution; the Stern–Volmer plots for MIPs (PS)-OVDAC/CdTe QDs (c), and NIPs (PS)-OVDAC/CdTe QDs (d); and the quenching efficiency of MIPs (PS)-OVDAC/CdTe QDs and NIPs (PS)-OVDAC/CdTe QDs by different kinds of pyrethroids at the same concentrations (e).

3.6 Selectivity study

In order to study the selectivity of the proposed method, the interference of the ions was firstly studied. As shown in Table S1, both the metal ions and anions have no effect on the FL intensity of the MIPs- and NIPs (PS)-OVDAC/CdTe QDs. When BI was removed via a simple process with a mixed solvent, imprinted binding sites were left in the PS microspheres that selectively bound the template BI molecules. Several kinds of pyrethroids, BI, BC, FE and LC, were used to evaluate the selectivity of the MIPs (PS)-OVDAC/CdTe QDs. As seen from Fig. 5e, MIPs (PS)-OVDAC/CdTe QDs had a strong response to BI and this fluorescence quenching amount was the highest. By calculation, the differences in the quench efficiencies ((F0F)/F0) of MIPs (PS)-OVDAC/CdTe QDs and NIPs (PS)-OVDAC/CdTe QDs were 0.31, 0.044, 0.041 and 0.038 at 40 μmol L−1 for BI, BC, LC and FE, respectively. It could be found from the above results that MIPs (PS)-OVDAC/CdTe QDs were specific to BI but nonspecific to other pyrethroids. In addition, no selective recognition sites were found to exist in the NIPs (PS)-OVDAC/CdTe QDs, which meant the quenching amount of the non-imprinted sensor was much less than that of the imprinted sensor. The result of the selectivity study can be explained as follows: in the preparation process, a lot of specific binding sites complementary to the template BI in size, shape, and functionality were generated. After that, BI could be strongly rebound to the MIPs (PS)-OVDAC/CdTe QDs and cause obvious fluorescence quenching.

3.7 Analytical applications in honey samples

To evaluate the applicability of the proposed method, MIPs (PS)-OVDAC/CdTe QDs were used for the detection of BI in three different honey samples which were purchased from local supermarkets. The honey sample (10 g) was dissolved in 100 mL distilled water, and then filtered through 0.45 μm Supor filters. After that, the honey sample solution was stored at 4 °C. The preparation process of the detection was the same as before but using the honey sample solution instead of distilled water. A recovery experiment was carried out and the results are shown in Table 1. It could be found that the values obtained by the MIPs (PS)-OVDAC/CdTe QDs sensor followed the same trend as those found by HPLC. Therefore, MIPs (PS)-OVDAC/CdTe QDs could be used as an effective tool for direct and rapid fluorescence detection of BI in honey samples.
Table 1 Spiked recovery results for the detection of BI in different honey samples (n = 3)
Honey sample Added (μmol L−1) FL sensor (this work) HPLC
Recovery (%) RSD (%) Recovery (%) RSD (%)
1 10 93.7 3.71 94.6 2.32
20 97.5 4.23 97.7 1.89
40 102 2.56 98.7 2.24
2 10 95.3 4.33 95.7 3.13
20 105 3.84 97.3 1.46
40 96.4 3.35 103 1.89
3 10 105 2.89 95.1 2.87
20 97.3 3.35 96.9 1.65
40 103 1.93 102 2.26


There has been a lot of good work about the detection of BI reported in recent years. Some of it is summarized and compared with this work in Table S2. It could be found that the detection limit, linear range and recovery of the proposed method were comparable to other detection methods. Compared with chromatography methods, the fluorescence analysis method has many advantages, including time-saving, simplicity, convenience, simple sample pretreatment, and minor solvent consumption. Meanwhile, after coupling with molecular imprinting technology, the selectivity of the fluorescence analysis method was significantly improved.

On the other hand, as shown in Table 2, we also compared MIP-based QDs reported in the literature and the MIPs (PS)-OVDAC/CdTe QDs in this work. Compared with other fluorescent molecularly imprinted polymers, there were three significant differences: firstly, swelling technology was used to prepare the developed sensor; secondly, the interaction was not hydrogen bonding and covalent interactions, but van der Waals and hydrophobic forces; thirdly, aqueous QDs were successfully applied to the swelling process using a polymerizable surfactant. In summary, as a new sensor, the developed MIPs (PS)-OVDAC/CdTe QDs fluorescent sensor represents progress for fluorescence detection applications.

Table 2 Comparison between the present method and literature
Synthetic methods Target object Interactions Linear range LOD Reference
Sol–gel reaction Lysozyme Hydrogen bond interaction 0.014–8.5 μM 6.8 nM 36
Seed-growth method (sol–gel method and reverse microemulsion method) 2,4,6-Trinitrotoluene Hydrogen bond interaction 0.8–30 μM 0.28 μM 37
Sol–gel method Clenbuterol and melamine Hydrogen bond interaction 2.5–22.5 μM; 2.0–35 μM 0.4 μM; 0.6 μM 38
Sol–gel method Bovine hemoglobin Hydrogen bond interaction 0.02–2.1 μM 9.4 nM 39
Sol–gel method Ractopamine Hydrogen bond interaction 0.5–355 nM 0.147 nM 40
Sol–gel method Cytochrome c Hydrogen bond interaction 0.97–24 μM 0.41 μM 28
Reverse microemulsion method λ-Cyhalothrin Hydrogen bond interaction 5.0–60 μM 29
Swelling method Bifenthrin van der Waals and hydrophobic force 0.5–40 μM 0.08 μM This work


4 Conclusions

In summary, we developed a novel swelling strategy to fabricate fluorescent imprinted sensors based on CdTe QDs and PS microspheres (MIPs (PS)-OVDAC/CdTe QDs) for highly selective fluorescence detection of BI. OVDAC was used as a surfactant to extract the CdTe QDs into the organic solvents and modify the QDs with long hydrocarbon chains. Due to the satisfactory fluorescence property of QDs and the noncovalent interactions (van der Waals forces and hydrophobic forces) between the PS microspheres and BI, MIPs (PS)-OVDAC/CdTe QDs demonstrated a highly selective recognition and determination of BI. Under optimum conditions, this sensor was successfully applied for the detection of BI in honey samples. It is suggested that a new generation of aqueous QDs-PS fluorescent imprinted sensors can be developed by using such a swelling method for the highly selective detection of pollutants. In addition, the unique interactions between the template and MIPs will provide a possibility for the detection of environmental pollutants which have no active functional groups to form covalent bonds or hydrogen bonds with the functional monomers.

Acknowledgements

This work was financially supported by the National Natural Science Foundation of China (No. 21277063, No. 21407057 and No. 21407064), National Basic Research Program of China (973 Program, 2012CB821500), Natural Science Foundation of Jiangsu Province (No. BK20140535), PhD Innovation Programs Foundation of Jiangsu Province (No. KYLX_1032), National Postdoctoral Science Foundation (No. 2014M561595), and Postdoctoral Science Foundation funded Project of Jiangsu Province (No. 1401108C).

References

  1. H. B. Li, Y. L. Li and J. Cheng, Chem. Mater., 2010, 22, 2451–2457 CrossRef CAS.
  2. J. M. van-Emon and J. C. Chuang, Anal. Chim. Acta, 2012, 745, 38–44 CrossRef CAS PubMed.
  3. M. L. Feo, C. Corcellas, C. Barata, A. Ginebreda, E. Elijarrat and D. Barceló, Sci. Total Environ., 2013, 442, 497–502 CrossRef CAS PubMed.
  4. J. Zhang, H. Gao, B. Peng, S. Li and Z. Zhou, J. Chromatogr. A, 2011, 1218, 6621–6629 CrossRef CAS PubMed.
  5. M. Mezcua, O. Malato, J. F. García-Reyes, A. Molina-Díaz and A. R. Fernández-Alba, Anal. Chem., 2009, 81, 913–929 CrossRef CAS PubMed.
  6. R. E. Hunter, J. R. A. M. Riederer and P. B. Ryan, J. Agric. Food Chem., 2010, 58, 1396–1402 CrossRef CAS PubMed.
  7. C. Yuan, K. Zhang, Z. Zhang and S. Wang, Anal. Chem., 2012, 84, 9792–9801 CrossRef CAS PubMed.
  8. A. Valizadeh, H. Mikaeili, M. Samiei, S. M. Farkhani, N. Zarghami, M. Kouhi, A. Akbarzadeh and S. Davaran, Nanoscale Res. Lett., 2012, 7, 480 CrossRef PubMed.
  9. Z. S. Qian, X. Y. Shan, L. J. Chai, J. R. Chen and H. Feng, Biosens. Bioelectron., 2015, 68, 225–231 CrossRef CAS PubMed.
  10. Y. Gong and Z. F. Fan, Biosens. Bioelectron., 2015, 66, 533–538 CrossRef CAS PubMed.
  11. I. Costas-Mora, V. Romero, I. Lavilla and C. Bendicho, Anal. Chem., 2014, 86, 4536–4543 CrossRef CAS PubMed.
  12. L. P. Lin, M. C. Rong, S. S. Lu, X. H. Song, Y. X. Zhong, J. W. Yan, Y. R. Wang and X. Chen, Nanoscale, 2015, 7, 1872–1878 RSC.
  13. X. Wei, Z. P. Zhou, T. F. Hao, H. J. Li, J. D. Dai, L. Gao, X. D. Zheng, J. X. Wang and Y. S. Yan, J. Lumin., 2015, 161, 47–53 CrossRef CAS PubMed.
  14. Y. X. Li, H. Huang, Y. H. Ma and J. Tong, Sens. Actuators, B, 2014, 205, 227–233 CrossRef CAS PubMed.
  15. X. H. Xu, X. Liu, Z. Nie, Y. L. Pan, M. L. Guo and S. Z. Yao, Anal. Chem., 2011, 83, 52–59 CrossRef CAS PubMed.
  16. Z. S. Qian, L. J. Chai, Y. Y. Huang, C. Tang, J. J. Shen, J. R. Chen and H. Feng, Biosens. Bioelectron., 2015, 68, 675–680 CrossRef CAS PubMed.
  17. Z. F. Zhang, Y. M. Miao, Q. D. Zhang, L. W. Lian and G. Q. Yan, Biosens. Bioelectron., 2015, 68, 556–562 CrossRef CAS PubMed.
  18. H. Kim, W. Ren, J. Kim and J. Yoon, Chem. Soc. Rev., 2012, 41, 3210–3244 RSC.
  19. L. Yuan, W. Lin, K. Zheng, L. He and W. Huang, Chem. Soc. Rev., 2013, 42, 622–661 RSC.
  20. L. X. Chen, S. F. Xu and J. H. Li, Chem. Soc. Rev., 2011, 40, 2922–2942 RSC.
  21. X. Wei, Z. P. Zhou, T. F. Hao, H. J. Li and Y. S. Yan, RSC Adv., 2015, 5, 19799–19806 RSC.
  22. M. J. Whitcombe, I. Chianella, L. Larcombe, S. A. Piletsky, J. Noble, R. Porter and A. Horgan, Chem. Soc. Rev., 2011, 40, 1547–1571 RSC.
  23. S. F. Xu, L. X. Chen, J. H. Li, W. Qin and J. Ma, J. Mater. Chem., 2011, 21, 12047–12053 RSC.
  24. J. Orozco, A. Cortés, G. Z. Cheng, S. Sattayasamitsathit, W. Gao, X. M. Feng, Y. F. Shen and J. Wang, J. Am. Chem. Soc., 2013, 135, 5336–5339 CrossRef CAS PubMed.
  25. R. N. Liang, D. A. Song, R. M. Zhang and W. Qin, Angew. Chem., Int. Ed., 2010, 49, 2556–2559 CrossRef CAS PubMed.
  26. J. F. Yin, Y. Cui, G. L. Yang and H. L. Wang, Chem. Commun., 2010, 46, 7688–7690 RSC.
  27. H. L. Liu, G. Z. Fang, C. M. Li, M. F. Pan, C. C. Liu, C. Fan and S. Wang, J. Mater. Chem., 2012, 22, 19882–19887 RSC.
  28. W. Zhang, X. W. He, Y. Chen, W. Y. Li and Y. K. Zhang, Biosens. Bioelectron., 2011, 26, 2553–2558 CrossRef CAS PubMed.
  29. X. Wei, M. J. Meng, Z. L. Song, L. Gao, H. J. Li, J. D. Dai, Z. P. Zhou, C. X. Li, J. M. Pan, P. Yu and Y. S. Yan, J. Lumin., 2014, 153, 326–332 CrossRef CAS PubMed.
  30. X. Wei, Z. P. Zhou, T. F. Hao, H. J. Li, Y. Q. Xu, K. Lu, Y. L. Wu, J. D. Dai, J. M. Pan and Y. S. Yan, Anal. Chim. Acta, 2015, 870, 83–91 CrossRef CAS PubMed.
  31. M. R. Chao, C. W. Hu and J. L. Chen, Biosens. Bioelectron., 2014, 61, 471–477 CrossRef CAS PubMed.
  32. H. Zhang, C. L. Wang, M. J. Li, X. L. Ji, J. H. Zhang and B. Yang, Chem. Mater., 2005, 17, 4783–4788 CrossRef CAS.
  33. Y. Y. Zhao, Y. X. Ma, H. Li and L. Y. Wang, Anal. Chem., 2012, 84, 386–395 CrossRef CAS PubMed.
  34. X. Wei, Z. P. Zhou, T. F. Hao, Y. Q. Xu, H. J. Li, K. Lu, J. D. Dai, X. D. Zheng, L. Gao, J. X. Wang, Y. S. Yan and Y. Z. Zhu, Microchim. Acta, 2015, 182, 1527–1534 CrossRef CAS.
  35. M. Y. Han, X. H. Gao, J. Z. Su and S. M. Nie, Nat. Biotechnol., 2001, 19, 631–635 CrossRef CAS PubMed.
  36. W. Zhang, X. W. He, Y. Chen, W. Y. Li and Y. K. Zhang, Biosens. Bioelectron., 2012, 31, 84–89 CrossRef CAS PubMed.
  37. S. F. Xu, H. Z. Lu, J. H. Li, X. L. Song, A. X. Wang, L. X. Chen and S. B. Han, ACS Appl. Mater. Interfaces, 2013, 5, 8146–8154 CAS.
  38. B. T. Huy, M. H. Seo, X. F. Zhang and Y. I. Lee, Biosens. Bioelectron., 2014, 57, 310–316 CrossRef CAS PubMed.
  39. D. Y. Li, X. W. He, Y. Chen, W. Y. Li and Y. K. Zhang, ACS Appl. Mater. Interfaces, 2013, 5, 12609–12616 CAS.
  40. H. L. Liu, D. R. Liu, G. Z. Fang, F. F. Liu, C. C. Liu, Y. K. Yang and S. Wang, Anal. Chim. Acta, 2013, 762, 76–82 CrossRef CAS PubMed.

Footnote

Electronic supplementary information (ESI) available. See DOI: 10.1039/c5ra15424c

This journal is © The Royal Society of Chemistry 2015
Click here to see how this site uses Cookies. View our privacy policy here.