Theoretical studies of heteroatom-doping in TiO2 to enhance the electron injection in dye-sensitized solar cells

Li Hao, Fu-Quan Bai*, Chui-Peng Kong, Shamsa Bibi and Hong-Xing Zhang*
International Joint Research Laboratory of Nano-Micro Architecture Chemistry, Institute of Theoretical Chemistry, Jilin University, 130023 Changchun, China. E-mail: baifq@jlu.edu.cn; zhanghx@mail.jlu.edu.cn

Received 31st July 2015 , Accepted 14th September 2015

First published on 15th September 2015


Abstract

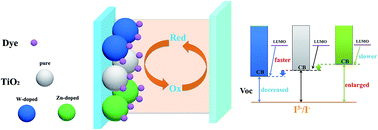
Density functional calculations have been explored to analyze the structural, electronic and charge transfer properties of a doped TiO2 substrate and catechol–TiO2 interfaces for dye-sensitized solar cells. The results demonstrate that the dopant W6+ moves the CB (conduction band) edge downward and introduces 5d-unoccupied orbitals located in the CB bottom of the TiO2. On the other hand, the dopant Zn2+ shifts the CB edge upward with an insertion of 3d-occupied orbitals into the VB (valence band). In catechol–TiO2 systems, W6+ enlarges the energy difference between the LUMO of catechol and LUMO of TiO2, which enlarges the driving force for electron injection in turn and results in an increased short circuit current (Jsc). Our modeling injection dynamics and quantitative Bader analysis of the interfacial charge transfer have revealed that the catechol–TiO2 doped with W6+ provides faster and more electron injection for dye sensitized solar cells (DSSCs). While the Zn2+ doped system exhibits lower electron efficiency due to the minimized energy difference between the catechol LUMO and TiO2 CB.

1 Introduction

Titanium dioxide (TiO2) as a functional material has attracted considerable attention in recent decades because of its comprehensive combination of optical and electrical properties and important applications in photovoltaics1–4 and photocatalysis.5–8 In fact, the photovoltaic and photocatalysis performance of TiO2 depends on electronic structure, interfacial properties and charge transport efficiency which are mostly determined by the crystal structure.9 Introducing doping metal and non-metal atoms in TiO2 have been proven as an efficient technology to achieve a higher photoelectric conversion10–13 and photocatalytic efficiency.14–17 In particular, doped TiO2 materials have been recognized as promising candidates due to their size-tunable band gap and easy syntheses for photovoltaics and photocatalysis.

In the last two decades, one of the greatest achievements for clean energy applications is the dye-sensitized solar cells (DSSCs).18 DSSCs have been considering as an attractive candidate due to their low cost and high efficiency. In DSSC devices, TiO2 photoanode acts as the electron acceptor in the electron injection process, and also provides direct or tortuous path for electron transport in the electrical circuits.19 Intensive researches indicate that the driving force for electron injection is generated from the energy difference between the excited states of the dye and the CB (conduction band) edge of TiO2.20,21 For single organic molecule, the steady LUMO (Lowest Unoccupied Molecular Orbital) can approximately express the excited states of the dye.22–24 So tuning of CB edge downward with dopants can enlarge the driving force and results more efficient electron injection,25–27 which is the key factor for the short-circuit photocurrent density (Jsc) and incident photon-to-electron conversion efficiency (IPCE).28 Dopants also play an important role in affecting the properties of electrical conductivity and surface adsorption of TiO2.29–32 Therefore, introduction of dopants in TiO2 effects the electron injection, the electron transport in the TiO2 electrode and interface recombination between the injected electron and the oxidized redox mediator, I3 ions.33

In order to achieve high-efficiency DSSCs, various types of dopants have been used for the optimization of TiO2. Many studies have shown that doping nonmetal anions at O sites (e.g. B,34,35 C,36 N,37,38 S,39 and I40) induced additional electronic states above the valence band (VB) upper edge and scarcely had effect on CB near the bottom edge.41–43 On the other hand, doping transition metal ions at Ti sites (such as Fe2+,44 Ce4+,45 Zr4+,46 V4+ or V5+,47 Nb5+,48 Ta5+ (ref. 49) and W6+ (ref. 22)) is also be an effective method to modify the electronic properties of TiO2. In a TiO2 system, donor and acceptor-type dopants play different roles in terms of geometry and electronic structure, which affect the device performance in turn. Both of donor and acceptor-type transition metal ions dopants are thought to be very important for DSSC and have been extensively studied. Tungsten doping, as a donor-type dopant, was first reported by Ko et al.;10 then Wang and coworkers22 found that the CB edge of TiO2 shifts downward gradually with increasing the tungsten (W6+) content. Additionally, as an acceptor-type dopant, Zn-doped50 TiO2 enhanced the charge transfer under low-intensity illumination. According to previous studies, there are numbers of researches have reported that the electron injection process can be influenced by different dopants. The detailed mechanism of these influences remains to be elucidated.

In this work, an acceptor (Zn) and a donor dopant (W) in TiO2 are studied to obtain insight into the mechanism by diverse dopants which affect the electron injection. We have performed a systematic analysis to investigate their effects on geometry and electronic structure, such as CB levels, CB component, density of states, and charge transfer. We have plotted the quantitative Bader analysis and injection dynamics to explore the charge transfer between catechol and the TiO2 surface. The acceptor (Zn) and donor (W) dopant play different roles to control the electron injection process in DSSCs and the corresponding results should provide valuable guidelines for experimental works.

2 Computational details and modeling

It is well known that anatase nanoparticles appear higher photovoltaic and photocatalytic activities compared with other titania polymorphs.51–53 TiO2 (101) surface dominates more than 94% of the external surface in anatase crystal54 and anatase (101) is the most well-known model describing the TiO2 substrate in DSSC.55–57 To assess the effects of heteroatom-doped TiO2 electrodes on DSSC device performance, a large anatase (101) surface was constructed with a 15 Å vacuum layer as shown in Fig. 1 (10.21 Å × 11.33 Å, (TiO2)24, 72 atoms). Plane wave DFT calculations on the slab are performed in the Vienna Ab initio Simulation Package (VASP) code,58–60 using the projector-augmented plane-wave (PAW) pseudopotentials61,62 and generalized gradient approximation (GGA) of PBE.63,64 The cutoff energy is set to 600 eV. Geometries are optimized till the energy and force converged within fair limits (1 × 10⁻⁴ eV and 1 × 10⁻³ eV Å−1 respectively). Density of states (DOS) and the calculated scanning tunneling microscopes (STM) are obtained based on the optimized geometry. The brillouin zone of the surface is sampled using an 8 × 8 × 1 Monkhorst–Pack special k-point mesh to obtain and understand qualitative features on the geometrical and electronic structures of TiO2 electrode.
image file: c5ra15282h-f1.tif
Fig. 1 Supercell slab model of TiO2 (101) surface. (A) Top view (B) side view (purple marked substituted Ti position).

Furthermore, a two-dimensional slab model of sensitized anatase (101) surface is built to describe the charge transfer between dye and the heteroatom-doped TiO2 electrodes (the slab has dimensions of 10.21 Å × 11.33 Å with a 20 Å vacuum layer). The same pseudopotential and function are utilized to calculate the electronic properties of dye/TiO2 composite.

3 Results and discussion

3.1 Geometry and electronic properties of anatase (101)

As shown in Fig. 1, heteroatom-doping of TiO2 substrate has been implemented by substituting the surface 5-fold coordinated Ti (the purple position) with a W6+ or Zn2+ ion. The dopants in semiconductor oxides bring about serial changes in the geometrical and electronic structure. Based on the geometrical analysis, neither of W6+ and Zn2+ remains in the doped Ti site (Ti4+) due to non-equilibrium charging. At the electron configuration of 3d,10 Zn2+ changes the interatomic spacing and displays stretched distances with surrounding oxygen atoms. In addition, we have noticed that the Zn atoms try to move away from the surface position. In contrast, W6+ makes coordinate covalent bonds shorter than the corresponding Ti–O bonds because of the greater capacity to attract the electrons. As compared to doped Ti position of the pure TiO2 electrode, W6+ and Zn2+ both move slightly along the [101] vector (z axis direction). The results demonstrate that z-coordinates are in the order of Zn2+ (7.15 Å) > Ti4+ (6.94 Å) > W6+ (6.88 Å) in the same coordinate system as shown in Fig. 2.
image file: c5ra15282h-f2.tif
Fig. 2 Structures of the pure and heteroatom-doped TiO2 electrodes.

We have also investigated the effect of W6+ and Zn2+ doping on the electronic properties. The scanning tunneling microscopes (STM) images are generated based on the calculated charge density with a maximum z of 2.0 Å above the highest atom.65 Contours added to STM images express the main features and different electronic structures of three TiO2 super cells. For the STM images, F = −1.40 V is used. The calculated STM images of filled states are illustrated in Fig. 3 and some interesting features are also appeared in this image. The STM image of pure TiO2 for a 1.4 V below the Fermi level provides a simple picture; light and shade are staggered periodically. In the panel (d) of Fig. 3, it is obviously shown that the egg-like shapes of the top layer are brighter than the second layer positions. There are distinct differences between the doped semiconductor with W6+ and the pure TiO2. The atom W located at second layer of the slab causes some interesting features in the STM image. A careful look at the panel (e) reveals that darker and slightly smaller patterns of oxygen atoms surrounded the W6+ substituted site. However, the image still shows nicely pure TiO2 features for the O atoms far from the W6+ site over three bonds. Taking a careful look on contour plots, it is can be seen that W6+ dopant reduced the charge density of the adjacent oxygen atoms. The STM image of Zn2+ doped TiO2 shows the eye-catching bright ball of a top-layer O atom and dark gray oval shapes. The constant density surface, showed by the notch circle in the panel (f), presents reduced charge density except the top O atom adjacent to Zn atom.


image file: c5ra15282h-f3.tif
Fig. 3 Atomic structures and calculated STM images of TiO2 (101) surfaces. Panels (a)–(c) represent the top views; (d)–(f) represent the STM images. Colored rounds label the atomic position: blue and fuchsia regions represent Ti and O atom positions in the two top layers of the surface, while cyan and green disks indicate the W and Zn atoms positions.

Furthermore, the DOS have been provided in Fig. 4 for an indepth understanding of the interaction between W6+/Zn2+ dopants and electronic properties. The DOS presents separated CB and VB, which are mainly composed of titanium 3d and oxygen 2p orbitals. Compared to the DOS of pure TiO2, W6+ doping in TiO2 moves the CB edge downward, which in turns enlarges the electron injection driving force and increases the Jsc. Whereas, Zn2+ shifts the CB and VB edge upward. The filled lines presented the d orbitals PDOS of W, Zn and corresponding site Ti atoms. It is worth noting that W6+ introduces some 5d-unoccupied orbitals located in the bottom of the TiO2 CB, while dopant Zn2+, with the configuration of 3d,10 inserts 3d-occupied orbitals into the VB and the bottom edge of CB remains unchanged. In the ultrafast electron injection, excited electrons are injected into the TiO2 CB; therefore, the CB component affects the electron injection distribution directly. Additionally, W6+ shifts the Fermi level negatively, which induces a better charge separation and would result in an enhancement of injection process.


image file: c5ra15282h-f4.tif
Fig. 4 Calculated DOS (density of states) of TiO2 (101) substrates. In the right panels, DOS have been zoomed in on (the black line represents the total DOS; red and magenta lines represent the PDOS of titanium 3d and oxygen 2p orbitals; the filled cyan, green and blue lines represent the PDOS of W, Zn and corresponding site Ti d orbitals respectively in three slab models).

3.2 The effect of W6+/Zn2+ dopants on the catechol–TiO2 systems

3.2.1 The effect of W6+/Zn2+ dopants on electronic structures of catechol–TiO2 systems. Most researches have focused on the exploration of electron injection mechanisms by employing simple dye.19,66–69 Catechol (C6H6O2) has been classified as representative examples of type-II dye, which follows a direct electron injection mechanism.19 As catechol–TiO2 interface can provide a clear and intuitive display of electron injection distribution, therefore, electronic structures of diverse catechol–TiO2 were plotted out to analyze the effect of dopant W6+/Zn2+ on the electron injection process.

The density of states are plotted to explore the interactions between catechol and the TiO2. Compared to the bare TiO2, the PDOS of TiO2 adsorbed by catechol indicates a significant upward shift of the CB and VB edges. In Fig. 5, it can be clearly seen that there are strong overlap of the catechol with TiO2. After adsorption, catechol introduces unoccupied molecular bands in the higher energy of conduction band. Zn2+ doped catechol–TiO2 system shows a significantly overlap near the bottom edge of the conduction band, regarding PDOS of catechol. This minimizes the energy difference between the catechol LUMO and TiO2 CB, which will induce a slower electron injection process compared with pure catechol–TiO2 system. Wang and coworkers22 have reported the open-circuit photovoltage (Voc) remained almost unchanged with less 0.5% W-doping due to the collective effect of the downward shift of the CB and the enhanced electron lifetime. As in Fig. 5, W6+ shifts the PDOS of catechol away from the CB edge, which enlarges the energy difference between the catechol LUMO and TiO2 CB. That would increase the driving force of electron injection and the Jsc in the DSSCs. The highest power conversion efficiency (η) was obtained in the experiments, with increasing by 17% in Jsc and by 20% in η.22


image file: c5ra15282h-f5.tif
Fig. 5 Calculated DOS of catechol–TiO2 systems (the black line represents the total DOS; the filled cyan, red and green lines represent the PDOS of catechol in W6+ doped, pure and Zn2+ doped slab models respectively).

The orbital distributions of valence band maximum (VBM) and conduction band minimum (CBM) at the Gamma point are illustrated in Fig. 6. The VBM maps are mostly localized on the catechol, which display diffusion to the adsorption sites at the catechol–TiO2 interfaces. While the CBM are localized in the TiO2 moiety, showing Ti-3d and W-5d orbitals characteristics; electron injection process will benefit. Moreover, the orbital distributions differ significantly in CBM as in panel (d), the CBM distribution for pure catechol–TiO2 mainly resides on the Ti 3d orbitals. With W6+ doping, as in panel (e), the distribution of CBM concentrates in the region near the W6+ doping site of TiO2. In panel (f), Zn does not contribute any atomic orbitals to the CBM; the distribution of CBM mainly localized on the bottom layer of TiO2 moiety. In the electron injection process, the TiO2 electrode accepts electrons in conduction band from the excited dyes. It reveals that the effect of W6+/Zn2+ dopants on CBM distributions of catechol–TiO2 have significant impact on the electron injection process.


image file: c5ra15282h-f6.tif
Fig. 6 Selected molecular orbitals of three catechol–TiO2 systems. Left (panels (a)–(c)) and right ((d)–(f)) are the orbital distributions of the VBM and CBM for the Gamma point. (i)–(iii) are the geometries of three catechol–TiO2 systems.
3.2.2 The effect of W6+/Zn2+ dopants on electron injection through the catechol–TiO2 interface. Dopants W6+ and Zn2+ differ the distributions and energy levels of CBM significantly, and influence the electron injection process and electron injection distribution further. Based on the Bader charge analysis between catechol and TiO2 electrodes, an increase in the TiO2 electrodes charges is observed. In the pure catechol–TiO2 system, there is 0.934e from the catechol fragment to TiO2. In case of W6+ doping, 1.366e charge transfer into W6+ doped TiO2 has been observed; conversely, Zn2+ doping decreases the charge transfer with 0.443e. The difference in electronic density Δρ is presented in Fig. 7, which is estimated as follows:
Δρ = ρtotalρcatecholρTiO2
where ρtotal is the total electron density of catechol–TiO2 system, ρcatechol and ρTiO2 are the electron density of isolated catechol and TiO2 fragment, respectively. As shown in Fig. 7, the fuchsia areas show where the electron density has been enriched; conversely, the blue regions show where the density has been depleted.

image file: c5ra15282h-f7.tif
Fig. 7 The diffrence in electronic density between catechol and the TiO2 (the fuchsia and blue areas refer to the increased and decreased electron density).

In addition, dopants W6+ and Zn2+ also influence the dynamics of electron injection. The interfacial electron transfer has been simulated in the IET (Interfacial Electron Transfer) code;69,70 the further time-dependent survival probability in three different catechol sensitized TiO2 are provided in Fig. 8. It exhibits fully consistent behavior with the static charge transfer. Compared to pure catechol–TiO2 system, W6+ doping provides faster and more electron injection, in addition to lower recombination. On the one hand doping W6+ results in a more efficient electron injection, but on the other hand it makes the back electron transfer easier. Conversely, Zn2+ doping exhibits a slower electron transfer and more incomplete electron injection.


image file: c5ra15282h-f8.tif
Fig. 8 The time-dependent survival probability in three different catechol sensitized TiO2. The dashed lines correspond to elementary steps and the full lines are the exponential fitting (black, blue and green lines correspond to pure, W6+ and Zn2+ doped catechol–TiO2 systems, respectively).

4 Conclusions

In this research, we report a theoretical investigation of heteroatom-doped TiO2 electrode by modeling the TiO2 photoanode and catechol–TiO2 interface for DSSCs. The structural, electronic, and charge transfer properties of the catechol–TiO2 interfaces have been considered for electron injection process. According to our study, the dopant W6+ may benefit the electron injection process by moving the CB edge downward and introducing 5d-unoccupied orbitals located in the CB bottom of the TiO2. However, dopant Zn2+ shifts the CB edge upward with an insertion of 3d-occupied orbitals into the VB; while the bottom edge of CB remains unchanged. The quantitative analysis of charge transfer based on Bader analysis has exposed the critical electronic features underlying interfacial properties and interfacial electron transfers. The calculation reveals strong charge transfer between catechol and pure TiO2 (0.934e). W6+ has significantly increased the charge transfer toward the photoanode (1.366e), while doping Zn2+ may cause the lowest charge transfer toward the adsorbate catechol with only 0.443e. Furthermore, photo-induced charge transfer dynamics have also been described. It has indicated that the donor dopant W6+ accelerate the electron injection from dye to semiconductor, while the acceptor dopant Zn2+ slower the injection. Hence, it shows that diverse dopants can affect the electron injection process and provide valuable information. We thus envision that this theoretical investigation can provide important insights into the future design of more efficient materials for DSSCs.

Acknowledgements

This work was supported by the National Natural Science Foundation of China (Grant No. 21173096 and 21303068) and the State Key Development Program for Basic Research of China (Grant No.2013CB834801), and Young Scholar Training Program of Jilin University. The wavefunction plots are drawn with the help of the vaspmo program developed by Yang Wang. We also acknowledge Prof. Luis GC Rego for providing a copy of the IET code.

References

  1. M. Gratzel, Nature, 2001, 414, 338–344 CrossRef CAS PubMed.
  2. M. Gratzel, J. Photochem. Photobiol., C, 2003, 4, 145–153 CrossRef CAS.
  3. A. Hagfeldt and M. Gratzel, Acc. Chem. Res., 2000, 33, 269–277 CrossRef CAS PubMed.
  4. F. de Angelis, Acc. Chem. Res., 2014, 47, 3349–3360 CrossRef CAS PubMed.
  5. A. Fujishima and K. Honda, Nature, 1972, 238, 37–38 CrossRef CAS PubMed.
  6. A. Fujishima, X. Zhang and D. A. Tryk, Surf. Sci. Rep., 2008, 63, 515–582 CrossRef CAS PubMed.
  7. F. Zuo, K. Bozhilov, R. J. Dillon, L. Wang, P. Smith, X. Zhao, C. Bardeen and P. Feng, Angew. Chem., Int. Ed., 2012, 51, 6223–6226 CrossRef CAS PubMed.
  8. J. Schneider, M. Matsuoka, M. Takeuchi, J. Zhang, Y. Horiuchi, M. Anpo and D. W. Bahnemann, Chem. Rev., 2014, 114, 9919–9986 CrossRef CAS PubMed.
  9. G. Liu, H. G. Yang, J. Pan, Y. Q. Yang, G. Q. Lu and H.-M. Cheng, Chem. Rev., 2014, 114, 9559–9612 CrossRef CAS PubMed.
  10. K. H. Ko, Y. C. Lee and Y. J. Jung, J. Colloid Interface Sci., 2005, 283, 482–487 CrossRef CAS PubMed.
  11. X. Lu, X. Mou, J. Wu, D. Zhang, L. Zhang, F. Huang, F. Xu and S. Huang, Adv. Funct. Mater., 2010, 20, 509–515 CrossRef PubMed.
  12. Y.-C. Nah, I. Paramasivam and P. Schmuki, ChemPhysChem, 2010, 11, 2698–2713 CrossRef CAS PubMed.
  13. K. Lee, A. Mazare and P. Schmuki, Chem. Rev., 2014, 114, 9385–9454 CrossRef CAS PubMed.
  14. H. Irie, Y. Watanabe and K. Hashimoto, Chem. Lett., 2003, 32, 772–773 CrossRef CAS.
  15. T. Ohno, T. Mitsui and M. Matsumura, Chem. Lett., 2003, 32, 364–365 CrossRef CAS.
  16. S. In, A. Orlov, R. Berg, F. García, S. Pedrosa-Jimenez, M. S. Tikhov, D. S. Wright and R. M. Lambert, J. Am. Chem. Soc., 2007, 129, 13790–13791 CrossRef CAS PubMed.
  17. L. Sang, Y. Zhao and C. Burda, Chem. Rev., 2014, 114, 9283–9318 CrossRef CAS PubMed.
  18. B. O'Regan and M. Gratzel, Nature, 1991, 353, 737–740 CrossRef PubMed.
  19. W. R. Duncan and O. V. Prezhdo, Annu. Rev. Phys. Chem., 2007, 58, 143–184 CrossRef CAS PubMed.
  20. A. Hagfeldt, G. Boschloo, L. Sun, L. Kloo and H. Pettersson, Chem. Rev., 2010, 110, 6595–6663 CrossRef CAS PubMed.
  21. D. Cahen, G. Hodes, M. Gratzel, J. F. Guillemoles and I. Riess, J. Phys. Chem. B, 2000, 104, 2053–2059 CrossRef CAS.
  22. X. Zhang, F. Liu, Q.-L. Huang, G. Zhou and Z.-S. Wang, J. Phys. Chem. C, 2011, 115, 12665–12671 CAS.
  23. K.-P. Wang and H. Teng, Phys. Chem. Chem. Phys., 2009, 11, 9489 RSC.
  24. X. Ren, Q. Feng, G. Zhou, C.-H. Huang and Z.-S. Wang, J. Phys. Chem. C, 2010, 114, 7190–7195 CAS.
  25. C. Klein, M. K. Nazeeruddin, P. Liska, D. Di Censo, N. Hirata, E. Palomares, J. R. Durrant and M. Gratzel, Inorg. Chem., 2005, 44, 178–180 CrossRef CAS PubMed.
  26. Z.-S. Wang, Y. Cui, Y. Dan-oh, C. Kasada, A. Shinpo and K. Hara, J. Phys. Chem. C, 2008, 112, 17011–17017 CAS.
  27. G. Zhou, N. Pschirer, J. C. Schöneboom, F. Eickemeyer, M. Baumgarten and K. Müllen, Chem. Mater., 2008, 20, 1808–1815 CrossRef CAS.
  28. M. Gratzel, J. Photochem. Photobiol., C, 2003, 4, 145–153 CrossRef CAS.
  29. K. Suriye, P. Praserthdam and B. Jongsomjit, Appl. Surf. Sci., 2007, 253, 3849–3855 CrossRef CAS PubMed.
  30. F. Dong, S. Guo, H. Wang, X. Li and Z. Wu, J. Phys. Chem. C, 2011, 115, 13285–13292 CAS.
  31. A. Zaleska, Recent Pat. Eng., 2008, 2, 157–164 CrossRef CAS.
  32. Z. Zhao, Z. Li and Z. Zou, J. Phys. Chem. C, 2013, 117, 6172–6184 CAS.
  33. A. J. Frank, N. Kopidakis and J. v. d. Lagemaat, Coord. Chem. Rev., 2004, 248, 1165–1179 CrossRef CAS PubMed.
  34. H. Tian, L. Hu, C. Zhang, S. Chen, J. Sheng, L. Mo, W. Liu and S. Dai, J. Mater. Chem., 2011, 21, 863–868 RSC.
  35. A. Subramanian and H.-W. Wang, Appl. Surf. Sci., 2012, 258, 6479–6484 CrossRef CAS PubMed.
  36. R. Taziwa, E. L. Meyer, E. Sideras-Haddad, R. M. Erasmus, E. Manikandan and B. W. Mwakikunga, Int. J. Photoenergy, 2012, 2012(904321–904329), 904323 Search PubMed.
  37. T. Ma, M. Akiyama, E. Abe and I. Imai, Nano Lett., 2005, 5, 2543–2547 CrossRef CAS PubMed.
  38. M. Motlak, M. S. Akhtar, N. A. M. Barakat, A. M. Hamza, O. B. Yang and H. Y. Kim, Electrochim. Acta, 2014, 115, 493–498 CrossRef CAS PubMed.
  39. Q. Sun, J. Zhang, P. Wang, J. Zheng, X. Zhang, Y. Cui, J. Feng and Y. Zhu, J. Renewable Sustainable Energy, 2012, 4 Search PubMed.
  40. Q. Hou, Y. Zheng, J.-F. Chen, W. Zhou, J. Deng and X. Tao, J. Mater. Chem., 2011, 21, 3877–3883 RSC.
  41. X. Chen, C. Burda, J. Guo, K. E. Smith, P.-A. Glans and T. Learmonth, Arabian J. Sci. Eng., Sect. A, 2010, 35, 65–71 CAS.
  42. X. Chen, P.-A. Glans, X. Qiu, S. Dayal, W. D. Jennings, K. E. Smith, C. Burda and J. Guo, J. Electron Spectrosc. Relat. Phenom., 2008, 162, 67–73 CrossRef CAS PubMed.
  43. N. Serpone, J. Phys. Chem. B, 2006, 110, 24287–24293 CrossRef CAS PubMed.
  44. L. Sang, J. L. Gole, J. Wang, J. Brauer, B. Mao, S. M. Prokes and C. Burda, J. Phys. Chem. C, 2013, 117, 15287–15294 CAS.
  45. J. Zhang, W. Peng, Z. Chen, H. Chen and L. Han, J. Phys. Chem. C, 2012, 116, 19182–19190 CAS.
  46. M. Durr, S. Rosselli, A. Yasuda and G. Nelles, J. Phys. Chem. B, 2006, 110, 21899–21902 CrossRef CAS PubMed.
  47. K. Bhattacharyya, S. Varma, A. K. Tripathi, S. R. Bharadwaj and A. K. Tyagi, J. Phys. Chem. C, 2008, 112, 19102–19112 CAS.
  48. A. K. Chandiran, F. d. r. Sauvage, M. Casas-Cabanas, P. Comte, S. M. Zakeeruddin and M. Graetzel, J. Phys. Chem. C, 2010, 114, 15849–15856 CAS.
  49. J. Liu, H. Yang, W. Tan, X. Zhou and Y. Lin, Electrochim. Acta, 2010, 56, 396–400 CrossRef CAS PubMed.
  50. K.-P. Wang and H. Teng, Phys. Chem. Chem. Phys., 2009, 11, 9489–9496 RSC.
  51. D. C. Hurum, A. G. Agrios, K. A. Gray, T. Rajh and M. C. Thurnauer, J. Phys. Chem. B, 2003, 107, 4545–4549 CrossRef CAS.
  52. K. Woan, G. Pyrgiotakis and W. Sigmund, Adv. Mater., 2009, 21, 2233–2239 CrossRef CAS PubMed.
  53. B.-M. Kim, S.-G. Rho and C.-H. Kang, J. Nanosci. Nanotechnol., 2011, 11, 1515–1517 CrossRef CAS PubMed.
  54. M. Lazzeri, A. Vittadini and A. Selloni, Phys. Rev. B: Condens. Matter Mater. Phys., 2001, 63, 155409 CrossRef.
  55. L.-M. Liu, S.-C. Li, H. Cheng, U. Diebold and A. Selloni, J. Am. Chem. Soc., 2011, 133, 7816–7823 CrossRef CAS PubMed.
  56. F. Schiffmann, J. VandeVondele, J. Hutter, R. Wirz, A. Urakawa and A. Baiker, J. Phys. Chem. C, 2010, 114, 8398–8404 CAS.
  57. J. Yu, J. Fan and K. Lv, Nanoscale, 2010, 2, 2144–2149 RSC.
  58. G. Kresse and J. Hafner, Phys. Rev. B: Condens. Matter Mater. Phys., 1993, 47, 558–561 CrossRef CAS.
  59. G. Kresse and J. Furthmüller, Phys. Rev. B: Condens. Matter Mater. Phys., 1996, 54, 11169–11186 CrossRef CAS.
  60. G. Kresse and J. Furthmuller, Comput. Mater. Sci., 1996, 6, 15–50 CrossRef CAS.
  61. P. E. Blochl, Phys. Rev. B: Condens. Matter Mater. Phys., 1994, 50, 17953–17979 CrossRef.
  62. G. Kresse and D. Joubert, Phys. Rev. B: Condens. Matter Mater. Phys., 1999, 59, 1758–1775 CrossRef CAS.
  63. J. P. Perdew, K. Burke and M. Ernzerhof, Phys. Rev. Lett., 1996, 77, 3865–3868 CrossRef CAS.
  64. J. P. Perdew, K. Burke and M. Ernzerhof, Phys. Rev. Lett., 1997, 78, 1396 CrossRef CAS.
  65. D. E. P. Vanpoucke and G. Brocks, Phys. Rev. B: Condens. Matter Mater. Phys., 2008, 77, 241308 CrossRef.
  66. L.-M. Liu, S.-C. Li, H. Cheng, U. Diebold and A. Selloni, J. Am. Chem. Soc., 2011, 133, 7816–7823 CrossRef CAS PubMed.
  67. R. Sanchez-de-Armas, M. A. San-Miguel, J. Oviedo and J. F. Sanz, Comput. Theor. Chem., 2011, 975, 99–105 CrossRef CAS PubMed.
  68. R. O. Sanchez-de-Armas, J. Oviedo, M. A. N. San Miguel and J. F. Sanz, J. Phys. Chem. C, 2011, 115, 11293–11301 CAS.
  69. L. G. C. Rego and V. S. Batista, J. Am. Chem. Soc., 2003, 125, 7989–7997 CrossRef CAS PubMed.
  70. W. Li, L. G. C. Rego, F.-Q. Bai, J. Wang, R. Jia, L.-M. Xie and H.-X. Zhang, J. Phys. Chem. Lett., 2014, 5, 3992–3999 CrossRef CAS PubMed.

This journal is © The Royal Society of Chemistry 2015
Click here to see how this site uses Cookies. View our privacy policy here.