DOI:
10.1039/C5RA14108G
(Paper)
RSC Adv., 2015,
5, 80829-80843
Synthesis and application of polypyrrole coated tenorite nanoparticles (PPy@TN) for the removal of the anionic food dye ‘tartrazine’ and divalent metallic ions viz. Pb(II), Cd(II), Zn(II), Co(II), Mn(II) from synthetic wastewater†
Received
17th July 2015
, Accepted 15th September 2015
First published on 16th September 2015
Abstract
The present study deals with the synthesis of polypyrrole coated tenorite nanoparticles. The synthesized nanoparticles were characterized by XRD, TEM, SEM and EDS. TEM images showed the formation of nanoparticles with 26–30 nm diameter. The BET surface area of the nanoparticles was determined to be 425 m2 g−1 while the pore diameter of the nanoparticles was found to be 3.57 nm which showed the formation of mesoporous nanoparticles. The pHzpc of the nanoparticles was determined to be 4.4. The removal efficiency of the synthesized nanoparticles for an anionic food dye ‘tartrazine’ was investigated. Decreased removal was observed, when the dye concentration was increased from 100 to 200 mg L−1. It was observed that an acidic medium was favorable for tartrazine removal. A thermodynamic study suggested the endothermic nature of tartrazine adsorption. The value of Ea for the present system was found to be 26.97 kJ mol−1. The best suitable kinetic model was well explained by the pseudo second order model. Langmuir adsorption capacity was measured to be 42.50 mg g−1. Exhausted (dye loaded) nanoparticles were used as an efficient adsorbent for the removal of divalent metallic ions viz. Pb(II), Cd(II), Co(II), Mn(II), Zn(II) and were found to be efficient for the removal of metallic species from a single solute system as well as a multi-solute system. This study reveals that polypyrrole coated tenorite nanoparticles are very efficient for dye removal and the dye loaded exhausted adsorbent is equally good for metal removal because tartrazine loading on nanoparticles makes the surface suitable for metal interaction. Thus, the synthesized nanoparticles prove to be a good candidate for the treatment of dye and metal bearing wastewater.
1. Introduction
Many industries such as pharmaceutical, textile, plastics, leather, cosmetic, printing, paper, rubber and food industries often use a variety of dyes in different processes and usually discharge a large amount of dye containing waste into the aquatic environment.1,2 Most of the dyes are harmful to fauna and flora.3 Dyes may pose carcinogenic and mutagenic effect.4 Furthermore, dye containing effluents may affect aquatic environments by interrupting transmission of sunlight into the aqueous streams.3,5 Among the various dyes, tartrazine is commonly used in a variety of food materials as a coloring agent.6 Tartrazine is also used in the shells of medicinal capsules, cosmetics, vitamins and syrups.7,8 Tartrazine (C16H9N4Na3O9S2) is an anionic dye which releases anions in an aqueous medium (Fig. 1).9
 |
| | Fig. 1 Structure of tartrazine dye.9 | |
Though, tartrazine is used in variety of food materials, but its higher amount can pose mutagenic and carcinogenic effects.5,8,10 Other health problems which can arise due to excess inhalation of tartrazine are asthma, migraine, itching, hypersensitivity, thyroid cancer, blurred vision and skin eczema. Due to the toxic nature of dyes, much attention should be paid for proper treatment of dye bearing wastewater before being discharged into the water stream. Several techniques viz. precipitation, ozonation, reverse osmosis, ion-exchange, membrane filtration, electrochemical oxidation, coagulation, flocculation and adsorption have been developed for the treatment of dye-containing effluents.1,6,11 However, most of these technologies are expensive and not highly efficient for the treatment of a wide range of dye containing wastewater.
Among these methods, adsorption technique has been considered to be cost effective and efficient technique for the treatment of dye loaded wastewater.3,12,13 Variety of adsorbents have been discovered and used for the treatment of dye laden wastewater.7,14,15 Among them, activated carbon is the most widely used adsorbent to remove different kinds of dyes from wastewater because of its high adsorption capacity, but at the same time its high cost has always inspired the scientists to discover new adsorbent materials. Recently, nanosized materials have emerged as a strong competitor of conventional adsorbent materials due to their unique properties such as the large surface area to volume ratio, chemical stability, etc. and have attracted attention of several researchers to develop varieties of nanomaterials for water treatment process.16,17 Properties of nanomaterial can be further improvised by chemical modification according to pollutant species which makes it a strong candidate for treatment of both organic and inorganic pollutants.18,19 Polypyrrole modified adsorbent materials were found to be very efficient in removal of nitrophenols, reactive blue 19, alizarin red-S, alizarin yellow GG etc.20,21 In the present study, polypyrrole coated tenorite (PPy@TN) nanoparticles were synthesized and characterized by different techniques. PPy@TN nanoparticles were used for the removal of an anionic food dye ‘tartrazine dye’ (TZ) from synthetic wastewater. The effect of various important parameters was investigated and optimum conditions for maximum removal were determined. After dye adsorption, tartrazine loaded nanoparticles (TZ-PPy@TN) were used as adsorbent material for the treatment of divalent metallic ions from synthetic wastewater.
2. Materials and method
2.1. Synthesis of polypyrrole coated tenorite (PPy@TN) nanoparticles
Synthesis of PPy@TN can be divided into two parts (a) synthesis of tenorite nanoparticles (TN) and (b) modification of tenorite nanoparticles with polypyrrole (PPy@TN).
(a) For the synthesis of tenorite nanoparticles, the copper nitrate solution was precipitated by adding ammonia solution drop by drop into 0.5 M copper nitrate solution. After precipitation, precipitate (Cu(OH)2) was separated by centrifugation and washed several times with ultrapure water. After proper washing, the precipitate was dried in hot air oven at 60 °C. Dried precipitate was then calcined at 400 °C (±0.2 °C) for 2 h in the Muffle furnace (NABERTHERM B-170) by maintaining heating rate of 5 °C min−1 to get tenorite nanoparticles.
(b) For synthesis of PPy@TN nanoparticles, 5 g of tenorite nanoparticles were sonicated in 150 mL of ultrapure water and then 5 mL of pyrrole was added into this solution and stirred for 15 min. After stirring, FeCl3 solution (oxidizing agent) was added drop by drop into this mixture solution and again stirred for 5 h on a magnetic stirrer at room temperature. The colour of solution changed from brown to black on adding FeCl3. After a sufficient contact time, polypyrrole coated tenorite nanoparticles were separated from the solution by centrifugation at 5000 rpm for 15 min and multistep washing was carried out for the removal of another product (FeCl2) which was formed during the reaction of pyrrole and FeCl3. Separated PPy@TN nanoparticles were dried and grounded in tube mill and sieved to remove lumps of particles formed during the drying process.
Tenorite nanoparticles, PPy@TN and dye loaded nanoparticles (TZ-PPy@TN) were characterized by transmission electron microscopy (TEM), X-ray diffraction (XRD), energy-dispersive X-ray spectroscopy (EDS) and scanning electron microscopy (SEM). PPy@TN nanoparticles were used for the removal of tartrazine dye from synthetic wastewater. Dye loaded nanoparticles were used for the treatment of divalent metallic ions from synthetic wastewater. XRD patterns of nanoparticles were recorded on a PANALYTICAL X-ray diffractometer using Co Kα radiation (λ = 1.790307 Å) operated at 40 kV and 40 mA in the 2θ range of 15–100°. The particle size and morphology of the samples were determined by using TEM images taken with a Hitachi H-7600 TEM with an acceleration voltage of 200 kV. The surface morphology was studied by SEM analysis, using the Hitachi S-4800 system with an acceleration voltage of 20 and 30 kV. Elemental analysis of nanoparticles was examined by EDS. FTIR images of tenorite nanoparticles and PPy@TN nanoparticles were recorded in the range of 400 to 4000 cm−1 (ATR-FTIR, Bruker Vertex 70 model) to investigate the changes in tenorite nanoparticles due to modification with polypyrrole nanoparticles. For determination of BET surface area, nitrogen adsorption–desorption measurements were conducted at 77 K with a Quantachrome instrument. The powders were degassed in vacuum at 150 °C for 24 h prior to the measurement. pHzpc of nanoparticles was determined by earlier reported method.22 In brief, 0.01 M NaCl solutions of different pH ranging from 2 to 12 were prepared. 0.20 g of nanoparticles were placed in NaCl solution of different pH and solution was kept for 48 h and then nanoparticles were separated from NaCl solution and the pH of the solution was measured. A graph between initial pH and final pH was plotted and the intersection of initial and final pH was recorded as pHzpc of adsorbent.
2.2. Treatment of tartrazine bearing synthetic wastewater
Removal study of tartrazine (TZ) from synthetic wastewater was performed in a batch process to optimize various important parameters such as contact time, concentration, dose, pH and temperature. Stock solution (1000 mg L−1) of TZ was prepared by dissolving required amount of TZ in ultrapure water. TZ solution with different concentration ranges (100 to 200 mg L−1) were prepared by diluting the stock solution. pH of TZ solutions was adjusted by adding 0.1 M HCl/NaOH solution. Adsorption experiments were conducted with different dye concentration (100–200 mg L−1), dosage (1 to 10 g L−1), temperature (293–323 K) and pH (2.0 to 12.0) to investigate the effect of each variable on TZ removal from synthetic wastewater. For batch experiments, 1 g L−1 of PPy@TN nanoparticle was added into dye solution and agitated at room temperature in a temperature controlled shaker. Treated dye solutions were collected at different time intervals to determine the equilibrium time. Nanoparticles were separated from the dye solution by centrifugation at 4000 rpm for 10 min and the absorbance of supernatant solution was recorded by UV-visible spectrophotometer at λmax 430 nm for residual dye concentration.8 The removal (%) of dye and the amount of dye adsorbed were calculated by following equations.| |  | (1) |
| |  | (2) |
where Ci (mg L−1) and Ce (mg L−1) are the initial and equilibrium concentrations of dye respectively. qe (mg g−1) is the amount adsorbed on per unit mass of the adsorbent at equilibrium, W is the mass of adsorbent (g) and V (L) is the volume of solution. Dye loaded nanoparticles were further used as adsorbent for the removal of metallic ions viz. Pb(II), Cd(II), Co(II), Mn(II), Zn(II) from synthetic wastewater. For this study, the single solute solution of four different concentration ranges viz. 75, 100, 125 and 150 mg L−1 were prepared by adding the appropriate amounts of their salt into ultrapure water. Multisolute metal solution of 100 mg L−1 was also prepared to observe the adsorption capacity of nanoparticle for different metals in a multisolute system. The residual concentration of metal was determined by ICP-OES spectrometer.
3. Result and discussions
3.1. Characterization of nanoparticles
XRD analysis of tenorite nanoparticle, polypyrrole coated tenorite nanoparticles (PPy@TN) and tartrazine loaded nanoparticles (TZ-PPy@TN) are shown in Fig. 2. In Fig. 2a, all peaks correspond to the tenorite phase of CuO and all the diffraction peaks can be indexed to tenorite phase of CuO which is in good agreement with the reference data (ICPDS data 98-001-6025). It is clear from XRD of polypyrrole coated tenorite nanoparticles that polypyrrole has modified the tenorite nanoparticles and new peaks appear in the modified sample due to polypyrrole reaction (Fig. 2b). However, intensity of characteristic peaks of nano tenorite is very low in the coated sample. According to EDS analysis of tenorite nanoparticles, the Cu/O atomic ratio (Cu = 51.02%; O = 48.98%) was 1.04 (Fig. 2a-1). Elemental composition of PPy@TN nanoparticle is different from tenorite nanoparticles, which shows the modification of tenorite nanoparticles (Fig. 2b-1). Further, elemental composition of TZ-PPy@TN nanoparticles shows the presence of other elements like N and S which is due to dye loading (Fig. 2c-1). TEM images of nano tenorite, PPy@TN and TZ-PPy@TN nanoparticles are shown in Fig. 3.
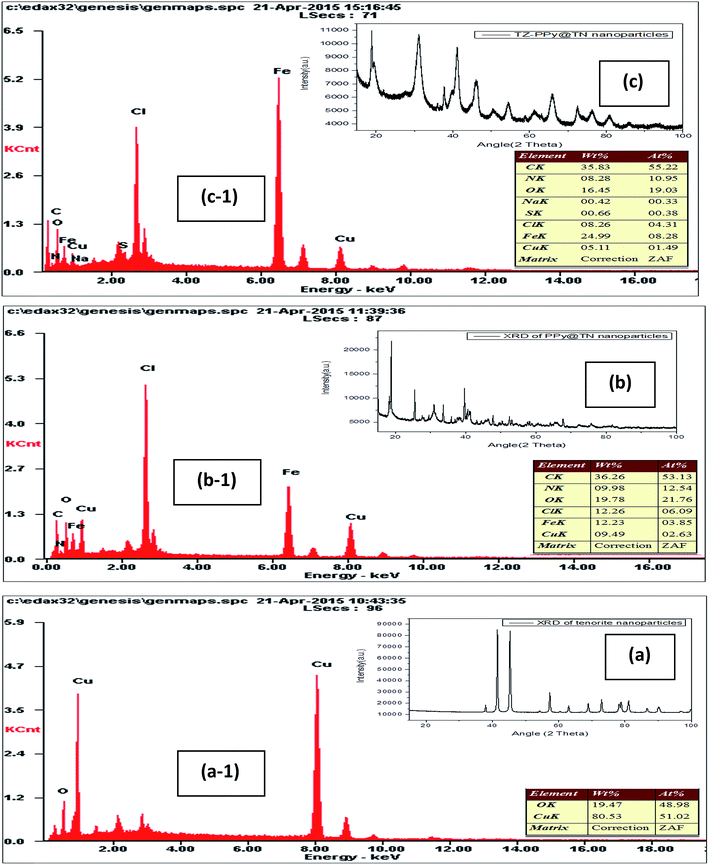 |
| | Fig. 2 XRD of (a) nano tenorite; (b) polypyrrole coated tenorite nanoparticles (PPy@TN); (c) tartrazine loaded nanoparticles (TZ-PPy@TN); (a-1) EDS of nano tenorite; (b-1) polypyrrole coated tenorite nanoparticles (PPy@TN); (c-1) tartrazine loaded nanoparticles (TZ-PPy@TN). | |
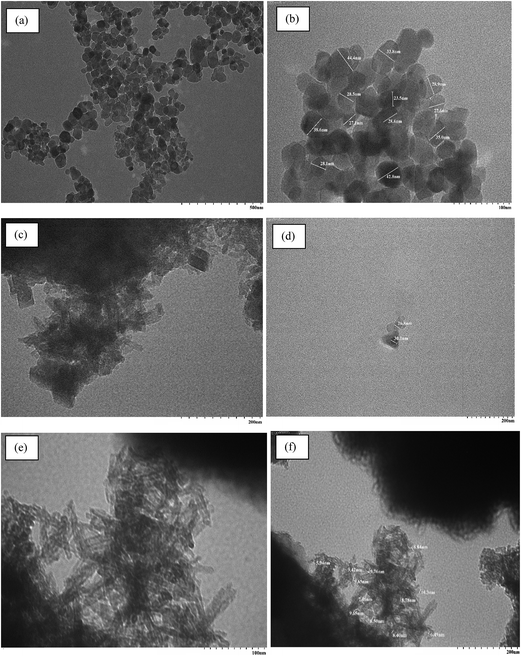 |
| | Fig. 3 (a and b) TEM of nano tenorite; (c and d) PPy@TN and (e and f) TZ-PPy@TN. | |
The TEM image of nano tenorite shows the formation of well dispersed hexagonal and spherical nanoparticles with mean diameter ∼23–45 nm. After polypyrrole coating, some tube like and brick like structures appeared having diameter in the range of ∼26–30 nm. In TZ-PPy@TN nanoparticles, almost all particles have similar morphology like a small tube structure (∼5–11 nm). Further, surface morphology was investigated by SEM. SEM images of nano tenorite and PPy@TN and TZ-PPy@TN nanoparticles are given in Fig. 4. SEM of nano tenorite also shows that the particle morphology is spherical and hexagonal (Fig. 4a and b). SEM images of PPy@TN nanoparticles showed different morphology, which indicates that polypyrrole completely modified the surface of tenorite nanoparticles (Fig. 4c and d). Highly agglomerated particles can be seen in TZ-PPy@TN nanoparticles (Fig. 4e and f). FTIR of tenorite nanoparticle, PPy@TN and TZ-PPy@TN further is shown in Fig. S1 (in ESI†). FTIR results clearly indicates that polypyrrole totally changed surface properties of tenorite nanoparticles (in ESI, Section S1†).
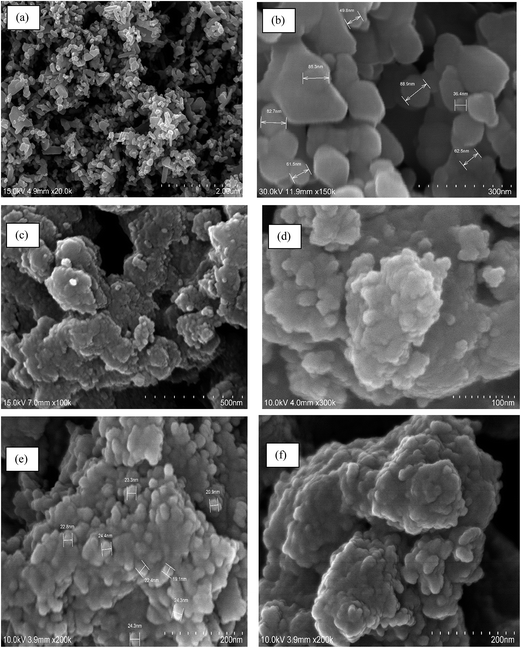 |
| | Fig. 4 (a and b) SEM of nano tenorite; (c and d) PPy@TN; (e and f) TZ-PPy@TN. | |
N2 adsorption and desorption isotherms of nanoparticles are shown in Fig. 5. BET surface area of synthesized nanoparticles was determined to be 425 m2 g−1, while pore volume and pore diameter were 0.38 cm3 g−1 and 3.57 nm respectively. Value of pore diameter suggested the formation of mesoporous nanoparticles.
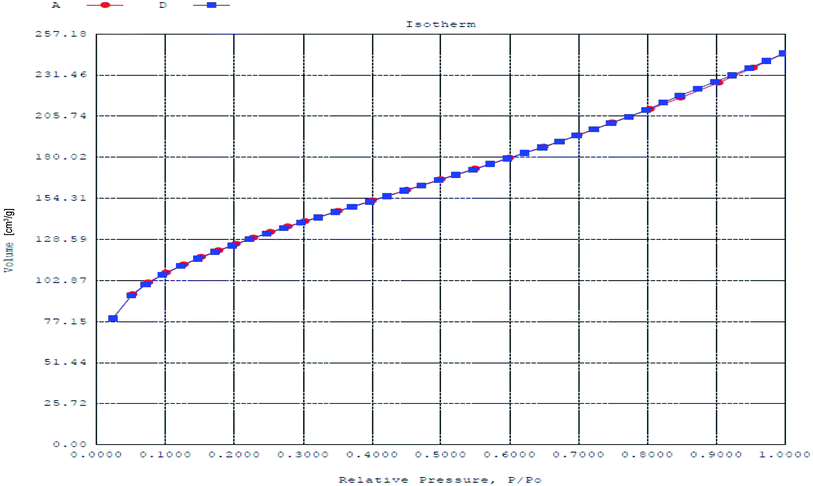 |
| | Fig. 5 Nitrogen adsorption–desorption isotherm plot for PPy@TN nanoparticles. | |
BET surface area of tenorite nanoparticles and TZ-PPy@TN nanoparticles were calculated with their N2 adsorption and desorption isotherms (in ESI Fig. S2a and S2b†). BET surface area, pore volume and pore diameter of tenorite nanoparticles were calculated to be 6.56 m2 g−1, 0.002 cm3 g−1 and 1.107 nm respectively while BET surface area of TZ-PPy@TN were determined to be 51.49 m2 g−1. Decreased surface area of TZ-PPY@TN in comparison of PPy@TN nanoparticles is due to loading of dye molecules on PPy@TN nanoparticles. Pore volume for TZ-PPy@TN was recorded to be 0.013 cm3 g−1 while pore diameter was found to be 0.99 nm.
3.2. Adsorption studies
3.2.1. Effect of contact time and initial dye concentration.
The contact time is the most important design parameter. The appropriate contact time between adsorbent and adsorbate during the adsorption process is necessary to achieve maximum removal of pollutant species. In this view, dye solution was agitated with adsorbent for different time intervals from 15 min to 420 min.
It was observed that initial removal rate is very rapid and approximately 87% (±0.01) of dye were removed within 15 min. Removal of dye rapidly increased up to 180 min and thereafter up to 300 min of contact time, we get approximately the same result and further no change in removal percentage was observed upto 420 min. This behavior is due to availability of plenty of adsorption sites at the initial stage. After equilibrium time (300 min), there is no change in the removal of dye so 300 min contact time was selected for all other experimental setup. To see the effect of initial concentration on the removal of dye, batch experiments with different dye concentration ranges were carried out at equilibrium time and the plot of adsorption capacity (qe)/removal (%) versus different TZ concentration is shown in Fig. 6. Removal of dye decreased on increasing dye concentration. At lower initial concentration, excess adsorption sites are available for dye molecules, but for higher concentration of dye, the ratio of adsorbent sites are reduced in comparison to available dye molecules and all the binding sites easily get saturated due to the higher concentration of dye molecules in the solution resulting in the decreased removal at higher concentration. Further, the residual dye concentration is higher for higher dye concentrations. At a fixed nanoparticle dose, the amount of dye adsorbed increased from 29.28 to 41.27 mg g−1 (±0.01) by increasing concentration of dye solution from 100 to 200 mg L−1. In case of lower concentration most of the adsorption sites remain unoccupied due to less number of dye molecules while for higher concentration most of the binding sites were occupied by a dye molecule resulting in higher adsorption capacity in comparison to lower concentration.
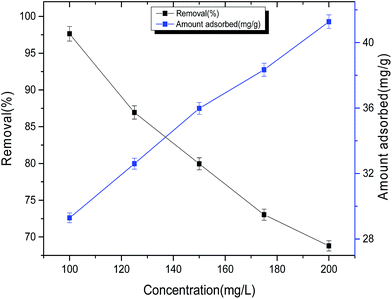 |
| | Fig. 6 Effect of initial concentration on dye removal. | |
3.2.2. Effect of pH on removal of tartrazine.
Solution pH is an important factor which is responsible for the adsorbent surface charge and the degree of ionization. Effect of solution pH on removal of TZ was assessed by varying pH in the range of 2.0 to 12 by keeping the other experimental conditions constant (100 mg L−1; 200 rpm; 293 K; 0.05 g per 15 mL dose, contact time 300 min). The effect of solution pH on removal of TZ is shown in Fig. 7a. It was observed that the removal of dye was higher in acidic medium in comparison to alkaline medium. Similar findings were also reported by Mittal et al. (2007).6 Removal decreased from 99.28 to 73.88% (±0.01) on increasing pH from 2.0 to 12.0. pHzpc of PPy@TN was recorded to be 4.4 (Fig. 7b). When the pH of solution is lower than pHzpc of adsorbent, surface will be positively charged but as pH goes above pHzpc, number of negatively charged adsorbent surface sites increases. In aqueous solution, tartrazine releases sodium ions and sulfonate anions. In acidic medium, due to positively charged surface sulfonate anions can be easily adsorbed (Fig. 7c).
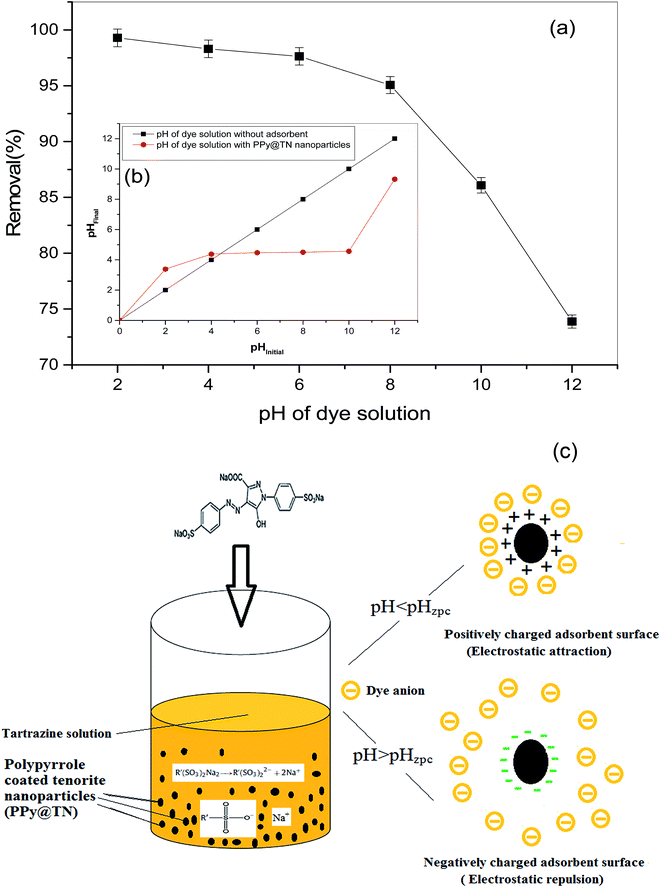 |
| | Fig. 7 (a) Effect of pH on removal of TZ from synthetic wastewater (b) pHzpc of PPy@TN nanoparticles. (c) Effect of solution pH on adsorbent surface. | |
Further, in acidic medium, high degree of surface protonation favors electrostatic attraction between positively charged adsorbent surfaces and negatively charged anionic sulfonate groups. In contrast, at higher pH values (pH > pHzpc), the adsorbent surface becomes more negatively charged.
In alkaline medium, excess amount of –OH− ions compete with the negatively charged anionic species and electrostatic repulsion between the anionic species and the negatively charged surface sites is increased, resulting in the decreased removal of TZ.
3.2.3. Effect of adsorbent dose on removal of TZ dye.
The adsorbent dose is an important parameter which can affect the removal of pollutants. The effect of adsorbent dose on removal of TZ was investigated by adding different amounts of dose (1 to 10 g L−1) into dye solution of 100 mg L−1 and agitating at 200 rpm for 300 min. After equilibrium time, the TZ solution was separated from adsorbent by centrifugation and the residual concentration in the supernatant dye solution was analyzed. The plot of TZ removal (%) versus dose (g L−1) is shown in Fig. 8. The removal of TZ increased rapidly from 74.50 to 98.89% (±0.02) by increasing adsorbent dose from 1 g L−1 to 3.3 g L−1 and after that there was not any significant change in removal percentage of TZ. Approximately similar result was observed even at higher adsorbent dose. This behavior is obvious because on increasing adsorbent dose initially, removal increased due to the availability of more active sites for a fixed amount of dye concentration. However, adsorption capacity (mg g−1) decreased with further increasing of adsorbent dose due to unsaturated surface at higher adsorbent dose for a particular concentration. Higher adsorbent dosage may also cause aggregation of adsorption sites which can decrease total available adsorbent surface for adsorbate interaction.23
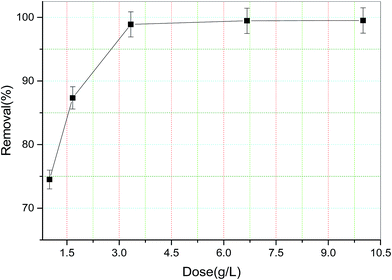 |
| | Fig. 8 Effect of adsorbent dose on TZ removal from synthetic wastewater. | |
4. Kinetic modelling of tartrazine removal process
The study of adsorption kinetics is necessary for understanding the mechanism of adsorption process and also gives an idea about the rate at which a pollutant species is removed from aqueous solutions.24 Several processes may be involved in the removal of any pollutant species such as pore diffusion, film diffusion and intraparticle diffusion. In order to explain the adsorption mechanism, kinetic adsorption data were analyzed by using different kinetic models viz. pseudo first-order model, pseudo-second-order model, intraparticle diffusion, Boyd model and Bangham model. The kinetic data were collected for various initial dye concentrations by keeping other experimental parameters constant.
4.1. Pseudo first order and pseudo second order model
The values of pseudo first order and second order kinetic model were calculated from the following equations:25| |  | (3) |
| |  | (4) |
where k1 (min−1) and k2 (g mg−1 min−1) are the rate constants of pseudo-first and pseudo-second order models respectively. h is known as the initial adsorption rate (mg g−1 min−1). qt (mg g−1) and qe (mg g−1) are the amounts of dye adsorbed at time t and equilibrium respectively. t is the contact time (min). The slope and intercept of the plot of log(qe − qt) against t gives the value of k1 and qe respectively, while the slope and intercept of the plot of t/qtversus t gives the value of pseudo-second-order rate constant (k2) and the equilibrium adsorption capacity (qe) respectively. The values of different kinetic parameters at different concentrations are shown in Table 1.
Table 1 The values of different kinetic parameters for the removal of TZ by PPy@TN nanoparticles
| |
Concentration of dye solution |
Experimental qe (mg g−1) |
Predicted qe (mg g−1) |
k
1 × 10⁻⁶ (min−1) |
R
2
|
| Pseudo first order kinetic parameters |
125 mg L−1 |
32.60 |
6.53 |
7.8 |
0.93 |
| 150 mg L−1 |
35.98 |
7.12 |
7.1 |
0.99 |
| 175 mg L−1 |
38.34 |
10.49 |
7.5 |
0.95 |
| 200 mg L−1 |
41.28 |
13.20 |
8.7 |
0.96 |
| |
Concentration of dye solution |
Experimental qe (mg g−1) |
Predicted qe (mg g−1) |
k
2 × 10⁻⁷ (g mg−1 min−1) |
R
2
|
| Pseudo second order kinetic parameters |
125 mg L−1 |
32.60 |
32.05 |
0.56 |
0.99 |
| 150 mg L−1 |
35.98 |
35.21 |
0.53 |
0.99 |
| 175 mg L−1 |
38.34 |
37.31 |
0.33 |
0.99 |
| 200 mg L−1 |
41.28 |
40.65 |
0.24 |
0.99 |
| |
Concentration of dye solution |
C (mg g−1) |
k
id
|
R
2
|
| Intraparticle diffusion parameters |
125 mg L−1 |
25.48 |
0.39 |
0.97 |
| 150 mg L−1 |
27.72 |
0.46 |
0.97 |
| 175 mg L−1 |
26.85 |
0.63 |
0.98 |
| 200 mg L−1 |
27.17 |
0.81 |
0.98 |
| |
Concentration of dye solution |
B (min−1) |
D
i × 10−18 (m2 min−1) |
R
2
|
| Boyd model parameters |
125 mg L−1 |
0.0079 |
2.68 |
0.93 |
| 150 mg L−1 |
0.0072 |
2.45 |
0.99 |
| 175 mg L−1 |
0.0075 |
2.72 |
0.95 |
| 200 mg L−1 |
0.0086 |
3.09 |
0.96 |
| |
Concentration of dye solution |
β (g mg−1 min−1) |
α (mg g−1 min−1) |
R
2
|
| Bangham model parameters |
125 mg L−1 |
3.85 |
0.14 |
0.94 |
| 150 mg L−1 |
3.33 |
0.12 |
0.99 |
| 175 mg L−1 |
2.46 |
0.13 |
0.95 |
| 200 mg L−1 |
2.01 |
0.15 |
0.95 |
It is clear from Fig. 9a that the plots of log(qe − qt) versus t for pseudo first order kinetic model does not show good results while the plots of t/qtversus t (Fig. 9b) gives a straight line for all the selected dye concentrations which shows the applicability of the pseudo-second order equation for TZ adsorption. Further, it is clear from Table 1 that qe values calculated from pseudo-second-order model is rather comparable with experimental qe in comparison to pseudo first order model. Calculated value of qe is not consistent with experimental qe values for pseudo first order model which indicates the suitability of the pseudo-second-order model. The corresponding R2 value was greater for pseudo second order model in comparison to pseudo-first-order kinetic model which also supports the suitability of pseudo second order kinetic model. Fast removal of TZ from adsorbate solution suggested that most part of the adsorbate removed by interaction of exterior surface of adsorbent while later adsorption may be due to involvement of other process like Intraparticle and pore diffusion mechanism.
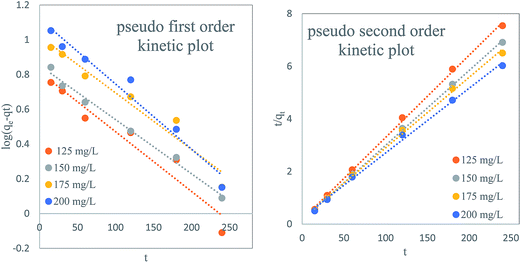 |
| | Fig. 9 (a) Pseudo first order plot (b) pseudo second order kinetic plot for TZ adsorption by PPy@TN nanoparticles. | |
4.2. Intraparticle diffusion model
The possibility of intraparticle diffusion was also investigated to identify the rate determining step by applying Weber–Morris intraparticle diffusion model on kinetic data. Intraparticle diffusion model can be expressed as follows:26where qt, kid and C are the amount of adsorbed dye onto adsorbent (mg g−1) at time t, intraparticle diffusion rate constant and intercept (mg g−1) respectively.
The values of kid and C were calculated from the slope and intercept of plot qtversus t0.5. The intercept ‘C’ which is proportional to boundary layer thickness, gives an idea about the thickness of the boundary layer. In case of the larger intercept, the boundary layer effect will be greater. Intraparticle diffusion usually starts when surface of adsorbent get saturated with adsorbate molecules. The value of kid increased with increasing dye concentration due to driving force (Table 1). Intra-particle diffusion plot for all selected concentration was found to be linear with good correlation coefficient (Fig. 10a) which indicates the possibility of intraparticle diffusion of dye molecule. According to this model if the linearized curve passes through the origin, intraparticle diffusion plot will be the rate controlling step, but in present case, the lines of plot do not pass through the origin it shows that the intraparticle diffusion is not the only rate limiting factor in case of TZ removal by PPy@TN nanoparticles.23 Further, R2 values determined for all selected concentration showed the feasibility of intraparticle diffusion model.
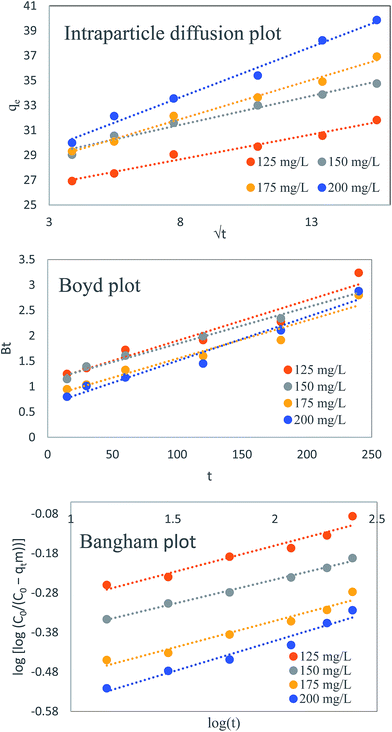 |
| | Fig. 10 (a) Intraparticle diffusion plot (b) Boyd plot (c) Bangham plot for TZ adsorption by PPy@TN nanoparticles. | |
4.3. Boyd model
Removal of adsorbate molecules can also be assessed by film diffusion, so to check the possibility of film diffusion, Boyd model was also applied on kinetic data. It can be expressed by following equations:27| |  | (7) |
| | | Bt = −0.4977 − ln(1 − F) | (8) |
B
t
is a mathematical function of F, while F is the fraction of dye molecule adsorbed at any time qt (mg g−1) and dye molecule adsorbed at equilibrium qe (mg g−1). The plots of Btvs. t at different initial concentrations are shown in Fig. 10b. The value of B (min−1) was calculated from the slope of the Boyd plot ‘Btversus t’. The linearity of Boyd plot gives an idea to distinguish between Intraparticle diffusion and film diffusion. It is clear from Boyd plot that linear plots are not passing through the origin, which indicate that adsorption process is governed by film diffusion but it is not only the rate controlling step. Value of Di (m2 min−1), diffusion constant can be calculated from following equation:
| |  | (10) |
where ‘
r’ is the radius of adsorbent particles.
4.4. Bangham's equation (pore diffusion model)
In some cases pore diffusion may be the only rate controlling step. To check this possibility in present system, Bangham's equation was applied on kinetic data by using following equation:28,29| |  | (11) |
where α(<1) and k0 are the Bangham constants. qt (mg g−1) is the dye amount adsorbed at time t, C0 is the initial dye concentration (mg L−1), V is the volume of dye solution (mL), m is the weight of adsorbent (g L−1). Values of Bangham parameters, α and k0 were obtained from the slopes and intercepts of plot log[log(C0/(C0 − qtm))] versus log![[thin space (1/6-em)]](https://www.rsc.org/images/entities/char_2009.gif) t (Fig. 10c). The values of α and k0 are given in Table 2. The plot was found to be linear for all selected concentration ranges with good correlation coefficient (>0.9) indicating pore diffusion is the only rate controlling step.
t (Fig. 10c). The values of α and k0 are given in Table 2. The plot was found to be linear for all selected concentration ranges with good correlation coefficient (>0.9) indicating pore diffusion is the only rate controlling step.
Table 2 Values of different isotherm parameters for TZ removal by PPy@TN nanoparticles
| |
25 °C |
30 °C |
35 °C |
45 °C |
|
Langmuir isotherm parameters
|
|
q
0 (mg g−1) |
38.21 |
39.73 |
40.63 |
42.50 |
|
b (L mg−1) |
1.24 |
2.18 |
3.49 |
9.09 |
|
R
2
|
0.67 |
0.61 |
0.60 |
0.55 |
|
χ
2
|
0.81 |
1.33 |
1.55 |
2.49 |
![[thin space (1/6-em)]](https://www.rsc.org/images/entities/char_2009.gif) |
|
Freundlich isotherm parameters
|
|
K
f (mg1−1/n L1/n g−1) |
25.69 |
27.41 |
28.99 |
31.80 |
|
n (g L−1) |
9.52 |
9.43 |
9.82 |
10.11 |
|
R
2
|
0.91 |
0.88 |
0.87 |
0.82 |
|
χ
2
|
0.22 |
0.46 |
0.53 |
1.09 |
![[thin space (1/6-em)]](https://www.rsc.org/images/entities/char_2009.gif) |
|
Dubinin–Radushkevich (D–R) isotherm parameters
|
|
q
m (mg g−1) |
37.18 |
38.96 |
40.04 |
42.18 |
|
β (mol2 kJ−2) |
1.97 |
0.79 |
0.40 |
0.13 |
|
E (kJ mol−1) |
0.50 |
0.79 |
1.11 |
1.93 |
|
R
2
|
0.56 |
0.54 |
0.55 |
0.52 |
|
χ
2
|
1.03 |
1.54 |
1.74 |
2.62 |
![[thin space (1/6-em)]](https://www.rsc.org/images/entities/char_2009.gif) |
|
Redlich–Peterson (R–P) isotherm parameters
|
|
a
RP (L g−1) |
0.16 |
0.24 |
0.26 |
0.48 |
|
b
RP (L g−1) |
28.27 |
29.14 |
29.73 |
30.34 |
|
g
|
0.024 |
0.019 |
0.027 |
0.013 |
|
R
2
|
0.99 |
0.99 |
0.98 |
0.99 |
|
χ
2
|
0.01 |
0.02 |
0.04 |
0.04 |
![[thin space (1/6-em)]](https://www.rsc.org/images/entities/char_2009.gif) |
|
Sips isotherm parameters
|
|
q
m (mg g−1) |
19.49 |
20.05 |
22.55 |
25.97 |
|
K
S (L mg−1) |
8.63 |
12.08 |
7.69 |
5.29 |
|
m
S
|
0.104 |
0.106 |
0.101 |
0.098 |
|
R
2
|
0.91 |
0.87 |
0.88 |
0.82 |
|
χ
2
|
0.22 |
0.46 |
0.53 |
1.09 |
5. Effect of temperature and thermodynamic study
Usually dye industries release effluents at different temperatures.30 The temperature has significant effect on the adsorption process, so it is necessary to investigate the effect of temperature on removal of TZ.
To study this effect, TZ solutions of different concentrations viz. 100, 125, 150, 175 and 200 mg L−1 were agitated with adsorbent at four different temperatures 293, 303, 313 and 323 K up to equilibrium. Fig. 11 depicts the effect of temperature on the removal of TZ from synthetic wastewater. Increased dye removal on increasing solution temperature indicates the endothermic nature of removal process. The reason of increased removal at higher temperature may be due to the increased mobility of adsorbate molecules and also due to pore enlargement which exposes more surface sites for adsorbate interaction.
Thermodynamic parameters provide important information about the mechanism of adsorbate removal. Various thermodynamic parameters viz. change in Gibbs free energy (ΔG°), change in enthalpy (ΔH°) and change in entropy (ΔS°) were calculated by the following equations:25
| | ΔG° = −RT![[thin space (1/6-em)]](https://www.rsc.org/images/entities/char_2009.gif) ln ln![[thin space (1/6-em)]](https://www.rsc.org/images/entities/char_2009.gif) kc kc | (12) |
| |  | (13) |
| |  | (14) |
where Δ
G° is the Gibbs free energy change (kJ mol
−1),
R is the universal gas constant (8.314 J mol
−1 K
−1),
T is absolute temperature (K) and
kc is the distribution coefficient,
Ce is the equilibrium concentration of TZ dyes,
qe is the amount of TZ dyes adsorbed per unit weight of nanoparticles at equilibrium. The value of Δ
G° was determined to be −9.06, −11.04, −12.77 and −16.07 at 293, 303, 313 and 323 K respectively. The negative value of Δ
G° at all selected temperatures, shows spontaneous nature of adsorption process and confirm the feasibility of TZ adsorption on PPY@TN nanoparticles. The Gibbs free energy change for physisorption is between −20 and 0 kJ mol
−1 while for chemisorption it is in a range of −80 to 400 kJ mol
−1.
23,31 The values of Δ
G° obtained for present system are within the ranges of the physisorption mechanism. Further, the values of Δ
G° became more negative with raise in temperature, suggesting that the adsorption is more favorable at higher temperatures. Positive value (+1.46 kJ mol
−1) of Δ
H° suggested the endothermic nature of removal process which indicates that higher removal can be achieved at elevated temperature. Determination of Δ
S° is helpful for describing the randomness at the solid/solution interface during the adsorption process. Further, positive value (+1491 J mol
−1 K
−1) of Δ
S° showed increased randomness at the solid/solution interface during the adsorption of dyes onto nanoparticles. The positive value of Δ
S° for the TZ adsorption suggested higher degree of freedom of the TZ molecules with the increase of the solution temperature.
Sticking probability (S*) and activation energy were also calculated by using modified Arrhenius type equation:24
The S* is a function of the adsorbate/adsorbent system which is dependent on the temperature of the system and the value of S* lies in the range 0 < S* < 1. Ea is activation energy and calculated from the slope of the plot of ln(1 − θ) versus 1/T. The value of θ can be calculated from the following equation:
| |  | (16) |
The value of activation energy gives an idea about the nature of adsorption process. In case of involvement of physical adsorption, activation energy lies in the range of 5–40 kJ mol−1 while for chemical adsorption, the values vary from 40–800 kJ mol−1. The value of Ea for present system was found to be 26.97 kJ mol−1 suggesting that physisorption is the predominant mechanism which is involved in TZ adsorption. Value of sticking probability was determined to be 2.3 × 10⁻⁴.
6. Isotherm modelling
Equilibrium adsorption isotherm represents the relation between concentration of adsorbate in the liquid phase and on the adsorbent surface. Adsorption isotherm is also helpful to describe interaction between adsorbent surface/adsorbate species and determine the maximum adsorption capacity.32 For obtaining equilibrium data, experiments were carried out with different dye concentrations (100 to 200 mg L−1) at different temperatures. Several isotherm models viz. Langmuir, Freundlich, Redlich–Peterson, Dubinin–Radushkevich and Sips isotherm model were applied on the equilibrium data.
6.1. Langmuir isotherm model
According to Langmuir isotherm, adsorption takes place at specific sites on the adsorbent surface and the adsorption energy is homogeneously distributed on the adsorbent surface.33 Molecular interaction is not possible between adsorbed molecular species. The Langmuir isotherm can be expressed as follows:| |  | (17) |
where qm (mg g−1) is the maximum adsorption capacity of PPy@TN nanoparticles and b is the Langmuir constant (L mg−1). Ce (mg L−1) and qe (mg g−1) are the equilibrium concentration of dye and adsorption capacity of nanoparticles at equilibrium respectively.
6.2. Freundlich isotherm model
Freundlich isotherm assumes heterogeneous distribution of active sites and also supports for multilayer adsorption.34 According to Freundlich isotherm interactions are possible between adsorbed molecules. The Freundlich isotherm model is represented by following equation:| |  | (18) |
where Kf (mg g−1 (L mg−1)1/n) and 1/n are Freundlich constants related with adsorption capacity and the heterogeneity factor. Value of 1/n gives an idea about the type of isotherm to be irreversible (1/n = 0), favorable (0 < 1/n < 1) and unfavorable (1/n > 1).
6.3. Dubinin and Radushkevich isotherm model
Dubinin and Radushkevich isotherm is helpful in the determination of adsorption energy and30 can be expressed as follows:35| | qe = qm![[thin space (1/6-em)]](https://www.rsc.org/images/entities/char_2009.gif) exp(−βε2) exp(−βε2) | (19) |
| |  | (20) |
| |  | (21) |
where qm is the maximum adsorption capacity (mg g−1); R is the gas constant (8.314 J mol−1 K−1); T is the absolute temperature and constant β (mol2 kJ−2) gives the mean free energy. ε is the Polanyi potential and E is related to the mean free energy of the adsorption per mole of the adsorbate (kJ mol−1).
6.4. Sips isotherm
The Sips isotherm is a combination of Langmuir and Freundlich isotherm and can be expressed as follows:| |  | (22) |
where qm is the Sips maximum adsorption capacity (mg g−1), KS is the Sips equilibrium constant (L mg−1), and mS is the Sips model exponent. In case of low adsorbate concentrations, it reduces to Freundlich isotherm while for high adsorbate concentrations, it behaves like Langmuir isotherm.36
6.5. Redlich–Peterson isotherm
The Redlich–Peterson isotherm can be applied for both homogeneous and heterogeneous systems.37 The Redlich–Peterson isotherm can be represented by the following equation:| |  | (23) |
where kRP and aRP are the Redlich–Peterson constants (L g−1) and (L mg−1) and β an exponent that lies between 0 and 1. The isotherm parameters were determined by nonlinear regression, using the Microsoft excel solver 2010. The coefficient of determination R2 helps in the determination of best fit isotherm model which was calculated from the following equation:38| |  | (24) |
where qe is the equilibrium adsorption capacity determined by experiments, qm is the isotherm predicted equilibrium adsorption capacity. The nonlinear isotherm plots for different isotherms are shown in Fig. 12a–d and the parameters calculated for different isotherm models are summarized in Table 2. χ2 value was determined for different isotherms to predict best model among all studied isotherms by using following equation.25| |  | (25) |
where qe,exp and qe,cal are the equilibrium capacity calculated from experiments and calculated by isotherm model respectively. On comparing R2 and χ2 values for all isotherms, Redlich–Peterson (R–P) isotherm was found to be best fit isotherm model for describing TZ adsorption on PPy@TN nanoparticles.
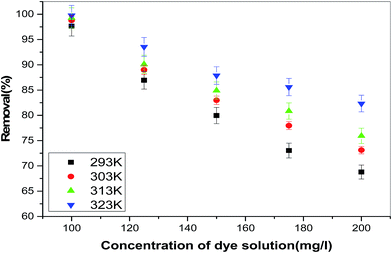 |
| | Fig. 11 Effect of temperature on removal of TZ from synthetic wastewater. | |
7. Comparative study
Comparative study for the removal efficiency of polypyrrole coated nanoparticles with other available adsorbent materials for tartrazine was also carried out. Adsorption capacity of bottom ash and de-oiled ash for tartrazine dye was determined to be 2.358 × 10⁻⁵ and 4.608 × 10⁻⁵ mol g−1 respectively.10 In another study, hen feather was used as an adsorbent material for the removal of tartrazine and its adsorption capacity was observed to be 0.00014 (mol g−1).6 Banerjee and Chattopadhyaya (2013) investigated efficiency of saw dust for tartrazine dye.39 Langmuir adsorption capacity of saw dust was determined to be 4.71 mg g−1. Further carbon nanotubes decorated with silver nanoparticles were synthesized for tartrazine removal and it was found very efficient for the tartrazine adsorption (85.09 mg g−1).9 Adsorption capacity of commercial activated carbon (CAC), coconut shell activated carbon (CSAC) and Lantana carbon was reported to be 4.484, 2.257 and 90.9 mg g−1 respectively.40,41 In another study polyaniline nanolayer composite was synthesized by Ansari et al.42 Adsorption capacity of polyaniline nanolayer composite was found to be 2.47 mg g−1. It is clear from comparative study that the adsorption capacity of synthesized polypyrrole coated tenorite nanoparticle (42.50 mg g−1) is quite comparable with the other available adsorbent materials.
8. Metal removal from synthetic wastewater
In the present study, tartrazine dye loaded adsorbent (TZ-PPy@TN) was used as an adsorbent material for the removal of Co(II), Mn(II), Pb(II), Cd(II) and Zn(II) metals from single and multisolute system.
Tartrazine dye loaded on nanoparticles acts as modifying agent which makes nanoparticles surface suitable for metal adsorption.43 Adsorption capacity of TZ loaded nanoparticles (TZ-PPy@TN) for different metals is shown in Fig. 13. It can be observed in Fig. 13 that a wide range of metal concentrations can be efficiently treated with TZ loaded nanoparticles. Following trend was observed in the single solute system.
| Co(II) < Mn(II) < Pb(II)< Cd(II) < Zn(II) |
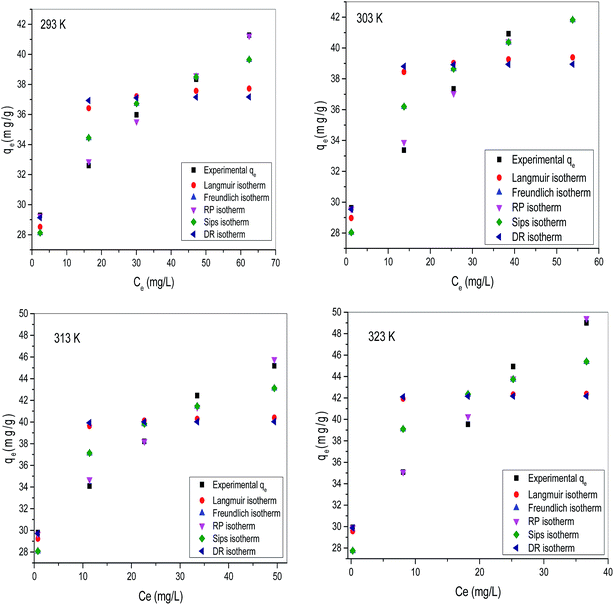 |
| | Fig. 12 Nonlinear isotherm plot for the adsorption of tartrazine on nanoparticles (a) 293 K; (b) 303 K; (c) 313 K; (d) 323 K. | |
A similar trend was also observed in case of multi-solute metal solution of these metallic species. Adsorption of different metallic species depends on different factors viz. speciation of metallic species, degree of ionization etc. Detailed study is recommended for complete illustration of metal-TZ loaded nanoparticle interaction.
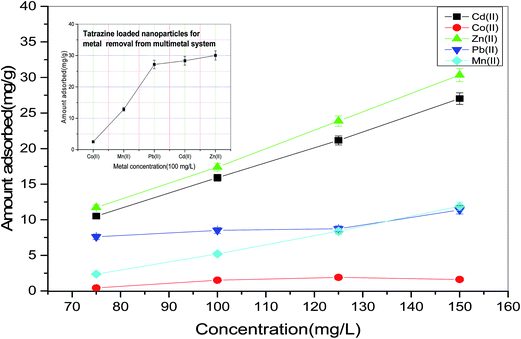 |
| | Fig. 13 Removal of metals from single solute and multisolute synthetic wastewater. | |
9. Conclusions
Following conclusions may be drawn from the present study.
(i) Polypyrrole coated tenorite nanoparticles with 30 nm diameter and 425 m2 g−1 BET surface area were successfully synthesized.
(ii) TEM images showed the formation of brick like structure in polypyrrole coated tenorite nanoparticles.
(iii) Synthesized nanoparticles were found to be very efficient for the removal of dye in all the selected concentration ranges.
(iv) pH study reveals that maximum removal can be achieved at 2.0 pH as adsorbent surface supports dye anion adsorption due to positively charged surface in acidic medium.
(v) Dye removal increased on increasing the temperature, which shows endothermic nature of the removal process.
(vi) The negative value of ΔG° at all temperatures suggest the feasibility of tartrazine adsorption on polypyrrole coated tenorite nanoparticles.
(vii) Dye loaded nanoparticles were used as an efficient adsorbent for different metallic species from the single and multisolute system.
Present study indicates the versatile nature of the polypyrrole coated tenorite nanoparticles because it was found to be efficient for tartrazine dye as well as for metallic species which make it a strong candidate for the treatment of dye laden and metal bearing wastewater.
Acknowledgements
The authors are thankful to the Regional Council of South-Savo and the City of Mikkeli for funding and Mikkeli University of Applied Sciences for providing SEM analysis of samples.
References
- A. Rodríguez, J. García, G. Ovejero and M. Mestanza, J. Hazard. Mater., 2009, 172, 1311–1320 CrossRef PubMed.
- E. T. Acar, S. Ortaboy and G. Atun, Chem. Eng. J., 2015, 276, 340–348 CrossRef CAS.
- S. J. Allen, G. Mckay and J. F. Porter, J. Colloid Interface Sci., 2004, 280, 322–333 CrossRef CAS PubMed.
- A. González, M. E. Villanueva, L. L. Piehl and G. J. Copello, Chem. Eng. J., 2015, 280, 41–48 CrossRef.
- G. L. Dotto, J. M. Moura, T. R. S. Cadaval and L. A. A. Pinto, Chem. Eng. J., 2013, 214, 8 CrossRef CAS.
- A. Mittal, L. Kurup and J. Mittal, J. Hazard. Mater., 2007, 146(1–2), 243 CrossRef CAS PubMed.
- C. Klett, A. Barry, I. Balti, P. Lelli, F. Schoenstein and N. Jouini, J. Environ. Chem. Eng., 2014, 2, 914–926 CrossRef CAS.
- M. Wawrzkiewicz and Z. Hubicki, J. Hazard. Mater., 2009, 164(2–3), 502 CrossRef CAS PubMed.
- J. Goscianska and R. Pietrzak, Catal. Today, 2015, 249, 259–264 CrossRef CAS.
- A. Mittal, J. Mittal and L. Kurup, J. Hazard. Mater., 2006, 136(3), 567 CrossRef CAS PubMed.
- W. Brostow, H. E. Hagg Lobland, S. Pal and R. P. Singh, J. Mater. Educ., 2009, 31, 157 CAS.
- Á. Sánchez-Sánchez, F. Suárez-García, A. Martínez-Alonso and J. M. D. Tascón, J. Colloid Interface Sci., 2015, 450, 91–100 CrossRef PubMed.
- H. Mittal, A. Maity and S. S. Ray, Int. J. Biol. Macromol., 2015, 79, 8 CrossRef CAS PubMed.
- G. Akkaya Sayğılı, J. Mol. Liq., 2015, 211, 515–526 CrossRef.
- D. A. Giannakoudakis, G. Z. Kyzas, A. Avranas and N. K. Lazaridis, J. Mol. Liq., 2015 DOI:10.1016/j.molliq.2015.07.010.
- F. Motahari, M. R. Mozdianfard and M. Salavati-Niasari, Process Saf. Environ. Prot., 2015, 93, 282 CrossRef CAS.
- L. Lian, X. Cao, Y. Wu, D. Lou and D. Han, J. Taiwan Inst. Chem. Eng., 2013, 44(1), 67 CrossRef CAS.
- S. Mohammadi and G. Khayatian, Spectrochim. Acta, Part A, 2015, 148, 405 CrossRef CAS PubMed.
- S. Dadfarnia, A. M. Haji Shabani, S. E. Moradi and S. Emami, Appl. Surf. Sci., 2015, 330, 85 CrossRef CAS.
- E. Tahmasebi, Y. Yamini, S. Seidi and M. Rezazadeh, J. Chromatogr. A, 2013, 1314, 15–23 CrossRef CAS PubMed.
- M. B. Gholivand, Y. Yamini, M. Dayeni, S. Seidi and E. Tahmasebi, J. Environ. Chem. Eng., 2015, 3(1), 529 CrossRef CAS.
- S. Yadav, V. Srivastava, S. Banerjee, C. H. Weng and Y. C. Sharma, Catena, 2013, 100, 120 CrossRef CAS.
- N. M. Mahmoodi, B. Hayati, M. Arami and H. Bahrami, Desalination, 2011, 275(1–3), 93 CrossRef CAS.
- T. G. Venkatesha, Y. A. Nayaka and B. K. Chethana, Appl. Surf. Sci., 2013, 276, 620 CrossRef CAS.
- V. Srivastava, Y. C. Sharma and M. Sillanpää, Appl. Surf. Sci., 2015, 338, 42 CrossRef CAS.
- W. J. Weber and J. C. Morris, J. Sanit. Eng. Div., Am. Soc. Civ. Eng., 1963, 89, 31 Search PubMed.
- G. E. Boyd, A. W. Adamson and L. S. Myers, J. Am. Chem. Soc., 1947, 69, 2836–2848 CrossRef CAS PubMed.
- D. H. Bangham and F. P. Burt, Proc. R. Soc. London, Ser. A, 1924, 105, 481–488 CrossRef CAS.
- V. S. Mane, I. Deo Mall and V. Chandra Srivastava, J. Environ. Manage., 2007, 84(4), 390 CrossRef CAS PubMed.
- M. Ghaedi, B. Sadeghian, A. A. Pebdani, R. Sahraei, A. Daneshfar and C. Duran, Chem. Eng. J., 2012, 187, 133 CrossRef CAS.
- S. Zeng, S. Duan, R. Tang, L. Li, C. Liu and D. Sun, Chem. Eng. J., 2014, 258, 218 CrossRef CAS.
- R. Chen, W. Wang, X. Zhao, Y. Zhang, S. Wu and F. Li, Chem. Eng. J., 2014, 242, 226 CrossRef CAS.
- I. Langmuir, J. Am. Chem. Soc., 1916, 38, 2221–2295 CrossRef CAS.
- H. M. F. Freundlich, J. Phys. Chem., 1906, 57, 385–471 CAS.
- M. M. Dubinin and L. V. Radushkevich, Proc. Acad. Sci. USSR, Phys. Chem. Sect., 1947, 55, 331–337 Search PubMed.
- T. Madrakian, A. Afkhami and M. Ahmadi, Spectrochim. Acta, Part A, 2012, 99, 102 CrossRef CAS PubMed.
- O. Redlich and D. L. Peterson, J. Phys. Chem., 1959, 63(6), 1024 CrossRef CAS.
- Y. S. Ho, Pol. J. Environ. Stud., 2006, 15(1), 81 CAS.
- S. Banerjee and M. C. Chattopadhyaya, Arabian J. Chem., 2013 DOI:10.1016/j.arabjc.2013.06.005.
- M. Jibril, J. Noraini, L. S. Poh and A. M. Evuti, Jurnal Teknologi, 2013, 60, 15 Search PubMed.
- R. K. Gautam, P. K. Gautam, S. Banerjee, V. Rawat, S. Soni, S. K. Sharma and M. C. Chattopadhyaya, J. Environ. Chem. Eng., 2015, 3(1), 79 CrossRef CAS.
- R. Ansari, M. B. Keivani and A. F. Delavar, J. Polym. Res., 2011, 18(6), 1931 CrossRef CAS.
- L. Monser and N. Adhoum, J. Hazard. Mater., 2009, 161(1), 263 CrossRef CAS PubMed.
Footnote |
| † Electronic supplementary information (ESI) available. See DOI: 10.1039/c5ra14108g |
|
| This journal is © The Royal Society of Chemistry 2015 |
Click here to see how this site uses Cookies. View our privacy policy here.  Open Access Article


![[thin space (1/6-em)]](https://www.rsc.org/images/entities/char_2009.gif) t (Fig. 10c). The values of α and k0 are given in Table 2. The plot was found to be linear for all selected concentration ranges with good correlation coefficient (>0.9) indicating pore diffusion is the only rate controlling step.
t (Fig. 10c). The values of α and k0 are given in Table 2. The plot was found to be linear for all selected concentration ranges with good correlation coefficient (>0.9) indicating pore diffusion is the only rate controlling step.
![[thin space (1/6-em)]](https://www.rsc.org/images/entities/char_2009.gif)
![[thin space (1/6-em)]](https://www.rsc.org/images/entities/char_2009.gif)
![[thin space (1/6-em)]](https://www.rsc.org/images/entities/char_2009.gif)
![[thin space (1/6-em)]](https://www.rsc.org/images/entities/char_2009.gif)
![[thin space (1/6-em)]](https://www.rsc.org/images/entities/char_2009.gif) ln
ln![[thin space (1/6-em)]](https://www.rsc.org/images/entities/char_2009.gif) kc
kc


![[thin space (1/6-em)]](https://www.rsc.org/images/entities/char_2009.gif) exp(−βε2)
exp(−βε2)


