Electrochemical reduction of carbon dioxide to formate with a Sn cathode and an IrxSnyRuzO2/Ti anode
Rui Zhanga,
Weixin Lvb,
Guanghua Lia,
Mohammed Adnan Mezaala and
Lixu Lei *a
*a
aSchool of Chemistry and Chemical Engineering, Southeast University, Nanjing 211189, P. R. China. E-mail: lixu.lei@seu.edu.cn; Tel: +86-25-5209-0620-6421
bSchool of Chemistry and Chemical Engineering, Yancheng Institute of Technology, Yancheng 224051, P. R. China
First published on 6th August 2015
Abstract
The electrochemical reduction of CO2 to formate has been studied extensively, and most studies have focused on the faradaic efficiency for producing formate. However, the energy efficiency is also critical for the possible industrialization of the process, as it specifies the energy recovered in the product. Here, we report that the energy efficiency is 35.6% when a Pt electrode is used as the anode, and it can increase to 42.1% when an IrxSnyRuzO2/Ti electrode with lower overpotential for oxygen evolution reaction is used as the anode, in spite of their faradaic efficiencies for producing formate are very close (85.1% and 84.8%). When the IrxSnyRuzO2/Ti electrode coated with Nafion membrane is used as the anode, the faradaic efficiency can maintain at 79.6% through a long time electrolysis of CO2 for 500 C.
Introduction
In the past decades, a significant increase in CO2 emissions has occurred due to the industrial combustion of fossil fuels.1 To reduce our dependence on the fossil fuel, renewable energy sources, such as solar and wind energies, are growing up rapidly. These renewable energies are difficult to be merged into the electricity grid due to their intermittent nature, therefore, their further expansion is highly limited by the availability of efficient energy storage and conversion techniques.2 Electrochemical reduction of CO2 to fuels and chemical feedstocks, powered by renewable electricity,3,4 is an attractive route for simultaneous elimination of CO2 and storage of renewable energy.5,6Fig. 1 shows the evolution of publications on electrochemical reduction of CO2 since the year of 1980 (sources: Web of science, Thomson Reuters). Over the past few years and especially from the year of 2009, the research on electrochemical reduction of CO2 has received much attention. To date, various products have been prepared by this way, including formic acid, carbon monoxide, methanol, ethanol and oxalic acid, etc.7–16 Among them, formic acid or formate (depending on pH) is very attractive because it is a liquid of easy treatment and can be produced in high faradaic efficiency (typically >80%).12,17–19 It is also a fundamental chemical which is widely used in the textile, tanning, rubber processing and pharmaceutical industries.20 Formic acid could also function as an energy material, as it can be used in direct formic acid fuel cell to produce electricity.21,22
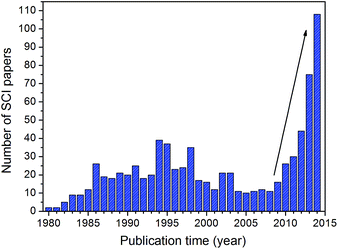 | ||
| Fig. 1 Numbers of publications dedicated to the research of electrochemical reduction of CO2 since the year of 1980. | ||
However, to employ the electrochemical reduction of CO2 as an energy reservoir, the energy efficiency of the process must be examined. To increase the energy efficiency, it has to decrease the overpotential on each electrode.23 To date, only a few researchers focus on the research of the energy efficiency for electrochemical reduction of CO2 to formate. Whipple et al. designed a microfluidic reactor with a continuous flowing electrolyte for electrochemical reduction of CO2, it can achieve a faradaic efficiency of ∼90% and an energy efficiency of 45% for formate production on Sn based gas diffusion electrode by using 0.5 mol L−1 KCl aqueous solution (pH = 4) as the electrolyte.24 Hori reported that the energy efficiency of electrochemical reduction of CO2 to useful products would be roughly 30–40% under mild conditions.25
Our previous work found that the faradaic efficiency for producing formate can reach 91% when the accumulated concentration of formate in electrolyte is less than 0.01 mol L−1;26 but it does not involve a study of energy efficiency. In this paper, we concern the energy efficiency of the reaction. In this process, the reduction reaction of CO2 occurs on the cathode and the oxidation reaction of H2O occurs on the anode.27
Most researchers used Pt as the anode in the research of electrochemical reduction of CO2, whereas the Pt electrode has high overpotential for oxygen evolution reaction (OER).28 A lot of studies have shown that the most efficient electrocatalysts for OER are noble metals and their oxides. The oxides are more stable than pure metals because they cannot be further oxidized. Ruthenium oxide (RuO2) is the most active catalyst but its activity is not sufficient for long-term utilization due to the increase of ruthenium oxidation state.29 Conversely, iridium oxide (IrO2) is stable and has also interesting catalytic properties for OER.28 Out of these, SnO2 can also be used as a catalyst for OER.30,31 In this paper, we utilized an IrxSnyRuzO2/Ti anode to oxidize water. The study about using IrxSnyRuzO2/Ti electrode as anode in electrochemical reduction of CO2 has not reported before.
Experimental
Chemicals and materials
Potassium bicarbonate (≥99.5%) was purchased from Sinopharm Chemical Reagent Co, Ltd (China). Highly pure nitrogen (≥99.99%) and carbon dioxide (≥99.99%) were supplied by Nanjing Spring Industrial Gas Plant (China). Tin plate (99.99%, 0.5 mm thickness) and Pt plate (99.99%) were purchased commercially. IrxSnyRuzO2/Ti plate was purchased from Baoji Yichen Co. (China).Electrochemical experiments
All the electrochemical experiments were carried out in an airtight and undivided glass cell equipped with a gas inlet and outlet which is able to pass the gas through the solution. A conventional three-electrode system was used during the experiments. The cathode was a Sn plate. A Pt plate (2 cm2) or an IrxSnyRuzO2/Ti plate (2 cm2) was chosen as the anode and an Ag/AgCl electrode in saturated KCl was used as the reference electrode. All experiments were performed under ambient pressure and at room temperature (25 ± 2.5 °C).All the electrochemical measurements were performed with a CS350 electrochemical workstation (Wuhan CorrTest Instrument Co., Ltd., China). Cyclic voltammetry (CV) were performed in 40 mL of 0.1 mol L−1 KHCO3 solution at a scan rate of 0.05 V s−1. To reveal the true energy input required for this process, the CV was recorded in two-electrode mode (Sn cathode, Pt or IrxSnyRuzO2/Ti anode), which was denoted as Sn–Pt or Sn–IrxSnyRuzO2/Ti. The current density (j) is determined on the geometrical area of the electrode.
Electrolysis was performed potentiostatically by holding the cathode potential at −1.8 V vs. Ag/AgCl using a LAND CT2001C cell performance-testing instrument (Wuhan Electronics Co., Ltd., China). The electrolyte used was 40 mL of 0.1 mol L−1 KHCO3 aqueous solution, and was saturated with CO2 before each electrolysis process. CO2 gas was continuously aerated at a flow rate of 10 mL min−1 during the electrolysis process. The electrolysis experiments were terminated when the total charge passed reached 50 C.
Analysis and calculations
Scanning electron microscope (SEM) images were taken with a Hitachi S-4800 microscope at an acceleration voltage of 15 kV. X-ray diffraction pattern (XRD) was recorded on a Rigaku D/MAX 2200 diffractometer using Cu Kα radiation (λ = 1.54056 Å), scan range from 20 to 80° at a scan rate of 0.12° s−1.Formate produced in the electrolyte during the electrolysis was directly analyzed by ion chromatography (ICS-900 Dionex). The column was an IonPac AS11-HC anionic column using 0.02 mol L−1 KOH as the mobile phase at the rate of 1 mL min−1. 10 μL of the electrolyte were used for each time.
The faradaic efficiency for the formation of formate (f) is calculated as follows:
| f = 2nF/Q | (1) |
![[thin space (1/6-em)]](https://www.rsc.org/images/entities/char_2009.gif) 485 C mol−1 of electrons); and Q is the total charge in Coulomb passed across the electrode during the electrolysis.
485 C mol−1 of electrons); and Q is the total charge in Coulomb passed across the electrode during the electrolysis.
The energy efficiency is a key factor in determining the economic feasibility of converting CO2 to fuels by utilizing electricity.32 The energy efficiency for electrochemical reduction of CO2 to formate is calculated as follows:
| Energy efficiency = E°f/applied cell potential | (2) |
Results and discussion
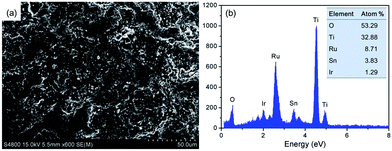
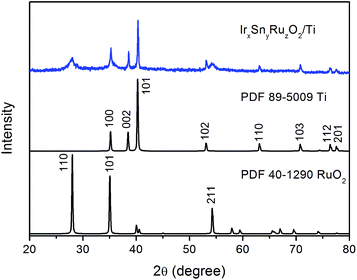
Fig. 2 shows the SEM image and the EDS spectrum of the IrxSnyRuzO2/Ti electrode. It can be seen that the surface of the IrxSnyRuzO2/Ti electrode is coarse, since the electrode base is Ti plate and covered by the oxides of Ru, Sn and Ir. From the EDS spectrum, it can be seen that the atomic percents of Ru, Sn and Ir are 8.71%, 3.83% and 1.29%, respectively.Structural characterization of the IrxSnyRuzO2/Ti electrode was performed by XRD analysis, which is shown in Fig. 3. It shows the (100), (002), (101), (102), (110), (103), (112) and (201) diffraction peaks of Ti together with the (110), (101), and (211) peaks of RuO2. No diffraction peaks for SnO2 and IrO2 can be observed because of the low contents of SnO2 and IrO2 in the surface of IrxSnyRuzO2/Ti electrode.
The anode reaction for electrochemical reduction of CO2 is OER, which is shown in eqn (3):
| 2H2O = O2 + 4H+ + 4e− | (3) |
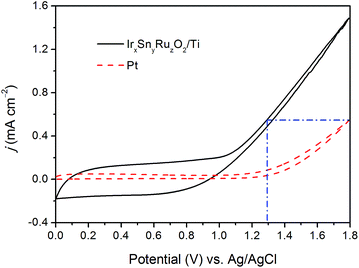
The electrochemical activities of the Pt electrode and the IrxSnyRuzO2/Ti electrode towards OER were studied using CV technique. It can be seen from Fig. 4 that the Pt electrode shows poor catalytic activity for OER compared with the IrxSnyRuzO2/Ti electrode. The IrxSnyRuzO2/Ti electrode produces nearly rectangular curves when the potential sweep range is from 0 to 1.0 V vs. Ag/AgCl, indicating that the IrxSnyRuzO2/Ti electrode has capacitive behavior. The oxidation current density of the OER on Pt electrode at 1.8 V vs. Ag/AgCl is 0.55 mA cm−2. At the same current density, the potential of IrxSnyRuzO2/Ti electrode is around 1.3 V vs. Ag/AgCl.
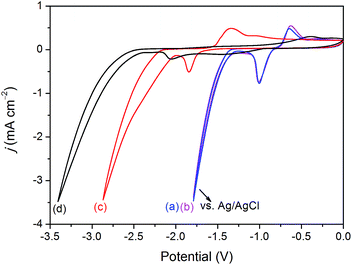
Following our previous work,26 the electrochemical reduction of CO2 was carried out at the found optimal electrolysis conditions, that is, the electrolysis potential was −1.8 V vs. Ag/AgCl and the concentration of the KHCO3 aqueous electrolyte was 0.1 mol L−1. To calculate the energy efficiency, the value of applied cell potential is needed. So our work must investigate the appropriate applied cell potential between the cathode and the anode without reference electrode. The study of CV was carried out for this purpose, the working electrode is the Sn plate, and the counter electrode is the Pt electrode or the IrxSnyRuzO2/Ti electrode, the reference electrode is the Ag/AgCl electrode. Firstly, we compared the CV curves shown in Fig. 5 when the anode was the Pt electrode or the IrxSnyRuzO2/Ti electrode, and found that curve (a) is nearly the same with curve (b), the current density at −1.8 V vs. Ag/AgCl is around 3.5 mA cm−2. Secondly, curves (c) and (d) are recorded in two-electrode mode (without reference electrode) for obtaining the true energy input required for this process, the terminal cell potentials of curves (c) and (d) stop at the same current density (3.5 mA cm−2), and the values are 3.42 V and 2.88 V at 3.5 mA cm−2 as the anodes are Pt electrode and the IrxSnyRuzO2/Ti electrode, respectively. It indicates that the applied cell potential is lower when the anode is the IrxSnyRuzO2/Ti electrode. A pair of redox peaks is observed for all the CV curves which can be attributed to the formation and the reduction of tin oxides respectively.26
Fig. 6 is the current density curves for electrochemical reduction of CO2 on Sn cathode at different cell potentials when the Pt electrode or the IrxSnyRuzO2/Ti electrode is used as the anode. Several adjacent cell potentials are selected in this experiment, the cell potential range is from 3.02 to 3.62 V for the Pt anode, and is from 2.48 to 3.08 V for the IrxSnyRuzO2/Ti anode. For the Pt anode and the IrxSnyRuzO2/Ti anode, each cell potential for the former is 0.54 V higher than that for the latter, and their current densities are nearly the same.
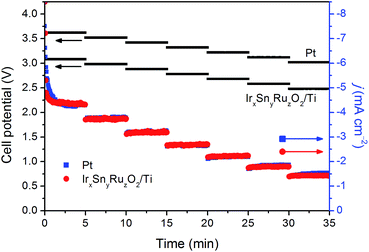 | ||
| Fig. 6 Current densities at different cell potentials when use the Pt electrode or the IrxSnyRuzO2/Ti electrode as anode during the electrochemical reduction of CO2 in 0.1 mol L−1 KHCO3 solution. | ||
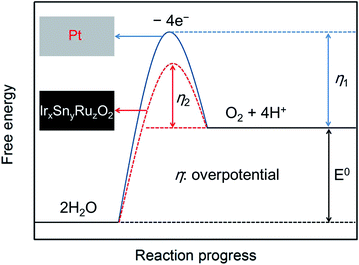
In this work, we hope to use an activated anode to lower the overpotential for OER. It can be seen from the CV measurements (Fig. 4 and 5) that, the IrxSnyRuzO2/Ti electrode shows excellent catalytic activity for OER than the Pt electrode, which may improve the energy efficiency of the whole reaction for electrochemical reduction of CO2. Fig. 7 is the qualitative reaction scheme for OER on the Pt anode or the IrxSnyRuzO2/Ti anode from the above experiments. The overpotential for OER on Pt electrode (η1) is obviously higher than that on IrxSnyRuzO2/Ti electrode (η2). From the analysis results of Fig. 5 and 6, it can be obtained that the value of (η1 − η2) is 0.54 V.
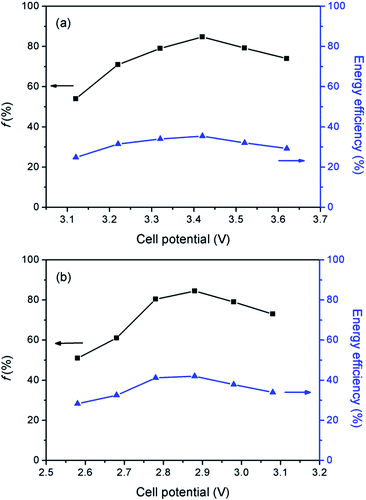
Low overpotential is helpful for increasing the energy efficiency for electrochemical reduction of CO2. The energy efficiency is a key factor in determining the economic feasibility of converting CO2 to fuels by utilizing electricity. The energy efficiency for producing formate was calculated using eqn (2), as shown in Fig. 7 where the apparent standard electromotive force of the cell, E° is −1.43 V,24 as predicted by Nernst equation. For evaluating the energy efficiency, the electrolysis experiments were carried out at different applied cell potentials.
In our previous work, the optimal potential for electrochemical reduction of CO2 was −1.8 V vs. Ag/AgCl. The corresponding applied cell potentials of Sn–Pt and Sn–IrxSnyRuzO2/Ti are 3.42 V and 2.88 V, respectively. Several adjacent cell potentials are selected in this experiment to confirm an optimal electrolysis condition, it can be seen from Fig. 8 that the highest faradaic efficiency for Sn–Pt is 85.1% obtained at 3.42 V (Fig. 8a), and that for Sn–IrxSnyRuzO2/Ti is 84.8% obtained at 2.88 V (Fig. 8b). Although their faradaic efficiencies are very close, the energy efficiency of the Sn–IrxSnyRuzO2/Ti (42.1%) is higher than that of the Sn–Pt (35.6%) because of the lower overpotential for OER on the IrxSnyRuzO2/Ti electrode. It's worth mentioning that the IrxSnyRuzO2/Ti electrode can not only be used for producing formate, but also can be used for producing other products (such as CO, methanol or hydrocarbons) with less energy input.
For evaluate the stability of the IrxSnyRuzO2/Ti electrode, a long time electrolysis experiment is required. In this experiment, the products of formate will be re-oxidization on the anode if the concentration of formate is high. In order to avoid the formate oxidation on the anode, H-type cell divided by a Nafion membrane was used by some researchers. Whereas, the H-type cell may not be a good choice in this experiment. Narayanan et al. used In and Pb powders as the catalysts for electrochemical reduction of CO2 to formate in a H-type cell. They found that the faradaic efficiency for producing formate in 1 mol L−1 NaHCO3 solution was as high as 80% after 300 s; however, the faradaic efficiency began to decline over a period of 1 h. They thought that the decrease of the faradaic efficiency during continuous operation was a result of the buildup of diffusion barriers resulting in the reduced availability of CO2 for reduction at the surface of the electrode.33 We have found another effective method for retarding the oxidation of formate in our previous work, that is coating a Nafion membrane on the anode.18
In this paper, we also performed long time electrolysis experiment using IrxSnyRuzO2/Ti electrode coated with Nafion membrane as the anode which is prepared by immersing the electrode into 5 wt% Nafion solution. As shown in Fig. 9, the faradaic efficiency decreases from 85.3% to 79.6% as the charge passed increases from 50 to 500 C. However, when a naked IrxSnyRuzO2/Ti electrode is used as the anode, the faradaic efficiency decreases significantly from 84.8% to 29.3% as the charge passed increases from 50 to 500 C (Fig. 9).
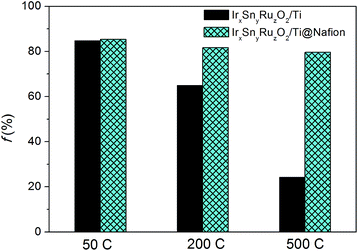 | ||
| Fig. 9 Variations in faradaic efficiency for producing formate with the charge passed when the anode is IrxSnyRuzO2/Ti or IrxSnyRuzO2/Ti@Nafion electrode. | ||
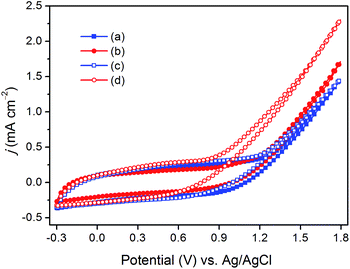
Curves (a) and (c) in Fig. 10 show the CV curves on the IrxSnyRuzO2/Ti electrodes with and without Nafion membrane in the KHCO3 electrolytes, respectively. It can be seen that the current density on the naked IrxSnyRuzO2/Ti electrode is nearly the same with that on the IrxSnyRuzO2/Ti electrode coated with Nafion membrane. Therefore, the Nafion coat has negligible effect on OER. Curves (b) and (d) in Fig. 10 show the CV curves on the IrxSnyRuzO2/Ti electrodes with and without Nafion membrane in KHCO3 electrolytes containing 0.05 mol L−1 potassium formate, respectively. The current density on IrxSnyRuzO2/Ti electrode coated with Nafion membrane is obviously lower than that on the naked IrxSnyRuzO2/Ti electrode if the electrolyte contains HCOO−. These results reveal that the Nafion membrane can effectively retard the oxidation of formate on IrxSnyRuzO2/Ti anode.
Conclusions
The IrxSnyRuzO2/Ti anode shows better catalytic activity for OER than the Pt anode. At the same current density of 3.5 mA cm−2, the applied cell potentials for Sn–IrxSnyRuzO2/Ti and Sn–Pt are 2.88 and 3.42 V, respectively. The electrode with excellent catalytic activity for OER used in electrochemical reduction of CO2 can increase the energy efficiency of the whole reaction. In this paper, the energy efficiency of the Sn–IrxSnyRuzO2/Ti (42.1%) is higher than that of the Sn–Pt (35.6%).When the IrxSnyRuzO2/Ti electrode coated with Nafion membrane is used as the anode, the faradaic efficiency decreases from 85.3% to 79.6% as the charge passed increases from 50 to 500 C; when a naked IrxSnyRuzO2/Ti electrode is used as the anode, the faradaic efficiency decreases to 24.3% as the charge passed increases to 500 C. It indicates that the Nafion membrane on IrxSnyRuzO2/Ti anode can effectively retard the oxidation of formate.
Acknowledgements
This work is supported by the Department of Science and Technology, Jiangsu Province (BY2013073-03), the Department of Education for the Fundamental Research Funds for the Central Universities, Jiangsu Province for the College graduate research and innovation projects (CXLX13_086).References
- T. R. Karl and K. E. Trenberth, Science, 2003, 302, 1719–1723 CrossRef CAS PubMed.
- X. Luo, J. H. Wang, M. Dooner and J. Clarke, Appl. Energy, 2015, 137, 511–536 CrossRef PubMed.
- D. F. Gao, H. Zhou, J. Wang, S. Miao, F. Yang, G. Wang, J. Wang and X. Bao, J. Am. Chem. Soc., 2015, 137, 4288–4291 CrossRef CAS PubMed.
- C. W. Machan, S. A. Chabolla, J. Yin, M. K. Gilson, F. A. Tezcan and C. P. Kubiak, J. Am. Chem. Soc., 2014, 136, 14598–14607 CrossRef CAS PubMed.
- C. H. Lee and M. W. Kanan, ACS Catal., 2014, 5, 465–469 CrossRef.
- R. Zhang, W. X. Lv, G. H. Li and L. X. Lei, Mater. Lett., 2015, 141, 63–66 CrossRef CAS PubMed.
- V. S. K. Yadav and M. K. Purkait, RSC Adv., 2015, 5, 40414–40421 RSC.
- E. Barton Cole, P. S. Lakkaraju, D. M. Rampulla, A. J. Morris, E. Abelev and A. B. Bocarsly, J. Am. Chem. Soc., 2010, 132, 11539–11551 CrossRef CAS PubMed.
- Y. Chen, C. W. Li and M. W. Kanan, J. Am. Chem. Soc., 2012, 134, 19969–19972 CrossRef CAS PubMed.
- R. Angamuthu, P. Byers, M. Lutz, A. L. Spek and E. Bouwman, Science, 2010, 327, 313–315 CrossRef CAS PubMed.
- X. Lu, D. Y. C. Leung, H. Wang, M. K. H. Leung and J. Xuan, ChemElectroChem, 2014, 1, 836–849 CrossRef CAS PubMed.
- Q. N. Wang, H. Dong, H. Yu and H. B. Yu, J. Power Sources, 2015, 279, 1–5 CrossRef CAS PubMed.
- Q. N. Wang, H. Dong and H. B. Yu, J. Power Sources, 2014, 271, 278–284 CrossRef CAS PubMed.
- H. Z. Zhao, Y. Zhang, Y. Y. Chang and Z. S. Li, J. Power Sources, 2012, 217, 59–64 CrossRef CAS PubMed.
- W. X. Lv, R. Zhang, P. R. Gao, C. X. Gong and L. X. Lei, J. Solid State Electrochem., 2013, 17, 2789–2794 CrossRef CAS.
- D. H. Chi, H. P. Yang, Y. F. Du, T. Lv, G. J. Sui, H. Wang and J. X. Lu, RSC Adv., 2014, 4, 37329–37332 RSC.
- G. K. S. Prakash, F. A. Viva and G. A. Olah, J. Power Sources, 2013, 223, 68–73 CrossRef CAS PubMed.
- R. Zhang, W. X. Lv, G. H. Li, M. A. Mezaal, X. J. Li and L. X. Lei, J. Power Sources, 2014, 272, 303–310 CrossRef CAS PubMed.
- S. Zhang, P. Kang and T. J. Meyer, J. Am. Chem. Soc., 2014, 136, 1734–1737 CrossRef CAS PubMed.
- H. Uslu, C. Bayat, S. Goekmen and Y. Yorulmaz, J. Chem. Eng. Data, 2009, 54, 48–53 CrossRef CAS.
- J. Yang, C. G. Tian, L. Wang and H. G. Fu, J. Mater. Chem., 2011, 21, 3384–3390 RSC.
- J. F. Chang, L. G. Feng, C. P. Liu, W. Xing and X. L. Hu, Angew. Chem., Int. Ed., 2014, 53, 122–126 CrossRef CAS PubMed.
- D. T. Whipple and P. J. A. Kenis, J. Phys. Chem. Lett., 2010, 1, 3451–3458 CrossRef CAS.
- D. T. Whipple, E. C. Finke and P. J. A. Kenis, Electrochem. Solid-State Lett., 2010, 13, B109–B111 CrossRef CAS PubMed.
- Y. Hori, Electrochemical CO2 Reduction on Metal Electrodes, Modern Aspects of Electrochemistry, Springer, 2008 Search PubMed.
- W. X. Lv, R. Zhang, P. R. Gao and L. X. Lei, J. Power Sources, 2014, 253, 276–281 CrossRef CAS PubMed.
- J. J. Wu, F. G. Risalvato, P. P. Sharma, P. J. Pellechia, F. S. Ke and X. D. Zhou, J. Electrochem. Soc., 2013, 160, F953–F957 CrossRef CAS PubMed.
- S. Y. Huang, P. Ganesan, H. Y. Jung and B. N. Popov, J. Power Sources, 2012, 198, 23–29 CrossRef CAS PubMed.
- T. Audichon, E. Mayousse, S. Morisset, C. Morais, C. Comminges, T. W. Napporn and K. B. Kokoh, Int. J. Hydrogen Energy, 2014, 39, 16785–16796 CrossRef CAS PubMed.
- S. Ferro, D. Rosestolato, C. A. Martínez-Huitle and A. De Battisti, Electrochim. Acta, 2014, 146, 257–261 CrossRef CAS PubMed.
- I. C. Gonçalves, W. T. P. dos Santos, D. V. Franco and L. M. Da Silva, Electrochim. Acta, 2014, 121, 1–14 CrossRef PubMed.
- B. A. Rosen, A. Salehi-Khojin, M. R. Thorson, W. Zhu, D. T. Whipple, P. J. A. Kenis and R. I. Masel, Science, 2011, 334, 643–644 CrossRef CAS PubMed.
- S. R. Narayanan, B. Haines, J. Soler and T. I. Valdez, J. Electrochem. Soc., 2011, 158, A167–A173 CrossRef CAS PubMed.
| This journal is © The Royal Society of Chemistry 2015 |

