
Amorphous PtNiP particle networks of different particle sizes for the electro-oxidation of hydrazine†
Yuanyuan Maa,
Hui Wanga,
Weizhong Lvb,
Shan Ji*b,
Bruno G. Polletc,
Shunxi Lia and
Rongfang Wang*a
aCollege of Chemistry and Chemical Engineering, Northwest Normal University, Lanzhou 730070, China. E-mail: wrf38745779@126.com; wangrf@nwnu.edu.cn; Fax: +86 931 7971533; Tel: +86 931 7971533
bCollege of Chemistry and Chemical Engineering, Shenzhen University, Shenzhen 518060, China. E-mail: sji@uwc.ac.za; Fax: +86 27 21 9599316; Tel: +86 27 21 9599316
cHySAFER, School of the Built Environment, University of Ulster, Shore Road, Newtownabbey, Co. Antrim, BT37 0QB, UK
First published on 7th August 2015
Abstract
The design of alloy networks is an important fundamental and applied research challenge in the area of catalysis due to the high surface area, gas permeability and electrical conductivity of alloy network structures. Herein amorphous PtNiP particle networks were prepared via the NaBH4 co-reduction process. Moreover, the reaction temperature control from 0 °C to 80 °C was shown to be a powerful tool for the ‘tuning’ of particle sizes. Electron microscopy, X-ray diffraction and selected area electron diffraction were used to show the morphology, the amorphous behavior and the changes in particle size of the particle networks. The results of the electrochemical performance showed that the amorphous PtNiP particle networks had better catalytic activity towards hydrazine oxidation compared to the Pt and PtNi networks. The electrocatalytic activity reached a peak value, 0.62 mA at −0.63 V, at a PtNiP-50 electrode. The correlation between the particle size of the amorphous PtNiP particle networks and their electrocatalytic activity for the hydrazine oxidation reaction provided the opportunity to develop highly active electrocatalysts for hydrazine fuel cells.
Introduction
As a member of the noble metals group (PGM – Platinum Group Metals), platinum (Pt) exhibits superior catalytic and electrical properties as well as outstanding corrosion resistance, which makes it an ideal candidate as an electrocatalyst for both anodic and cathodic electrochemical reactions in fuel cells and water electrolysers.1,2 However its high price and scarcity are major issues for the successful deployment of commercial fuel cell systems.3,4 Thus, many efforts have been devoted to the construction of functional Pt-based materials with designed shape, size, composition and geometrical configurations in view of achieving superior electrocatalytic properties and high precious-metal utilisations.5–7In comparison with solid and bulk counterparts, porous frameworks consisting of various functional metals can not only increase the active area but also provide efficient mass-transfer for reactant molecules, as well as improving electron mobility in the solid ligaments due to their unique geometrical configuration, low relative density, nanometer-scale fine pores etc.8–10 Thus, porous Pt-based ordered networks (or nanosponges) with narrow pore-size distributions are of particular interest for electrocatalytic applications. For instance, PtNi11 and PtCo12 particle networks synthesized by the use of surfactants have shown to exhibit good electrocatalytic activity towards methanol and formic acid oxidation reactions. Furthermore, the effect of the composition of porous PtNi and PtCo particle networks on their catalytic activities was also studied. Porous PtPd alloy nanosponges through template-free methods displayed superior electrocatalytic activity for ethanol oxidation reactions.13,14 However, to date no studies reported how a defined set of reaction conditions can be tuned to yield particle network-like structure with different particle sizes and the effect of the particle size on its electrochemical performance.
Amorphous alloys, a type of metastable materials with long-range disordered but short-range ordered structure are rich in low-coordination sites (terraces, steps, corner atoms) and defects in their structures.15,16 It is well-documented and well-known that the low-coordination sites play important roles in catalysis, such as various types of hydrogenation reactions.17,18 In the field of electrochemical catalysis, only limited number of the amorphous Pt-based electrocatalysts prepared by ball-milling has been reported.19,20 However, amorphous Pt-based particle networks synthesized by chemical methods have never been explored for electrocatalysis. For the first time, we present herein a method to prepare amorphous types of Pt-based particle networks and study their applications in electrocatalysis. Herein, we also report a temperature-controlled reduction reaction strategy by NaBH4 to prepare amorphous PtNiP particle networks of various particle sizes. For completeness, the effect of the particle size on the electrocatalytic activity for hydrazine oxidation was investigated.
Experimental
Synthesis
All reagents were of analytic grade (AR), and ultrapure water was used throughout the experiments. By extending our previous synthetic methods,21,22 the preparation of PtNiP alloy network was as follows: 200 mg of NiCl2·6H2O and 150 mg of NaH2PO2·H2O were dissolved in 30 mL of de-aerated ultrapure water (bubbled continuously with N2) at controlled temperatures of 0, 20, 50 and 80 °C (using a thermostatic bath). Then 2.2 mL of 20 mg mL−1 H2PtCl6·6H2O solution was rapidly added to the solution; stirring continued for another 0.5 h. Afterwards, 40 mL of 0.2 mol L−1 NaBH4 aqueous solution was added slowly into the mixture to react for 4 h. The resultants denoted as PtNiP-0, PtNiP-20, PtNiP-50, and PtNiP-80 were collected by filtration, washed with a 6 mol L−1 ammonia solution, then washed with ultrapure water several times and kept in an ethanol solution. It should be noted that PtNiP-0 was kept in an ethanol solution at 0 °C. For the synthesis of Pt and PtNi, the reaction conditions were similar to the preparation of PtNiP-20 but without the presence of Ni or P.Characterization
X-ray diffraction (XRD) patterns were recorded on a Shimadzu XD–3A (Japan) using filtered Cu-Kα radiation (λ = 0.15418 nm) generated at 40 kV and 30 mA. Scanning electron microscopy (SEM) images were obtained using a Carl Zeiss Ultra Plus. Transmission electron micrographs (TEM) and selected area electron diffraction (SAED) pattern of the catalysts were taken on a JEOL (JEM-2000 FX) microscope operating at 200 kV, which was coupled to the energy dispersive X-ray spectroscopy (EDS).The average chemical compositions of the catalysts were determined using an IRIS advantage inductively coupled plasma atomic emission spectroscopy (ICP-AES) system (Thermo, USA).
The specific surface area (SBET) was determined by Brunauer–Emmett–Teller (BET) method, and the pore size distribution was calculated by the density functional theory (DFT) method on Quantachrome Autosorb-1 volumetric analyzer. Before measurements were made, the samples were degassed at room temperature under vacuum for 24 h.
Electrochemical measurements
Electrochemical measurements were carried out using an electrochemical work station (CHI 650D, CH Instruments, Shanghai). A common three-electrode electrochemical cell was used for the measurements. The counter and reference electrodes were a platinum wire and an Ag/AgCl (3 mol L−1 KCl) electrode respectively. The working electrode was prepared on a 5 mm diameter glassy carbon disk, 2 mg of catalyst was dispersed ultrasonically in 0.4 mL Nafion/ethanol (0.25% Nafion) solution, and 8 μL of the above solution was pipetted and air dried on the glassy carbon surface. The electrode surface was electrochemically cleaned by repeatedly cycling the potential applied to the working electrode until a reproducible signal was obtained. All experiments were conducted at the laboratory temperature.Results and discussion
Fig. 1a and b show low and high SEM images of PtNiP-20 respectively. PtNiP-20 clearly comprises of a wide-ranging network-like structure of aligned nanoparticles, which is also visible using TEM (Fig. 1c). TEM images show that most particles have elliptical morphology of ca. 10 nm diameter (Fig. 1d). The EDS spectra as shown in the inset (Fig. 1c) indicates that Pt, Ni, and P elements are present in PtNiP-20. SAED patterns displayed in Fig. 1d indicates that the PtNiP-20 alloy is amorphous.23,24 Fig. 1e and f show the STEM images and the distribution profile of elements Pt, Ni and P in a typical region i.e. the red bar across Fig. 1e. Overall, the positions and widths of the peaks of the three elements match with each other, indicating that PtNiP-20 have uniform distribution of the three elements. Using ICP analyses, the atomic ratio of Pt![[thin space (1/6-em)]](https://www.rsc.org/images/entities/char_2009.gif) :Ni:P in the PtNiP-20 bulk is found to be 1:5.1:7.8.
:Ni:P in the PtNiP-20 bulk is found to be 1:5.1:7.8.
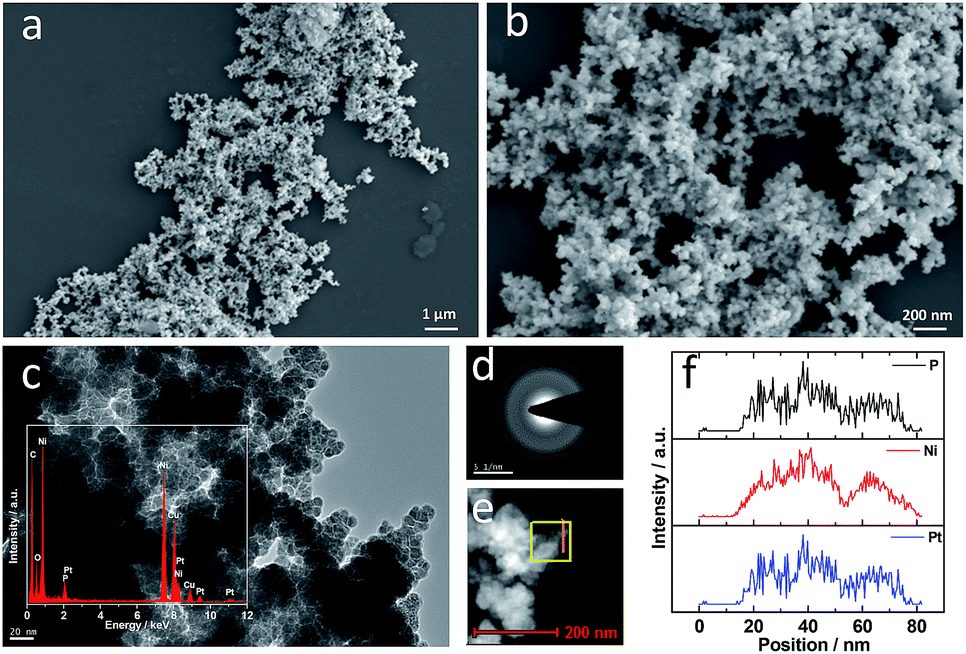 | ||
| Fig. 1 (a and b) SEM and (c and d) TEM images, (e) SAED pattern, (f) STEM image, and (g) line-scan EDX spectrum of PtNiP-20. | ||
In our previous work,21,22 it was shown that the composition of the Pd-based particle networks can be tuned by adjusting the precursor ratio. However as previously pointed out and from the authors' knowledge, no investigations have reported whether the particle size in particle network structure could be modified. Moreover, it is well-known that metallic particle electrocatalysts have particle size-dependent activities.25 Thus, the effect of the particle size of PtNiP in PtNiP particle networks on the catalytic performance for hydrazine oxidation was considered. In this study, PtNiP particle networks with different particle sizes have been successfully synthesized by controlling the reaction temperature. As shown in Fig. 2a, PtNiP-0 prepared at ca. 0 °C was composed of the accumulation of spheres, and the characterization of particle network was not obvious. For the PtNiP-20, PtNiP-50, and PtNiP-80 samples, the particle network structures were clearly observed. When the temperature increased from to 20 °C and 80 °C, the particle size decreased. In the process for the formation of PtNiP alloys, it is possible that the increase of the reaction temperature may enhance the diffusion of the reaction as well as the reaction rate. Meanwhile, the growth from the nuclei into the particles needs a relative slow deposition process. There is not enough time to deposit onto the formed nuclei for some of the continuously generated PtNiP. Subsequently, these generated PtNiP would/could become the new nuclei and grow, resulting in further particles being formed. Thus in this case, the particle size decreased.
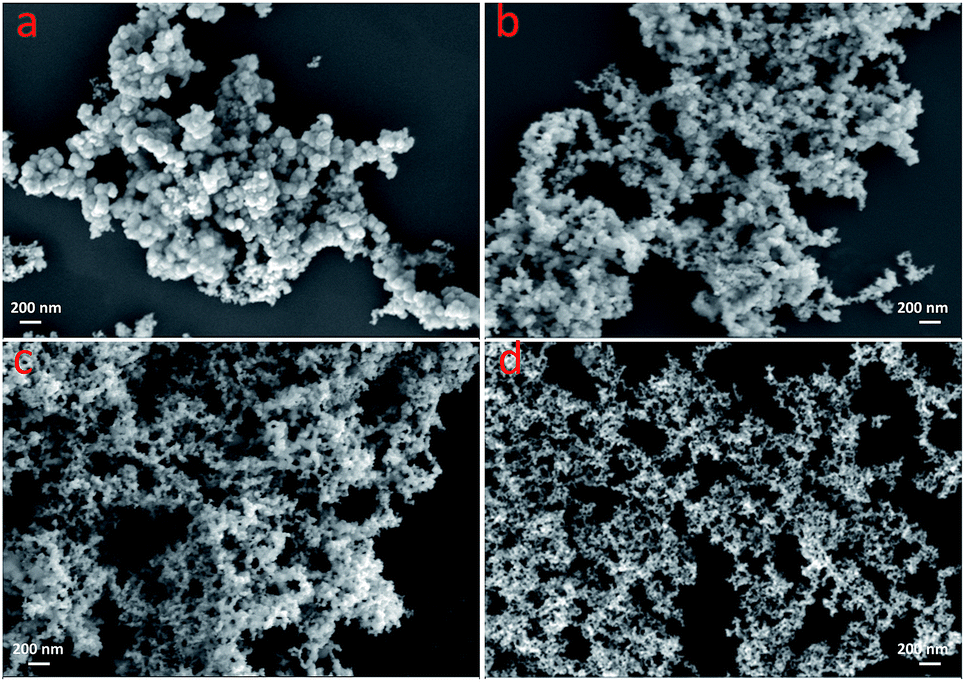 | ||
| Fig. 2 SEM images of (a) PtNiP-0, (b) PtNiP-20, (c) PtNiP-50, and (d) PtNiP-80 samples. | ||
Fig. 3a shows the XRD patterns of the obtained products. For comparison purposes, the XRD patterns of Pt and PtNi samples whose SEM images are presented in Fig. S1,† were also shown. As observed, the Pt and PtNi samples display the characteristics of the face-centred cubic (fcc) crystallite Pt (JCPDS#04-0802) for planes (111), (200), (220), (311) and (222) situated at ca. 40°, 46°, 68°, 81.5° and 86° respectively.26 In addition, two very weak peaks at ca. 33.4° and 59.3° appear, which could be related to the formation of Ni(OH)2.27 The average crystalline size and lattice constant of Pt and PtNi samples was calculated based on the all peaks by MDI Jade 6.5 software. Before obtaining the results, the XRD patterns were treated with the process of theta calibration of whole pattern, deducting background, smooth and fitting profile. The average crystalline size of Pt and PtNi is 6.0 nm and 15.4 nm respectively. The obtained lattice constants for Pt and PtNi samples are 3.9118 Å and 3.9108 Å respectively. The decrease of the lattice constant of PtNi related to that of Pt suggests the insertion of Ni atoms into the Pt cubic lattice.28
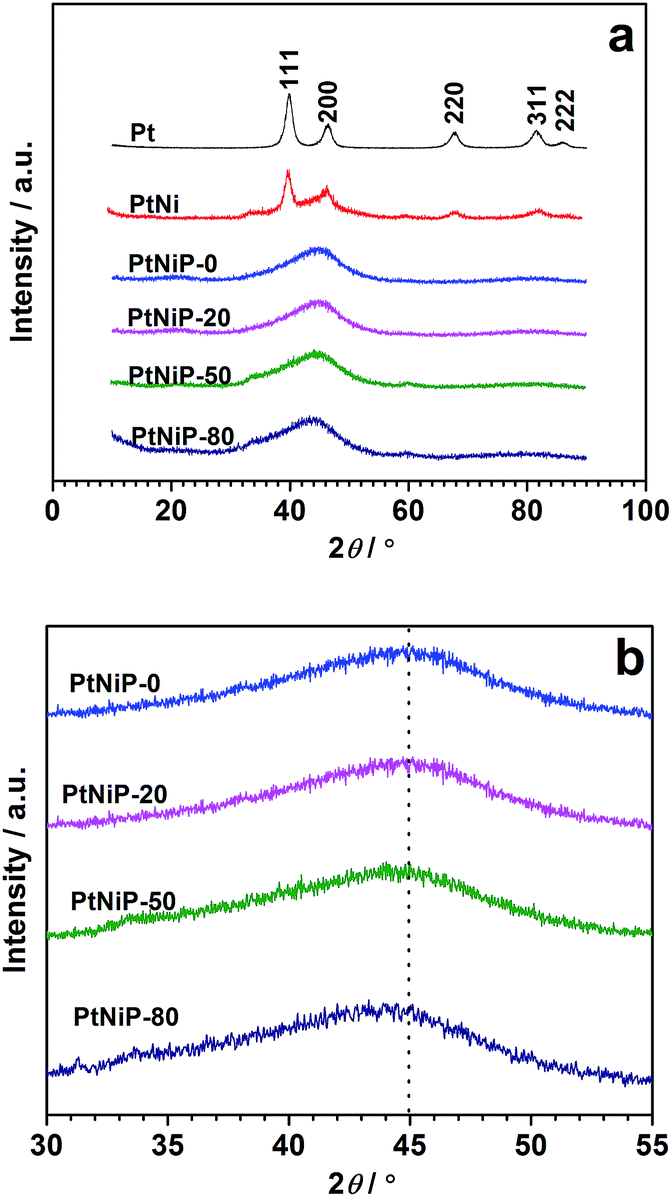 | ||
| Fig. 3 (a) XRD patterns of the Pt, PtNi, and four PtNiP samples; (b) the enlarged region between 30° and 55° for PtNiP samples. | ||
In the curves of the PtNiP-0 sample, a clear broad peak located at about 45° appears, without any trace of sharp peaks related to the periodic lattice, suggesting that a typical amorphous structure is formed in the four PtNiP samples.29 This finding is consistent to the previous SAED result, and suggests that the presence of P plays an important role in the formation of amorphous structure. The amorphous structure of PtNiP-20, PtNiP-50, and PtNiP-80 was further proven by the broad peaks located at 45°, indicating that the reaction temperature did not influence the amorphous structure. On the other hand, as shown in Fig. 3b, the broad peak shifted toward the lower 2θ value at ca. 0.7°, from the PtNiP-0 to the PtNiP-80 sample. The amorphous structure is a short-range order with a long-range disorder. When the ambient temperature increases, the atoms would rearrange, leading to the increase of the order range.30 We therefore infer that, with the enhancement of the reaction temperature, the order range lengthen, in other words, the order degree of the atomic arrangement in the structure increases, resulting in the negative shift of the broad peak from PtNiP-0 to PtNiP-80 sample.
The porous structure of PtNiP samples was investigated by N2 adsorption–desorption isotherms (Fig. S2†). The lowest relative pressure in the curves is 1.0 × 10⁻⁵. For the four samples, the isotherms can be classified as type I isotherms in the low relative pressure, which can be ascribed to the well-known Langmuir adsorption.31 No clear uptakes appear in the low relative pressure in the isotherm curves, suggesting no micropores exist in the PtNiP samples.32 At high relative pressure, the isotherms can be classified as type II isotherms, which is named as the sigmoid isotherm.31 A distinct hysteresis loop in the larger range of ca. 0.45–1.0 P/P0 in the four isotherm curves indicated an amount of mesopores.26 By the DFT theory method based upon QSDFT equilibrium model, the pore size distributions were estimated. The high fitting degree suggests that the shape of the pores in the four samples is slit. These slit pores derived of the gap among the particles of the network structure. The results were inserted in the isotherm profiles. As seen Fig. S2,† the pores are in the mesoporous range between 3.4 nm and 38 nm for the four samples, supporting the judgement from the shape of the isotherms. No maximum distribution appears for each samples. From PtNiP-0 to PtNiP-80, the pore size distribution did not emerge a trend of change. The results could be The BET surface areas of the four samples are shown in Fig. 4. As observed, the BET surface areas increase with a decrease in particle sizes from PtNiP-0 to PtNiP-80.
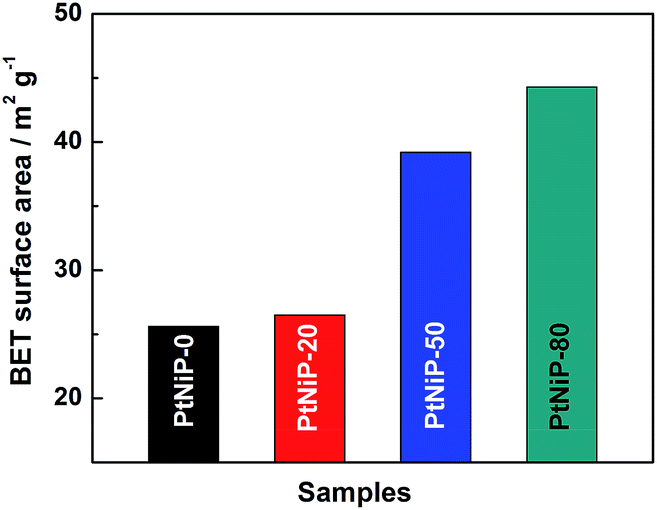 | ||
| Fig. 4 BET surface areas of PtNiP-0, PtNiP-20, PtNiP-50, and PtNiP-80 samples. | ||
The surface electrochemical properties of Pt, PtNi and PtNiP were investigated by Cyclic Voltammetry (CV) which is regarded as a powerful electrochemical technique for surface analysis.33 For comparison, we also performed CV experiments of Pt and PtNi in 0.1 mol L−1 KOH solution at a scan rate of 50 mV s−1. As shown in Fig. 5a, the CV of Pt electrode in 0.1 mol L−1 KOH solution in the absence of N2H4 displays the typical features of metallic Pt. The peaks in the low potential region correspond to the hydrogen adsorption (Hads)/desorption (Hdes) and the broad peaks in the high potential region relates to the oxidation/reduction of Pt. In the presence of N2H4 in the electrolyte, the reaction of both the hydrogen adsorption/desorption and oxidation/reduction of Pt did not change drastically (no major changes in the shapes of all peaks). However the oxidation peak current increased, indicating that the hydrazine oxidation occurred and no new peaks emerged, suggesting that the peak of hydrazine oxidation overlapped with that of the hydrogen desorption peak. This finding suggests that, on the Pt surface, the hydrogen desorption competed with the hydrazine oxidation, implying that pure Pt as electrocatalysts for hydrazine oxidation with the conditions in this work is poor. On the PtNi electrode (Fig. 5b), the peaks related to both hydrogen adsorption/desorption and the oxidation/reduction of Pt in 0.1 mol L−1 KOH solution in the absence of N2H4 were weak, and the oxidation/reduction peaks at the highest potential within the whole potential range could be ascribed to Ni(OH)2 oxidation to NiOOH and the reduction of NiOOH to Ni(OH)2.21 In the 0.1 mol L−1 KOH + 0.1 mol L−1 N2H4 solution, an oxidation peak at ca. −0.743 V vs. Ag/AgCl was observed, indicating that hydrazine oxidation occurred on PtNi electrode. Meanwhile, the oxidation peak at the highest potential became strong, maybe resulting from the oxidation of produced intermediates. The enhanced catalytic activity of PtNi compared to Pt could be ascribed to two effects: (i) an ‘electron effect’ – when Pt alloys with Ni, the electron structure of Pt atoms may change thus influence the catalytic activity;29 (ii) the presence of Ni atoms around Pt atoms significantly weakens the hydrogen adsorption/desorption, taking advantage of the hydrazine oxidation reaction.
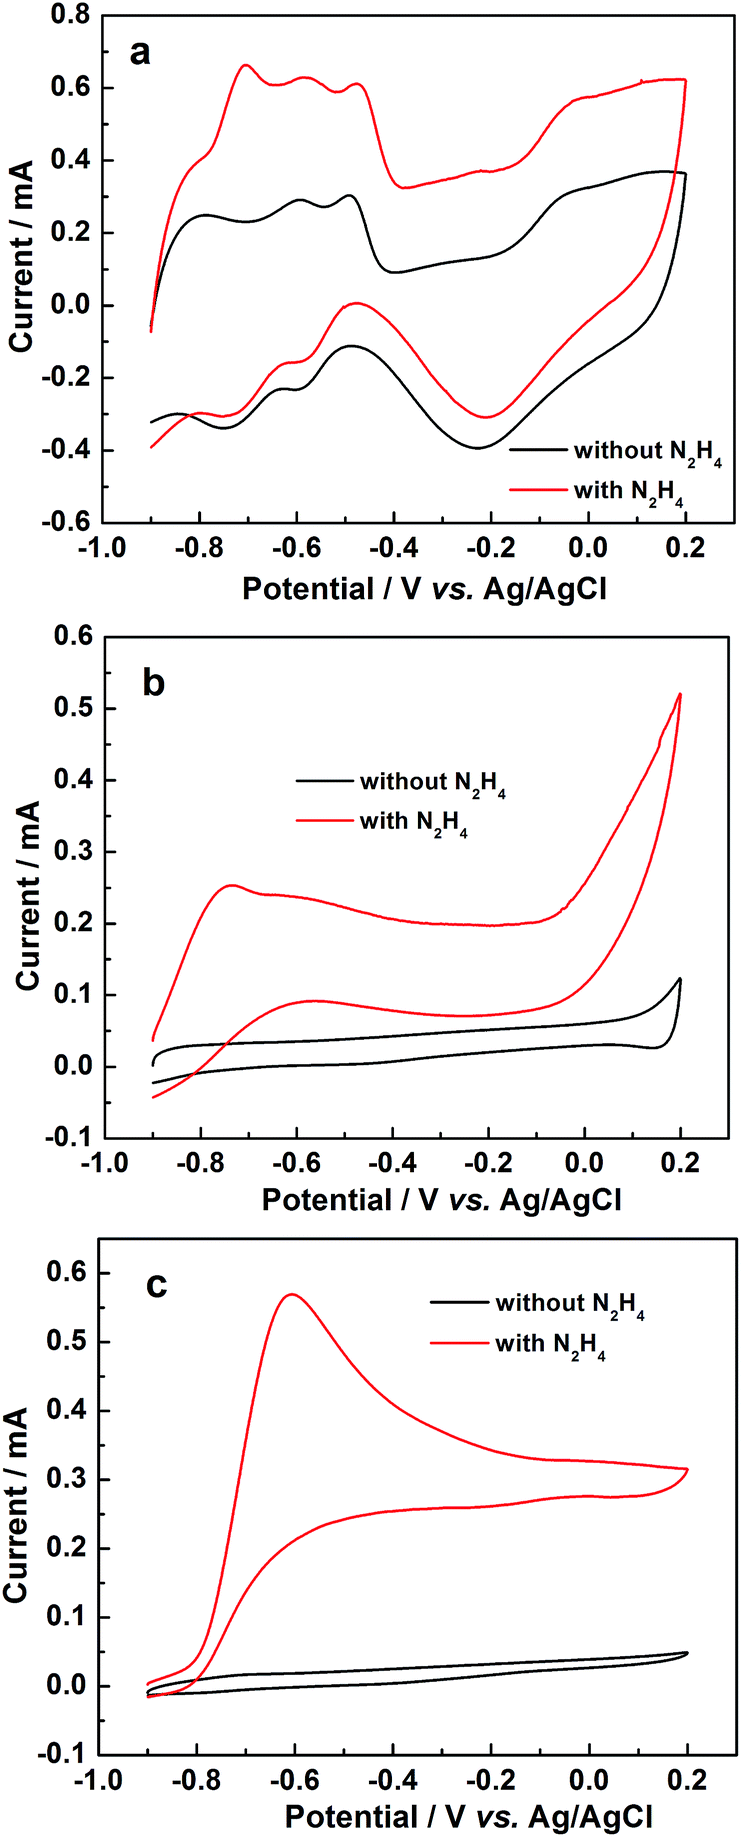 | ||
| Fig. 5 CV curves of (a) Pt, (b) PtNi, and (c) PtNiP-20 electrodes in the 0.1 mol L−1 KOH without or with 0.1 mol L−1 N2H4 solution at a scan rate of 50 mV s−1. | ||
CVs on PtNiP electrode are presented in Fig. 5c. From the figure, the hydrogen adsorption/desorption peaks and the metal oxidation peak, as well as the oxidation/reduction peaks related to the transformation between Ni(OH)2 and NiOOH, can hardly be seen from the CV (in 0.1 mol L−1 KOH solution), indicating that the introduction of P atoms efficiently inhibits the occurrence of these reactions. After the addition of N2H4 into the electrolyte, a clear hydrazine oxidation peak situated at about −0.745 V vs. Ag/AgCl arose. On the basis of the current of hydrazine oxidation peak, the catalytic activity of PtNiP catalyst was much better than that of Pt and PtNi catalysts. Here, the onset potential of hydrazine oxidation on the three electrodes was not compared due to the overlap of the hydrogen desorption and hydrazine oxidation on Pt and PtNi electrodes. The improved performance of PtNiP catalyst could be related to the ‘electron effect’29 and the inhibition for the hydrogen adsorption/desorption on Pt atoms due to the presence of Ni and P atoms. In addition, the amorphous structure could be a factor influencing the catalytic activity of PtNiP-20. Over the past few years, our group has carefully studied the electrocatalytic activity of amorphous electrocatalysts.28,30,34–39 We have found that the defects in particle structure of amorphous electrocatalysts can act as active sites for catalysis, moreover, the improvement of crystallization degree may lead to the decrease of the defects, thus reducing the catalytic activity of the electrocatalysts. We then infer that the defects in amorphous structure of PtNiP could also enhance its catalytic activity. To further elucidate this statement, the study focused on a series of PtNiP samples prepared at various reaction temperatures for which their catalytic activities were determined.
Fig. 6 shows a series of CVs of PtNiP-0, PtNiP-20, PtNiP-50 and PtNiP-80 electrodes in hydrazine solution. As observed, there is a specific trend in which the current peak of hydrazine oxidation increases with the reaction temperature, and reaches a value of +0.626 mA (recorded for the PtNiP-50 catalyst), and then decreases (PtNiP-80 catalyst). At this point, it is thus necessary to discuss the reason(s) caused by this observed trend: based on the same composition for the four catalysts, the particle size was firstly considered because the smaller the particle size is, the larger the surface area is, then the larger the number of active sites are for electrocatalysis. As shown by SEM and BET data, from PtNiP-0 to PtNiP-80, the particle size decreased and the BET surface area increased which should lead to a continuous improvement in the catalytic activity of the samples. On the other hand, the increase of the reaction temperature from PtNiP-0 to PtNiP-80 made the order-range in PtNiP structure become longer, implying an increase in the crystalline degree. The number of the defects which acts as the active sites deduced, resulting in the decrease of the catalytic activity for hydrazine oxidation. When the effect of the particle size balances the effect of the crystalline degree, the catalytic activity of PtNiP catalyst would reach a maximum value. The PtNiP-50 catalyst was best among the four catalysts resulting from the balance between the particle size effect and the effect of the crystalline degree. In addition, the results also evidenced that the defects in amorphous structure of PtNiP samples acted as the active sites for catalysis.
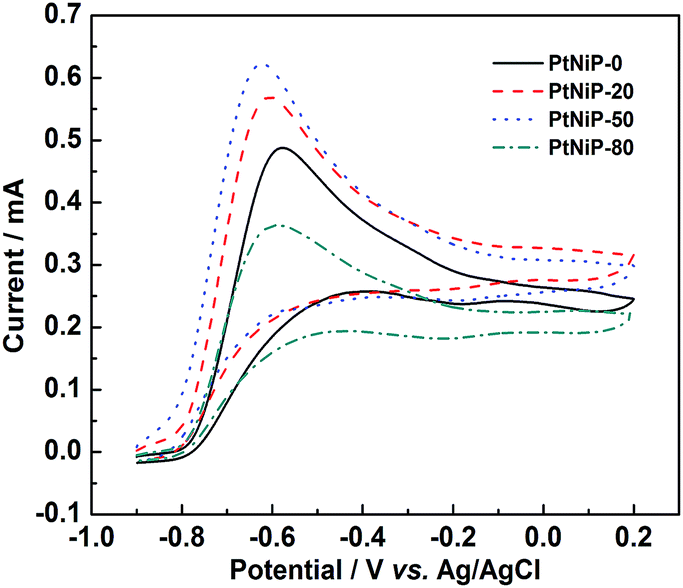 | ||
| Fig. 6 CV curves of PtNiP-0, PtNiP-20, PtNiP-50, PtNiP-80 electrodes in the 0.1 mol L−1 KOH with 0.1 mol L−1 N2H4 solution at a scan rate of 50 mV s−1. | ||
To investigate the durability of the PtNiP samples, chronoamperometry (CA) measurements were carried out (Fig. 7). For the four samples, the potentiostatic current decreased rapidly in the initial period of time which can be due to the formation of intermediate species during the electro-oxidation of hydrazine. After 1000 s, the electro-oxidation current of hydrazine on PtNiP-50 electrode was higher than that of other PtNiP catalysts, indicating that PtNiP-50 catalysts appear to be more durable than other PtNiP catalysts in the hydrazine oxidation reaction.
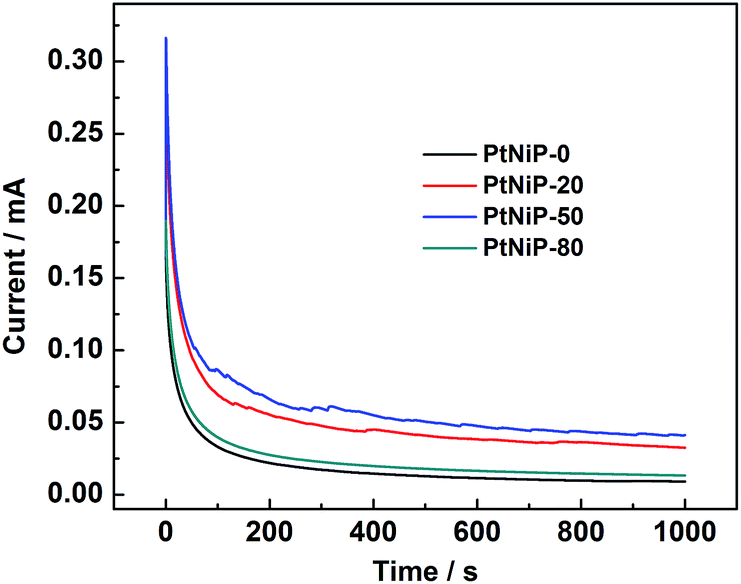 | ||
| Fig. 7 Chronoamperometry curves of the four PtNiP samples in 0.1 mol L−1 KOH + 10 mmol L−1 N2H4 solution at −0.7 V vs. Ag/AgCl. | ||
Fig. 8 shows the effect of hydrazine concentration on the catalytic activity of PtNiP-50 catalyst. As it can be seen that the peak current increased significantly with the increase of hydrazine concentration, confirming that the oxidation currents were indeed caused by the electrooxidation of hydrazine, and the hydrazine oxidation on PtNiP-50 electrode was controlled by a diffusion process.40
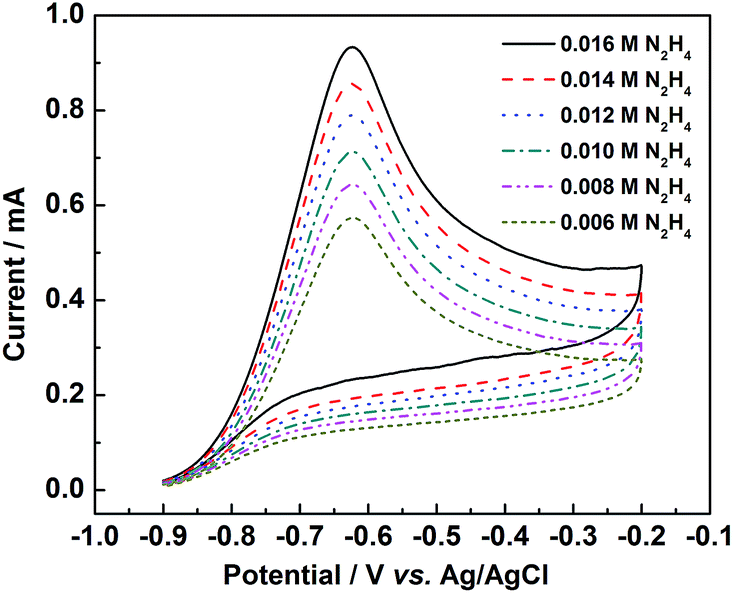 | ||
| Fig. 8 CV curves of PtNiP-50 electrode in the 0.1 mol L−1 KOH with 0.006, 0.008, 0.010, 0.012, 0.014 and 0.016 mol L−1 N2H4 solution at a scan rate of 50 mV s−1. | ||
To study the mechanism for the oxidation of hydrazine in alkaline solution, the influence of KOH concentration in the alkaline hydrazine solutions on the potential and current of the hydrazine oxidation peak was performed. As shown in Fig. 9, the current of the hydrazine oxidation peak was increased and the potential of the hydrazine oxidation shifted towards low value with increasing the KOH concentration in the electrolyte. Based on the view of Karim-Nezhad and co-workers,41 the first intermediate of hydrazine oxidation in alkaline solution was [HO–H2N![[double bond, length as m-dash]](https://www.rsc.org/images/entities/char_e001.gif) NH2–OH]2−. The hydrazine oxidation process can be proposed as following:
NH2–OH]2−. The hydrazine oxidation process can be proposed as following:
| N2H4 + 2HO− → [HO–H2NNH2–OH]2− |
| [HO–H2NNH2–OH]2− → N2H2* + 2H2O + 2e− |
| N2H2* + 2HO− → N2 + * + 2H2O + 2e− |
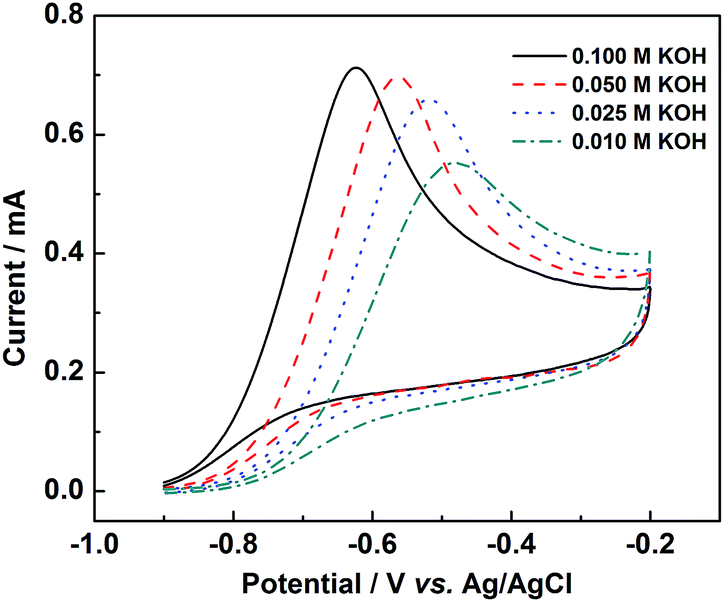 | ||
| Fig. 9 CV curves of PtNiP-50 electrode in the 0.01 mol L−1 N2H4 with 0.010, 0.025, 0.050 and 0.100 mol L−1 KOH solution at a scan rate of 50 mV s−1. | ||
The result implied that KOH addition in the anolyte effectively promoted the hydrazine oxidation. The formation of [HO–H2NNH2–OH]2− ion is the rate-determining step. In high concentrations, there are no limitations on oxidation process of hydrazine in the presence of KOH. It means that the high catalytic activity for PtNiP catalysts for hydrazine oxidation can be obtained by the increase of KOH concentration.
Conclusions
In this study, the physical characterization results elucidated the changes of the particle size and the amorphous structure of PtNiP particle networks as a function of the reaction temperature. The following conclusions can be drawn:(1) The increase in the reaction temperature from 0 °C to 80 °C resulted in the decrease of the particle size and the defects in PtNiP amorphous structure.
(2) The current of hydrazine oxidation on PtNiP-20 electrode was 0.62 mA at −0.63 V, higher than that of the crystalline Pt and PtNi catalysts, which could be associated to the electron effect, the inhibition for the hydrogen adsorption/desorption on Pt atoms due to the presence of Ni and P atoms, and the defects in amorphous structure of PtNiP acting as the active sites for catalysis.
(3) Compared to PtNiP-0, PtNiP-20 and PtNiP-80, PtNiP-50 exhibited the highest catalytic activity, resulting from the balance between the decrease of particle size and the decrease of the number of the defects.
(4) The hydrazine oxidation on PtNiP-50 electrode was controlled by a diffusion process. The catalytic activity of PtNiP would be enhanced by increasing the concentration of KOH.
Acknowledgements
The authors acknowledge the National Natural Science Foundation of China (21163018, 21363022, and 51362027) and JCYJ20140418095735600 for providing funding for this research.Notes and references
- N. Yousfi-Steiner, P. Moçotéguy, D. Candusso and D. Hissel, J. Power Sources, 2009, 194, 130–145 CrossRef CAS PubMed.
- B. Du, S. A. Rabb, C. Zangmeister and Y. Tong, Phys. Chem. Chem. Phys., 2009, 11, 8231–8239 RSC.
- F. Liang, H. Tian, M. Jia and J. Hu, J. Power Sources, 2013, 225, 9–12 CrossRef CAS PubMed.
- Y. Hu, P. Wu, H. Zhang and C. Cai, Electrochim. Acta, 2012, 85, 314–321 CrossRef CAS PubMed.
- Y. Bing, H. Liu, L. Zhang, D. Ghosh and J. Zhang, Chem. Soc. Rev., 2010, 39, 2184–2202 RSC.
- M. M. Tusi, N. S. D. Polanco, M. Brandalise, O. V. Correa, J. C. Villalba, F. J. Anaissi, A. O. Neto and E. Spinace, Int. J. Electrochem. Sci., 2011, 6, 484–491 CAS.
- P. P. Wells, E. M. Crabb, C. R. King, R. Wiltshire, B. Billsborrow, D. Thompsett and A. E. Russell, Phys. Chem. Chem. Phys., 2009, 11, 5773–5781 RSC.
- Y. Xu and B. Zhang, Chem. Soc. Rev., 2014, 43, 2439 RSC.
- L. Zhang, D. Lu, Y. Chen, Y. Tang and T. Lu, J. Mater. Chem. A, 2014, 2, 1252–1256 CAS.
- J. Zhang, Y. Xu and B. Zhang, Chem. Commun., 2014, 50, 13451–13453 RSC.
- Y. Xu, S. Hou, Y. Liu, Y. Zhang, H. Wang and B. Zhang, Chem. Commun., 2012, 48, 2665–2667 RSC.
- Y. Xu, Y. Yuan, A. Ma, X. Wu, Y. Liu and B. Zhang, ChemPhysChem, 2012, 13, 2601–2609 CrossRef CAS PubMed.
- C. Zhu, S. Guo and S. Dong, Chem.–Eur. J., 2013, 19, 1104–1111 CrossRef CAS PubMed.
- X. Y. Liu, Y. Zhang, M. X. Gong, Y. W. Tang, T. H. Lu, Y. Chenab and L. Jong-Min, J. Mater. Chem. A, 2014, 2, 13840–13844 CAS.
- W. Y. Wong, W. R. W. Daud, A. B. Mohamad, A. A. H. Kadhum, K. S. Loh and E. H. Majlan, Int. J. Hydrogen Energy, 2013, 38, 9370–9386 CrossRef CAS PubMed.
- K. Wang, H. Wang, R. Wang, J. Key, V. Linkov and S. Ji, S. Afr. J. Chem., 2013, 66, 86–91 CAS.
- Y. Wang, X. Chen, B. Yue and H. He, Top. Catal., 2012, 55, 1022–1031 CrossRef CAS.
- M. Muraoka, H. Tomonaga and M. Nagai, Fuel, 2012, 97, 211–218 CrossRef CAS PubMed.
- J. Barranco and A. R. Pierna, J. Non-Cryst. Solids, 2007, 353, 851–854 CrossRef CAS PubMed.
- Y. Ma, R. Wang, H. Wang and S. Ji, Int. J. Electrochem. Sci., 2013, 8, 6085–6093 CAS.
- R. Wang, Y. Ma, H. Wang, K. Julian and S. Ji, Chem. Commun., 2014, 50, 12877–12879 RSC.
- Y. Ma, R. Wang, H. Wang, J. Key and S. Ji, RSC Adv., 2015, 5, 9837–9842 RSC.
- L. Xu, G. Zhang, J. Chen, Y. Zhou, G. e. Yuan and F. Yang, J. Power Sources, 2013, 240, 101–108 CrossRef CAS PubMed.
- L. Wei, Y. J. Fan, J. H. Ma, L. H. Tao, R. X. Wang, J. P. Zhong and H. Wang, J. Power Sources, 2013, 238, 157–164 CrossRef CAS PubMed.
- F. J. Perez-Alonso, D. N. McCarthy, A. Nierhoff, P. Hernandez-Fernandez, C. Strebel, I. E. L. Stephens, J. H. Nielsen and I. Chorkendorff, Angew. Chem., Int. Ed., 2012, 51, 4641–4643 CrossRef CAS PubMed.
- T. Zhou, H. Wang, S. Ji, V. Linkov and R. Wang, J. Power Sources, 2014, 248, 427–433 CrossRef CAS PubMed.
- M. U. Anu Prathap, V. Anuraj, B. Satpati and R. Srivastava, J. Hazard. Mater., 2013, 262, 766–774 CrossRef CAS PubMed.
- Y. Ma, H. Wang, S. Ji, V. Linkov and R. Wang, J. Power Sources, 2014, 247, 142–150 CrossRef CAS PubMed.
- Y. Ma, R. Wang, H. Wang, V. Linkov and S. Ji, Phys. Chem. Chem. Phys., 2014, 16, 3593–3602 RSC.
- Y. Ma, H. Li, H. Wang, X. Mao, V. Linkov, S. Ji, O. U. Gcilitshana and R. Wang, J. Power Sources, 2014, 268, 498–507 CrossRef CAS PubMed.
- S. Brunauer, L. S. Demine, W. E. Deming and E. Teller, J. Am. Chem. Soc., 1940, 62, 1723–1732 CrossRef CAS.
- Z. Mo, H. Peng, H. Liang and S. Liao, Electrochim. Acta, 2013, 99, 30–37 CrossRef CAS PubMed.
- H. Wang, R. Wang, H. Li, Q. Wang, J. Kang and Z. Lei, Int. J. Hydrogen Energy, 2011, 36, 839–848 CrossRef CAS PubMed.
- H. Wang, X. Zhang, R. Wang, S. Ji, W. Wang, Q. Wang and Z. Lei, J. Power Sources, 2011, 196, 8000–8003 CrossRef CAS PubMed.
- J. Kang, R. Wang, H. Wang, S. Liao, J. Key, V. Linkov and S. Ji, Materials, 2013, 6, 2689–2700 CrossRef CAS PubMed.
- Y. J. Ma, H. Wang, S. Ji, B. G. Pollet and R. F. Wang, ECS Trans., 2013, 50, 1943–1950 CrossRef PubMed.
- R. Wang, H. Wang, X. Wang, S. Liao, V. Linkov and S. Ji, Int. J. Hydrogen Energy, 2013, 38, 13125–13131 CrossRef CAS PubMed.
- Y. Ma, H. Li, H. Wang, S. Ji, V. Linkov and R. Wang, J. Power Sources, 2014, 259, 87–91 CrossRef CAS PubMed.
- Y. Ma, H. Wang, H. Li, J. Key, S. Ji and R. Wang, RSC Adv., 2014, 4, 20722–20728 RSC.
- J. Liu, R. Liu, C. L. Yuan, X. P. Wei, J. L. Yin, G. L. Wang and D. X. Cao, Fuel Cells, 2013, 13, 903–909 CAS.
- G. Karim-Nezhad, R. Jafarloo and P. S. Dorraji, Electrochim. Acta, 2009, 54, 5712–5726 CrossRef PubMed.
Footnote |
| † Electronic supplementary information (ESI) available. See DOI: 10.1039/c5ra13774h |
| This journal is © The Royal Society of Chemistry 2015 |