DOI:
10.1039/C5RA13177D
(Paper)
RSC Adv., 2015,
5, 68688-68699
Biobased copolyesters from renewable resources: synthesis and crystallization kinetics of poly(propylene sebacate-co-isosorbide sebacate)†
Received
6th July 2015
, Accepted 6th August 2015
First published on 6th August 2015
Abstract
In this work, a series of novel biobased copolymers, poly(propylene sebacate-co-isosorbide sebacate) (P(PSe-co-IS)), were synthesized by melt-polycondensation from sebacic acid (SA) and isosorbide (IS) with 1,3-propanediol (PD). In order to analyze the effects of isosorbide on the relative properties of poly(propylene sebacate) (PPSe), the composition, crystal structure, crystallization behavior, multiple melting behavior, and spherulitic morphology of these copolymers were investigated by 1H-NMR, WAXD, DSC, TMDSC and POM, respectively. Results of 1H-NMR indicated that IS have been successfully introduced into the PPSe main chains with the designed molar ratio. DSC data showed that crystallization ability of P(PSe-co-IS) copolymers was retarded with the introduction of IS. With the increment of IS, the overall crystallization rate decreased gradually. Furthermore, crystallization temperature (Tc), crystallization enthalpy (ΔHc), melting temperature (Tm), and equilibrium melting temperature (Tom) of P(PSe-co-IS) copolymers also decreased apparently with the increase of IS content. WAXD suggested that crystal structure of PPSe was not affected by IS, and POM revealed that all spherulites possess the typical “Maltese Cross” image. Furthermore, no obvious ring-banded spherulites could be detected for P(PSe-co-IS) copolymers in the wide temperature range except neat PPSe due to the hindrance of IS. With the increment of IS and crystallization temperature, the number of spherulites decreased rapidly and the size of spherulites increased, respectively.
1. Introduction
In recent decades, the energy and environmental problems and the irreversible buildup of polymer waste in the environment have led to an alarmed reaction among scientists and politicians around the world.1,2 Therefore, the development of sustainable polymers based on naturally raw materials becomes an effective method for solving environmental problems inherent to polymer chemistry. Biodegradable polymers as green materials, due to their excellent biodegradability, melt processability, and thermal and chemical resistance, are gaining increasing popularity. Aliphatic polyesters with relatively good physical properties are similar to those of traditional plastics at a certain degree. Poly(L-lactic acid), poly(ε-caprolactone), poly(glycolic acid), poly(trimethylene carbonate), poly(hydroxybutyrate), and so forth, constitute an important class of biodegradable polymers, which have significant potential in agricultural sanitary fields, packaging applications, and bioengineering.3–9
Usually, bio-based diacid and diol monomers are used to synthesize the aliphatic polyesters.10,11 Compared with long-chain aliphatic acids, short-chain aliphatic acids are prone to intra-molecular condensation reactions which would influence the molecular weights and the polymer distribution. Furthermore, the physical properties of aliphatic polyesters would be damaged. Sebacic acid, a biodegradable and biocompatible monomer with long carbon chains, is an intermediate product of oxidization of long-chain aliphatic acids which can prevent cyclization, and is not very hydrophobic.4,12–14 Over the past few years, most of the effort in making aliphatic polymers and/or copolymers are focused on 1,4-butanediol, ethylene glycol or 1,6-hexanediol.15–25 However, little attention are paid to the synthesis of polyesters based on 1,3-propanediol due to its low production, extremely high cost, poor ability for stacking in the crystals and poor thermal and mechanical properties.8,26,27 In recent years, more attractive processes have been developed for the production of 1,3-propanediol by the biotechnological or the environment-friendly methods with a renewable resource.28 Importantly, compared with the polyesters synthesized by diols with even number of methylene units, that consist of 1,3-propanediol shown lower crystallization ability and higher biodegradation rates due to the presence of odd number of methylene units, which may be used as a potential biodegradable material.29
As is known, not only the chain flexibility but also the crystal structure and the chain packing affect the crystallization kinetics, melting behaviors, chemical and physical properties, and even biodegradation rates of polymers. Soccio et al. studied the effect of chain length on crystallization kinetics of aliphatic poly(propylene dicarboxylate)s based on 1,3-propanediol and aliphatic dicarboxylic acid with the number of methylene units range from 4 to 9.30 They found that the melting point showed an “odd–even” fluctuation due to several factors. With respect to the polymer containing even number of methylene groups, that have odd number of methylene units is more difficult to adopt an excellent chain packing, and consequently, resulting in a lower melting point. In our recent paper, long chain aliphatic copolymers are synthesized from bio-based sebacic acid and 1,10-decanediol.31 Results show that neat PDS possesses a high crystallization ability which is caused by the high flexibility of chains with long methylene sequences. Besides, single melting endotherm is found for PDS and its copolymers due to the formation of more perfect and stable crystals. Above all, the existence of even number of methylene units makes it possible for chain segment to adopt an excellent packing, which leads to the single melting endotherm. Compared with long carbon chain 1,10-decanediol, 1,3-propanediol is expected to make its polyesters possess low crystallization capacity and low melting point. Also, it is interesting to investigate the “odd–even” effect on crystallization and melting behavior of 1,3-propanediol-based aliphatic copolymers.
Meanwhile, the thermal properties and durability of poly(propylene sebacate) (PPSe) is unsatisfactory in some applications. In order to improve physical and chemical properties of PPSe, rigid structure requires the introduction of the backbone of materials. 1,4:3,6-Dianhydro-D-glucitol(isosorbide), a by-product of the starch industry obtained by reducing hexose sugars followed by dehydration, which have attract growing attention due to its special structures and non-toxic characterizations.2 Isosorbide contains two cis-fused tetrahydrofuran rings with a 120° angle between the two rings, where two hydroxyl groups with different reactivity stand at in position 2 and 5, respectively.32–34 Due to the fused rings structure, isosorbide has a relatively high thermostability and low segmental mobility, and can be used to improve the glass transition temperatures of polyesters.35–41 Furthermore, the larger steric hindrance of isosorbide will remarkably affect the crystallization kinetics and melting behaviors.
In this work, we firstly synthesize a series of biobased copolymers poly(propylene sebacate-co-isosorbide sebacate) (P(PSe-co-IS)) base on sebacic acid in combination with 1,3-propanediol and isosorbide. The effects of the asymmetric bicyclic structure of isosorbide on the crystallization kinetics and multiple behaviors of P(PSe-co-IS) copolymers will be emphasized in this paper. It is expected that the results presented herein is crucial to study the crystallization and melting mechanism in the polymers with the required properties.
2. Experimental
2.1 Materials
Sebacic acid (99%), 1,3-propanediol (97%), stannous octoate (96%), isosorbide (98%) were purchased from J&K chemical reagent. All reagents were used as received.
2.2 Sample preparation
P(PSe-co-IS) copolymers were synthesized by a two-step polymerization (as depicted in Scheme 1). The molar ratio of (PD + IS)/SA was 1.05/1, appropriate amount of Sn(Oct)2 was used as catalyst. During first stage, the mixture was heated to 160 °C and reacted 2–3 h under nitrogen atmosphere to complete the esterification process. Then the temperature was raised to 210 °C for 3–4 h. Meanwhile the pressure was reduced to approximately 100 Pa to remove the byproduct and the unreacted monomers. Finally, the product was dissolved in chloroform and precipitated with cold ethanol several times then dried at 20 °C under vacuum for 24 h. Samples with various feed ratios are listed in Table 1.
 |
| | Scheme 1 Synthetic route of P(PSe-co-IS) copolymers. | |
Table 1 Composition and molecular weight of P(PSe-co-IS) copolymers
| Sample |
Feed |
Ratio in copolymersa |
Mw (kg mol−1) |
Ð |
| PD (mol%) |
IS (mol%) |
PD (mol%) |
IS (mol%) |
| Calculated by 1H-NMR. |
| PPSe |
100 |
0 |
100 |
0 |
25 |
1.28 |
| P(PSe-co-11.7 mol% IS) |
90 |
10 |
89.3 |
11.7 |
15 |
1.94 |
| P(PSe-co-19.1 mol% IS) |
80 |
20 |
81.9 |
19.1 |
12 |
1.50 |
| P(PSe-co-27.9 mol% IS) |
70 |
30 |
72.1 |
27.9 |
15 |
1.51 |
| P(PSe-co-38.2 mol% IS) |
60 |
40 |
61.8 |
38.2 |
10 |
1.62 |
| P(PSe-co-52.9 mol% IS) |
50 |
50 |
47.1 |
52.9 |
4.5 |
1.21 |
2.3 Characterization
Proton nuclear magnetic resonance spectra (1H-NMR). All samples were recorded by a Bruker Avance 400 MHz spectrometer. Deuterated chloroform (CDCl3) and tetramethylsilane (TMS) were used as a solvent and the calibration, respectively.
Gel permeation chromatography (GPC). The molecular weight and its distribution were measured by gel permeation chromatography (GPC) using a Waters 1515 HPLC system equipped with Ultrastyragel columns and a differential refractometer detector. Tetrahydrofuran (THF) was used as the eluent at a flow rate of 1.0 mL min−1 at 25 °C. The molecular weights were calculated from polystyrene standards with a narrow polydispersity.
Wide-angle X-ray diffraction (WAXD). All samples were performed on a Dmax-Ultima + X-ray diffractometer (Rigaku, Japan) with Ni-filtered Cu/K-α radiation (λ = 0.15418 nm). The operating target voltage was 40 kV and the tube current was 100 mA. The scanning speed was 2° min−1 from 10° to 40°.
Differential scanning calorimetry (DSC). Non-isothermal and isothermal crystallization process were implemented in DSC1 (Mettler Toledo, Switzerland) differential scanning calorimeter. The instrument was calibrated using high purity indium and zinc. (1) Non-isothermal crystallization process: each sample (6–10 mg) was heated to 80 °C at the rate of 10 °C min−1, keeping the temperature 5 min to remove the previous thermal history, then cooled to −60 °C at the rate of 10 °C min−1, hold 5 min and finally heated to 80 °C at the same rate again. Crystallization temperature (Tc), melting temperature (Tm) and crystallization enthalpy (ΔHc) were recorded. (2) Isothermal crystallization process: each sample (6–10 mg) was heated to 80 °C at the rate of 10 °C min−1, keeping the temperature 5 min to remove the previous thermal history, then quenched to the indicated temperatures to complete the crystallization process at the rate of −40 °C min−1.
Temperature-modulated differential scanning calorimetry (TMDSC). The samples were firstly isothermally crystallized at the indicated temperatures for 30 min, followed by quenching to room temperature for TMDSC measurements, respectively. TMDSC measurements were performed with a TA instruments temperature modulated DSC Q20 (TA, USA) under nitrogen atmosphere at a heating rate of 3 °C min−1 with temperature modulation amplitude of 0.5 °C and modulation period of 60 s.
Thermogravimetric analysis (TGA). Thermogravimetric analysis of P(PSe-co-IS) copolymers was performed by Q500 (TA, USA) from 30 to 600 °C at a heating rate of 10 °C min−1 under nitrogen flow.
Polarized optical microscopy (POM). The spherulitic morphologies of P(PSe-co-IS) copolymers were observed with a Leica 4500P polarized optical microscope (Germany) with a Linkam THMS600 hot stage. Thin films of samples were sandwiched between two thin glass slides, and then quenched to Tc after melted at 80 °C for 5 min, and maintain indicated time to observe the crystallization process.
3. Results and discussion
3.1 Copolymer composition and crystal structure
Biobased P(PSe-co-IS) copolymers are synthesized by a two-step polycondensation process, as shown in Scheme 1. Early studies on P(DS-co-IS) copolymers have demonstrated that random copolymers are obtained successfully, therefore, the sequence distributions of P(PSe-co-IS) copolymers in this study should be random due to their little difference in comonomers and synthesis processes.31 Copolymers with isosorbide contents of 0 to 50 mol% are prepared with the Sn(Oct)2 catalyst and a small excess of diols. Molecular weight (Mw) and polydispersity index (Ð) of P(PSe-co-IS) copolymers have been summarized in Table 1. We can see that the weight-average molecular of P(PSe-co-IS) copolymers are between 4.5 and 25 kg mol−1 with the polydispersity index ranges from 1.21 to 1.94. However, compared with PPSe, all copolymers show lower molecular weight, which may be caused by the low reactivity of isosorbide. On one hand, the non-planar structure of isosorbide increasing its difficulty in polymerization; on the other hand, these two secondary hydroxyl groups of isosorbide have different reactivity, since they differ in spatial orientation and steric hindrance. The one in endo position is more likely to form intra-molecular hydrogen bonding with the ether oxygen in main chains while the other in exo position is more reactive in polycondensation reactions.33,34
The chemical structures and composition of P(PSe-co-IS) copolymers are further studied by 1H-NMR spectroscopy. As shown in Fig. 1, for PPSe, there are only five characteristic peaks locating at 4.15 (Proton a), 2.28 (Proton c), 1.96 (Proton b), 1.59 (Proton d), 1.31 ppm (Proton e and f). Two peaks around 4.15 and 2.28 ppm are attributed to a and c protons of PD unit, respectively, while other signals appearing at 1.0–2.5 ppm represent the proton in CH2 of SA unit. It is interesting that compared with the single peak of PPSe at 2.28 ppm, which is assigned to the methylene linked to carbonyl in SA unit, that of P(PSe-co-IS) copolymers split into two equal groups (C1 and C2) at the same location because of the different chemical environments of hydroxyl groups in IS. Additionally, the molar ratio of PD/IS in copolymers are calculated by 1H-NMR spectroscopy with the following equation:
| |
 | (1) |
where
FIS is the molar fraction of IS unit in copolymers,
Ib and
I1–6 represent the integrals of the corresponding peaks, respectively. The obtained values have been summarized in
Table 1. It is obviously found that the content of PD in copolymers is nearly equal to the ration that designed. All results indicate that IS has been introduced into the PPSe chains successfully. Crystal structure plays an important role in determining the properties of the final products, so it is important to see whether the crystal structures of PPSe are changed or not with the introduction of IS. Just as illustrated in
Fig. 2, there is only one characteristic peak located at 19.2° for neat PPSe, and no new peak is observed for its copolymers which imply that the crystal structure is almost not affected despite the incorporation of IS. However, the intensity of diffraction peaks decrease with the increase of IS in despite of the fact that the locations of the diffraction peaks almost unchanged indicating the crystallinity of P(PSe-
co-IS) copolymers are depressed.
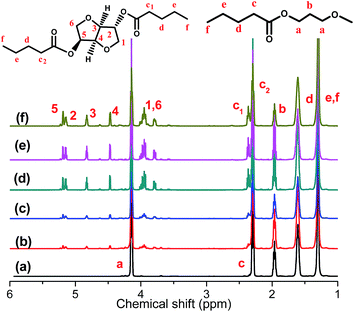 |
| | Fig. 1 1H-NMR of P(PSe-co-IS) copolymers: (a) PPSe, (b) P(PSe-co-11.7 mol% IS), (c) P(PSe-co-19.1 mol% IS), (d) P(PSe-co-27.9 mol% IS), (e) P(PSe-co-38.2 mol% IS), (f) P(PSe-co-52.9 mol% IS). | |
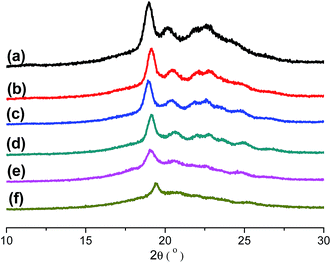 |
| | Fig. 2 WAXD patterns of P(PSe-co-IS) copolymers: (a) PPSe, (b) P(PSe-co-11.7 mol% IS), (c) P(PSe-co-19.1 mol% IS), (d) P(PSe-co-27.9 mol% IS), (e) P(PSe-co-38.2 mol% IS), (f) P(PSe-co-52.9 mol% IS). | |
3.2 Thermal properties of copolymers
DSC measurements are carried out to study the thermal properties of P(PSe-co-IS) copolymers. Fig. 3(a) shows the cooling curves of neat PPSe and its copolymers at 10 °C min−1 from the melt. PPSe shows a sharper crystallization peak, however, with the increase of IS content, the crystallization peak becomes broader, and almost disappears when the content of IS reach 50 mol%, which indicate that the crystallization process of PPSe is significantly retarded by the large steric hindrance of the asymmetric bicyclic structure of IS. Crystallization temperature (Tc) and crystallization enthalpy (ΔHc) obtained from DSC are summarized in Table 2. According to our previous study, Tc, ΔHc and Tm of PDS are 62.3 °C, 125.4 J g−1, and 75.8 °C, respectively, while that of PPSe decease to 22.8 °C, 52.6 J g−1, and 54.7 °C, respectively.31 The reasons for the reduced values of PPSe are ascribed to the low chain flexibility and the unregularly chain packing. PDS, containing even number of carbon atoms per repeat unit, is easier to adopt an excellent crystalline packing, which will result in higher crystallization and melting temperatures. However, for PPSe, the number of methylene units per repeat unit is odd, it is difficult for the crystal structure to adopt a regular chain arrangement, which consequently lead to the lower crystallization and melting points. In conclusion, the chemical structure plays an important role in determining the crystallization and melting mechanisms of polyesters. Additionally, the crystallization temperature of neat PPSe is 22.8 °C, while that of its copolymers decrease from 19.2 to −38.8 °C with the increment of IS. The values of ΔHc also decrease rapidly from 52.6 J g−1 to 8.6 J g−1 with IS content increasing to 50 mol%, suggesting that the motion of PPSe segments are restricted due to the large steric hindrance of IS.
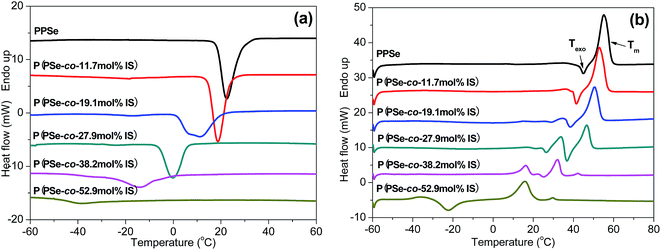 |
| | Fig. 3 DSC cooling (a) and 2nd heating (b) of P(PSe-co-IS) copolymers by 10 °C min−1. | |
Table 2 Thermal parameters of P(PSe-co-IS) copolymers
| Sample |
Tc (°C) |
ΔHc (J g−1) |
Tm (°C) |
Td,5% (°C) |
Td,max (°C) |
Td,95% (°C) |
| PPSe |
22.8 |
52.6 |
54.7 |
380 |
414 |
460 |
| P(PSe-co-11.7 mol% IS) |
19.2 |
54.8 |
52.4 |
384 |
417 |
466 |
| P(PSe-co-19.1 mol% IS) |
11.5 |
44.5 |
50.2 |
381 |
419 |
464 |
| P(PSe-co-27.9 mol% IS) |
−0.45 |
35.4 |
46.6 |
384 |
420 |
468 |
| P(PSe-co-38.2 mol% IS) |
−14.1 |
25.2 |
31.9 |
384 |
420 |
468 |
| P(PSe-co-52.9 mol% IS) |
−38.8 |
8.6 |
15.9 |
385 |
422 |
470 |
The subsequent melting curves of the P(PSe-co-IS) copolymers are presented in Fig. 3(b). Obviously, Tm decrease with an increase of IS content and only one melting peak for PPSe can be detected. With the increases of IS content, another melting peak appears before the high-temperature melting peak suggesting that “melting–recrystallization–melting” behavior occurs in melting process, especially for P(PSe-co-19.1 mol% IS) and P(PSe-co-27.9 mol% IS). Moreover, an exothermic peak (Texo) prior to Tm is found for all the P(PSe-co-IS) copolymers, Texo shifts to lower temperature and disappears finally when the content of IS reach 30 mol%, which is attributed to the recrystallization of the melting of the crystals with low thermal stability due to the retard effects of IS.42 The existence of cold crystallization peak in P(PSe-co-52.9 mol% IS) undoubtedly verifies our explanation on the hindering effects of IS. All the parameters have been listed in Table 2. In addition to Tc, the values of Tm are also found to be dependent on the content of IS. Tm are depressed with increasing IS content, which is consistent with the trend of Tc.
In order to analyze the effect of isosorbide on the thermal stability of PPSe matrix, TGA is operated to investigate the thermal degradation of P(PSe-co-IS) copolymers with the degradation temperature at 5% weight loss (Td,5%), the degradation temperature at 95% weight loss (Td,95%), the maximum decomposition temperature (Td,max) are recorded. Fig. 4 shows the TGA and DTG curves of P(PSe-co-IS) copolymers and the results are shown in Table 2. From Fig. 4(a), we can see that all copolymers show the one-stage decomposition. More importantly, no obvious weight loss occurs until about 350 °C, suggesting P(PSe-co-IS) copolymers have relatively good thermal stability. The degradation temperature at 5% weight loss of PPSe is 380 °C, while that of P(PSe-co-52.9 mol% IS) increases to 385 °C with the IS content increases from 0 to 50 mol%. Furthermore, the degradation temperature at 95% weight loss and the maximum decomposition temperature are also improved about 10 and 8 °C, respectively. It can be concluded that the incorporation of IS improves the thermal stability of the copolymers compared with PPSe.
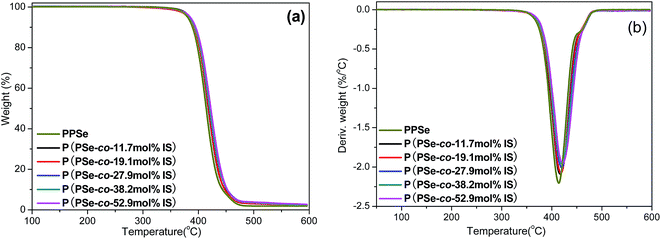 |
| | Fig. 4 TGA (a) and DTG (b) curves of P(PSe-co-IS) copolymers. | |
3.3 Isothermal crystallization kinetics
As is known, crystallization plays an important role in determining the properties of the final products. Thus, it is important to investigate the crystallization behaviors of P(PSe-co-IS) copolymers in detail. Isothermal crystallization kinetics of copolymers with IS content lower than 30 mol% is investigated by differential scanning calorimetry at different temperature intervals. The crystallization exotherms for PPSe and P(PSe-co-27.9 mol% IS) are shown in Fig. 5 (other curves are show in Fig. S1†). On one hand, with increasing crystallization temperatures, the crystallization peaks become broader and the crystallization time become longer gradually, which indicates that the rate of the crystallization is reduced; On the other hand, the interval of isothermal crystallization for PPSe is 34–40 °C, while that of P(PSe-co-27.9 mol% IS) obviously shifts to the lower temperature. At this point, there is no doubt that the addition of IS hinder the crystallization process of PPSe. Obviously, the bulky and asymmetric structure of IS disrupts the chain regularity and restricts the chain mobility of PPSe segments, consequently, resulting in the depression of polymer crystallization. As discussed in our previous study, the interval of isothermal crystallization for PDS is approximately 62–66 °C, which is quite higher than that of PPSe.31 This difference may be attributed to the faster crystallization rate of long chains of PDS, thanks to the higher flexibility of the chain with long methylene sequences.
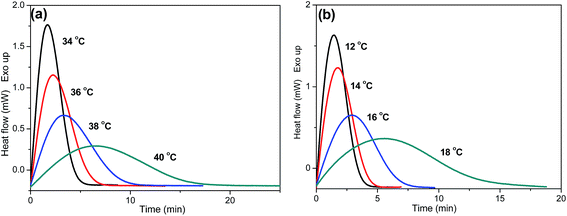 |
| | Fig. 5 DSC thermograms of isothermal crystallization at different temperatures: (a) PPSe, (b) P(PSe-co-27.9 mol% IS). | |
Based on the assumption that the evolution of crystallinity is linearly proportional to the evolution of heat released during the crystallization, the relative degree of crystallinity, Xt, is determined as follows:43
| |
 | (2) |
where d
Hc/d
t is the rate of heat flow.
Xt(
t) and
Xt(∞) represent the absolute crystallinity at the elapsed time during the course of crystallization and at the end of the crystallization process, respectively.
Fig. 6 shows the relative degree of crystallinity with time for isothermal crystallization at different temperatures of PPSe and P(PSe-
co-27.9 mol% IS). All curves (the rest are shown in Fig. S2
†) show the similar S-shape. More time is needed to complete the crystallization process with the temperature increases, which is consistent with the results that described in
Fig. 5. The value of
t1/2, half time of crystallization at 50% relative crystallinity, is always used to evaluate the crystallization rate of polymers. Generally speaking, the longer the
t1/2 is, the slower the crystallization processes. All
t1/2 values have been shown in
Table 3. It is evidently found that the values of
t1/2 decreases with the temperature increases. For P(PSe-
co-11.7 mol% IS) and P(PSe-
co-19.1 mol% IS), at the given temperature (
e.g. 34, 36 °C), the values of
t1/2 are larger than that of neat PPSe, suggesting that the incorporation of IS has a retard impact on the crystallization process.
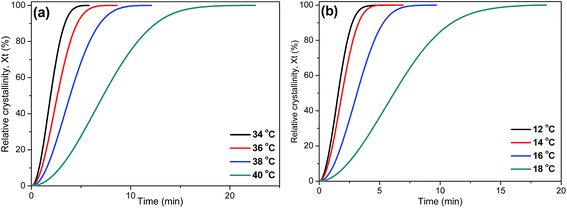 |
| | Fig. 6 Relative degree of crystallinity with time for isothermal crystallization at different temperatures: (a) PPSe, (b) P(PSe-co-27.9 mol% IS). | |
Table 3 Results of the Avrami analysis for isothermal crystallization of P(PSe-co-IS) copolymers
| Sample |
Tc (oC) |
k (min−n) |
t1/2 (min) |
n |
n′a |
| Average value of n. |
| PPSe |
34 |
0.444 |
1.21 |
2.33 |
2.14 |
| 36 |
0.273 |
1.53 |
2.23 |
| 38 |
0.136 |
2.18 |
2.10 |
| 40 |
0.062 |
3.58 |
1.89 |
| P(PSe-co-11.7 mol% IS) |
34 |
0.211 |
1.80 |
2.04 |
2.09 |
| 36 |
0.077 |
2.95 |
2.04 |
| 38 |
0.013 |
7.15 |
2.04 |
| 40 |
0.002 |
15.6 |
2.22 |
| P(PSe-co-19.1 mol% IS) |
30 |
0.121 |
2.47 |
1.93 |
2.01 |
| 32 |
0.067 |
3.28 |
1.97 |
| 34 |
0.021 |
5.67 |
2.01 |
| 36 |
0.003 |
12.4 |
2.12 |
| P(PSe-co-27.9 mol% IS) |
12 |
0.326 |
1.42 |
2.18 |
2.21 |
| 14 |
0.198 |
1.77 |
2.22 |
| 16 |
0.062 |
2.92 |
2.28 |
| 18 |
0.021 |
5.21 |
2.15 |
More importantly, further study need to be processed on isothermal crystallization kinetics. Avrami model is frequently used as an important method to describe the isothermal kinetics for many polymers.43–45 Just as the theory depicted, the relative crystallinity is a function of time, then the Avrami equation can be defined as follow:
where
n is the Avrami exponent depending on the mechanism of nucleation and the growth geometry of crystals, and
k is a rate constant on crystallization, which is related to nucleation. Furthermore, the Avrami equation can be modified as:
| |
ln[−ln(1 − Xt)] = ln![[thin space (1/6-em)]](https://www.rsc.org/images/entities/char_2009.gif) k + n k + n![[thin space (1/6-em)]](https://www.rsc.org/images/entities/char_2009.gif) ln ln![[thin space (1/6-em)]](https://www.rsc.org/images/entities/char_2009.gif) t t
| (4) |
The Avrami plots of ln[−ln(1 − Xt)] versus ln![[thin space (1/6-em)]](https://www.rsc.org/images/entities/char_2009.gif) t for isothermal crystallization of P(PSe-co-IS) copolymers at different temperatures are illustrated in Fig. 7 and Fig. S3.† Good linearity reveals that Avrami equation could explain the isothermal crystallization process of the copolymers well. From the slope and the intercept of the Avrami plots, the parameters k and n, respectively, are estimated and summarized in Table 3. Decreasing the supercooling (difference between Tom and Tc), the values of k decrease obviously, which indicates that the crystallization process is hindered. Both PPSe and its copolymers show the analogous trend. However, Tc varies for all the copolymers while n values change little. The values range from 2.01 to 2.21, indicate the two and three-dimensional growth of the crystal growth.
t for isothermal crystallization of P(PSe-co-IS) copolymers at different temperatures are illustrated in Fig. 7 and Fig. S3.† Good linearity reveals that Avrami equation could explain the isothermal crystallization process of the copolymers well. From the slope and the intercept of the Avrami plots, the parameters k and n, respectively, are estimated and summarized in Table 3. Decreasing the supercooling (difference between Tom and Tc), the values of k decrease obviously, which indicates that the crystallization process is hindered. Both PPSe and its copolymers show the analogous trend. However, Tc varies for all the copolymers while n values change little. The values range from 2.01 to 2.21, indicate the two and three-dimensional growth of the crystal growth.
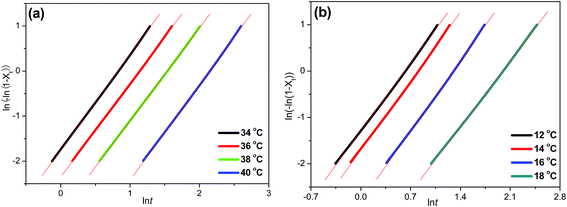 |
| | Fig. 7 Avrami plots of ln[−ln(1 − Xt)] versus ln![[thin space (1/6-em)]](https://www.rsc.org/images/entities/char_2009.gif) t for isothermal crystallization: (a) PPSe, (b) P(PSe-co-27.9 mol% IS). t for isothermal crystallization: (a) PPSe, (b) P(PSe-co-27.9 mol% IS). | |
3.4 Multiple melting behavior and equilibrium melting point
Subsequent melting behavior of P(PSe-co-IS) copolymers are further studied by differential scanning calorimetry. Fig. 8 shows the melting curves recorded at 5 °C min−1 of PPSe and its copolymers after isothermal crystallization at the indicated temperatures. As shown in Fig. 8, compared with the single melting peak of PPSe, that of P(PSe-co-27.9 mol% IS) shows multiple melting peaks. The addition of IS disrupts the chain regularity of PPSe, thus, lots of imperfect crystals formed which lead to the multiple melting peaks. As shown in Fig. S4,† P(PSe-co-11.7 mol% IS) and P(PSe-co-19.1 mol% IS) also show the similar trend. These four appearing characteristic peaks of P(PSe-co-27.9 mol% IS) in Fig. 8(b) are labeled as Ta, Tm1, Texo, Tm2, respectively. The first endothermic peak (Ta) is weak but always appears at approximate 5–6 °C higher than Tc. This is the typical characteristic of an “annealing peak”. It has been widely accepted that the annealing peak is owing to the melting of secondary crystals formed during the long-time annealing in isothermal crystallization process.46 Tm1 and Texo increase with the isothermal crystallization temperature increases while Tm2 almost constant, which could be ascribe to the “melting–recrystallization–melting” model. Tm1 is attributed to the melting of crystals formed at isothermal crystallization process, while melting of crystals formed through the recrystallization results in the appearance of Tm2. Through the recrystallization process, the perfection and stability of crystals have been improved largely which can explain why Tm2 are independent of crystallization temperatures. As shown in ref. 31, although the crystallization rate is reduced by the introduction of IS containing chain segment, multiple melting behavior is still not observed in its copolymers due to the higher crystallization capacity of PDS chains. However, compared with long carbon chain 1,10-decanediol, 1,3-propanediol is expected to make its polyesters possess low crystallization capacity and low melting point, which are caused by the fact that the existence of odd number of methylene units makes it impossible for chain segment to adopt an excellent packing and additionally, the ability of segment motion of short chain aliphatic polyesters is lower than that of long chain analogues.
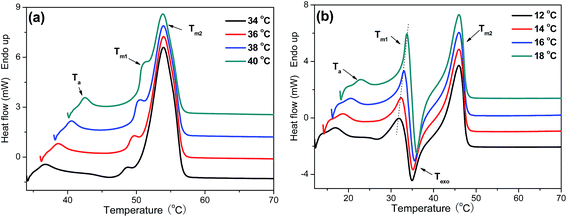 |
| | Fig. 8 DSC heating scans recorded at 5 °C min−1 of (a) PPSe and (b) P(PSe-co-27.9 mol% IS) after isothermal crystallization at indicated temperatures. | |
Like many other semi-crystalline polymers,47–52 PPSe also shows the multiple melting peaks which can be explained by the “melting–recrystallization–remelting” theory according to the early studies reported by Papageorgioua.8,53 Interpretations for the multiple melting behavior are mainly as follows: (a) melting of crystals with different lamellar thickness, perfection or stability, (b) melting–recrystallization–remelting processes, (c) physical aging and/or relaxation of the rigid amorphous fraction, (d) different molecular weight species.16,54,55 In order to probe the melting mechanism of P(PSe-co-IS) copolymers, TMDSC is conducted to analyze the melting behaviors. TMDSC, which applies a small sinusoidal oscillation (modulation) on the conventional linear heating programmer, is a very powerful technique to detect the multiply melting behaviors of polymers. Compared with the heating curves tested by traditional DSC, the new technology can separate the total heat flow (THF) into the heat capacity-related reversible heat flow (RHF) and the kinetic-related heat flow (NHF). This thermal analysis technique has been used in our previous research to investigate the origin of annealing peak of PLLA.56 Exothermic peaks can only be detected in the nonreversible part, while endothermic peak appears in both parts. Namely, crystallization and recrystallization process can be easily separated from reversible melting events.56–58 As shown in Fig. 9(a), there is only one melting peak and one obvious crystallization peak detected in the reversible and nonreversible part, respectively, which determines the existence of melting–recrystallization–melting process. Unlike neat PPSe, there are two crystallization peaks detected in the nonreversible heat flow curve of P(PSe-co-27.9 mol% IS) (Fig. 9(b)). One, located after the low-temperature melting peak corresponding to the melting of the crystallites with low thermal stability can be seen in both total heat flow and reversible heat flow. Another one, which is attributed to the reorganization of the crystallites with high thermal stability, locates before the final melting peaks. These two crystallization peaks, on one hand, imply the existence of melting–recrystallization–melting process; on the other hand, indicate that the crystallization ability of PPSe is retarded with the introduction of IS.
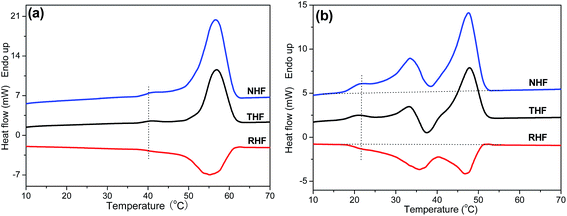 |
| | Fig. 9 Total heat flow (THF), reversible heat flow (RHF), and nonreversible heat flow (NHF) curves in TMDSC traces for (a) PPSe pre-crystallized at 38 °C for 30 min and (b) P(PSe-co-27.9 mol% IS) pre-crystallized at 16 °C for 30 min. Heating rate was 3 °C min−1 with a modulation amplitude of 0.5 °C in a period of 60 s. | |
Equilibrium melting point (Tom) is an important parameter to evaluate the crystallization kinetics of semi-crystalline polymers; however, it is difficult to reach the final thermodynamic state in existing experiment conditions. It should be noted that Tm is affected not only by the thermodynamic factors but also by the morphological factors such as crystalline lamellar thickness.59 Thus, we can obtain Tom from the values of Tm according to the Hoffman–Weeks equation. For a better understanding of the retard effect of IS on the crystallization an melting behaviors of PPS, equilibrium melting points of P(PSe-co-IS) copolymers are further investigated by DSC. Hoffman and Weeks have proposed an equation, which combine the observed melting point Tm with the isothermal crystallization temperature Tc to describe the equilibrium melting point.42,59–61 The method is given as following:
| |
 | (5) |
where
Tm is the observed melting temperature of a crystal formed at
Tc;
γ is the ratio of final to initial lamellar thickness. Thus, plotting the
Tm as a function of
Tc, we can get a line.
Tom can be obtained from intersection of this extrapolating line with the
Tm =
Tc line.
Fig. 10 describes the dependence of melting point on crystallization temperature of P(PSe-
co-IS) copolymers. The results have been listed in
Table 3. It is clearly see that the values of
Tom are 58.0, 56.6, 54.9 and 39.8 °C for PPSe, P(PSe-
co-11.7 mol% IS), P(PSe-
co-19.1 mol% IS) and P(PSe-
co-27.9 mol% IS), respectively.
Tom decreases with the increase of IS content, suggesting that the melting point of PPSe is depressed by the introduction of IS, especially at the content of 30 mol%.
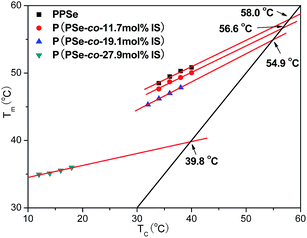 |
| | Fig. 10 Dependence of melting point on crystallization temperature of P(PSe-co-IS) copolymers. | |
3.5 Spherulitic morphology and growth rate
In the previous section, we have investigated the effects of crystallization temperature and copolymer composition on the crystallization kinetics of P(PSe-co-IS) copolymers, so it is interesting to study how these aforementioned factors influence the spherulitic morphologies since the spherulitic morphology and spherulite size could significantly affect the physical properties of biodegradable crystalline polymers.59,61 Therefore, we studied the effect of crystallization temperature and copolymer composition on the spherulitic morphologies of P(PSe-co-IS) copolymers systemically. Fig. 11 displays spherulitic morphologies of P(PSe-co-IS) copolymers with different composition crystallized at the indicated temperatures. As a whole, all the spherulites show the characteristic “Maltese cross” patterns regardless of the copolymer composition and the crystallization temperature. Moreover, with decreasing supercooling, the number of spherulites decreases while the size of spherulites increases. It is well known that the nucleation becomes difficult at high crystallization temperature. Additionally, at the indicated Tc, the spherulite sizes of neat PPSe are larger than those of its copolymers. The decreased size suggesting that growth rate is depressed by the large hindrance of IS.
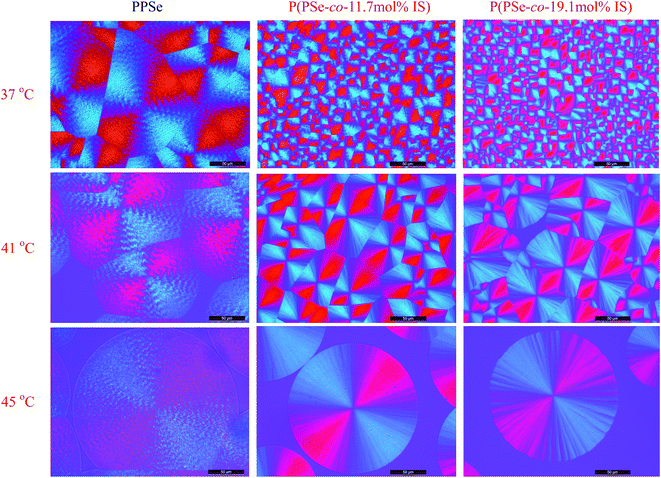 |
| | Fig. 11 Spherulitic morphology of P(PSe-co-IS) copolymers with different composition crystallized at the indicated temperatures (scale bar = 50 μm). | |
Generally speaking, “Maltese cross” patterns are most common. However, several interesting spherulitic patterns, such as ring-bands and dendritic types, form only under certain conditions.62 Ring-banded spherulites have been commonly observed for 1,3-propanediol-based polyesters, such as poly(propylene suberate), poly(propylene terephthalate), poly(butylene succinate-co-propylene succinate) copolyesters.8,63,64 As expected, ring-banded spherulites are also observed for PPSe in the wide temperature range in Fig. 11. The folding of the molecular chain plays an important role in the growth of lamellae, and consequently, with the growth of lamellae, the unbalanced surface-stress drives the lamellar twisting to yield bands in the spherulites.63 More interestingly, it can be noticed that the ring-banded spherulites disappear for P(PSe-co-IS) copolymers with the introduction of isosorbide-containing segment. It may be attributed that the rigid structure of isosorbide, which causes restricted lamellar twisting and scrolling of PPSe segments.65 The spherulites of PDS have a needle-like structure, which develops radially and with an extinction pattern in the form of a Maltese cross. Furthermore, no evidence of ring-banded spherulites could be detected for long chain PDS in a wide temperature range. In addition, ring-banded spherulites are commonly observed in short chain aliphatic polyesters, however, whether the length of the carbon chain will influence the spherulitic morphologies is still an open question.31,66
Furthermore, the growth rate of P(PSe-co-IS) copolymers with IS content lower than 30 mol% is measured. Fig. 12 shows the spherulitic growth rates of P(PSe-co-IS) copolymers with different composition at different temperatures. As shown in Fig. 12, all the curves exhibit a bell shape in a wide crystallization temperature range, which is common in crystalline polymers.51,59,67 The value for the maximum rate of PPSe is around 42 °C, while that of P(PSe-co-11.7 mol% IS) and P(PSe-co-19.1 mol% IS) are 35 and 33 °C, respectively. At the given Tc, with the increases of IS content, the growth rate decreases, which indicates that the crystallization capacity of PPSe is hindered due to the diluent effect and the hindering effect of IS. The crystallizable PPSe segment of the copolymer seems located in melts of the non-crystallizable isosorbide-containing segment, which reduces the number of crystallizable segments on the front of the growing spherulite.68 In brief, the large hindrance of IS, which restricts the motion of PPSe chains, and the dropping driving force (e.g. supercooling) are the main factors that can be used to explain why the growth rate of P(PSe-co-IS) copolymers is reduced.
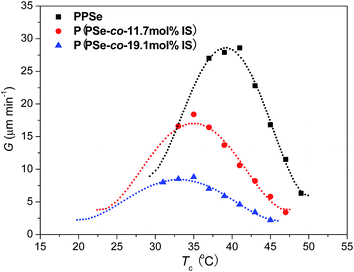 |
| | Fig. 12 Spherulitic growth rates of P(PSe-co-IS) copolymers with different composition at different temperatures. | |
4. Conclusions
Novel isosorbide-containing biodegradable copolymers poly(propylene sebacate-co-isosorbide sebacate) (P(PSe-co-IS)) are synthesized by melt-polycondensation. The effects of IS on crystallization and melting behaviors of P(PSe-co-IS) copolymers are systemically studied by DSC, WAXD and POM. With the increases of IS, crystallization ability of P(PSe-co-IS) copolymers is retarded obviously due to the large hindrance of asymmetric IS. The crystallization temperature, melting temperature and equilibrium melting temperature are depressed, which is result from the bulky rigid structure of IS. Isothermal crystallization kinetics reveal that crystallization rates are retarded with the increase of crystallization temperature and IS content, which could be caused by the decreasing supercooling and large hindrance of IS. However, the crystallization mechanism remains unchanged despite crystallization temperature and the introduced composition. Compared with the single melting peak of neat PPSe, which may be as a result of the high crystallization capacity of long chain aliphatic polyester, that of P(PSe-co-IS) copolymers show multiple peaks due to the rigidity of IS, which is originated from the “melting–recrystallization–melting” process. At the given temperature, growth rates of P(PSe-co-IS) copolymers are lower than that of neat PPSe, that's to say, the incorporation of IS depresses the growth rates of spherulites due to the diluent effect and the hindering effect of IS. All spherulites show the characteristic “Maltese cross” patterns regardless of the copolymer composition and the crystallization temperature, but ring-banded morphology is detected only for neat PPSe in a wide temperature range. No obvious ring-banded spherulites could be detected for P(PSe-co-IS) copolymers due to the hindering effect and specific chain structure of isosorbide-containing segment.
Acknowledgements
This study was financially supported by the National Program on Key Basic Research, Project (973 Program No. 2015CB654700 (2015CB674701)) and the National Science Foundation of China (Nos 31000427, 21034001, and 21174021).
Notes and references
- G. Z. Papageorgioua, D. N. Bikiaris, D. S. Achilias, E. Papastergiadisb and A. Docoslisc, Thermochim. Acta, 2011, 515, 13–23 CrossRef PubMed.
- I. S. Ristic, N. Vukic, S. Cakic, V. Simendic, O. Ristic and J. B. Simendic, J. Polym. Environ., 2012, 20, 519–527 CrossRef CAS.
- D. N. Bikiaris, G. Z. Papageorgiou, D. J. Giliopoulos and C. A. Stergiou, Macromol. Biosci., 2008, 8, 728–740 CrossRef CAS PubMed.
- H. S. Park, J. Seo, H. Y. Lee, H. W. Kim, I. B. Wall, M. S. Gong and J. C. Knowles, Acta Biomater., 2012, 8, 2911–2918 CrossRef CAS PubMed.
- K. R. Yoon, S. P. Hong, B. Kong and I. S. Choi, Synth. Commun., 2012, 42, 3504–3512 CrossRef CAS PubMed.
- A. Patel, A. K. Gaharwar, G. Iviglia, H. B. Zhang, S. Mukundan, S. M. Mihaila, D. Demarchi and A. Khademhosseini, Biomaterials, 2013, 34, 3970–3983 CrossRef CAS PubMed.
- X. H. Kong, H. Qi and J. M. Curtis, J. Appl. Polym. Sci., 2014, 131, 40579 Search PubMed.
- G. Z. Papageorgioua and C. Panayiotoub, Thermochim. Acta, 2011, 523, 187–199 CrossRef PubMed.
- E. Ranucci, Y. Liu, M. S. Lindblad and A. C. Albertsson, Macromol. Rapid Commun., 2000, 21, 680–684 CrossRef CAS.
- N. Kolba, M. Winklera, C. Syldatk and M. A. R. Meier, Eur. Polym. J., 2014, 51, 159–166 CrossRef PubMed.
- F. Stempfle, B. S. Ritter, R. Mülhaupt and S. Mecking, Green Chem., 2014, 16, 2008–2014 RSC.
- G. Z. Papageorgioua, D. N. Bikiaris, D. S. Achilias, S. Nanaki and N. Karagiannidis, J. Polym. Sci., Part B: Polym. Phys., 2010, 48, 672–686 CrossRef PubMed.
- Y. Chandorkar, G. Madrasb and B. Basu, J. Mater. Chem. B, 2013, 1, 865–875 RSC.
- J. C. Tang, Z. G. Zhang, Z. F. Song, L. R. Chen, X. Hou and K. D. Yao, Eur. Polym. J., 2006, 42, 3360–3366 CrossRef CAS PubMed.
- H. Y. Lu, S. F. Lu, M. Chen, C. H. Chen and C. J. Tsai, J. Appl. Polym. Sci., 2009, 113, 876–886 CrossRef CAS PubMed.
- G. Z. Papageorgiou and D. N. Bikiaris, Polymer, 2005, 46, 12081–12092 CrossRef CAS PubMed.
- Z. G. Qi, Y. R. Tang, J. Xu, J. N. Chen and B. H. Guo, Polym. Compos., 2013, 34, 1126–1135 CrossRef CAS PubMed.
- C. H. Chen, H. Y. Lu, M. Chen, J. S. Peng, C. J. Tsai and C. S. Yang, J. Appl. Polym. Sci., 2009, 111, 1433–1439 CrossRef CAS PubMed.
- F. X. Li, S. G. Luo and J. Y. Yu, J. Polym. Res., 2010, 17, 279–287 CrossRef CAS.
- Z. C. Liang, P. J. Pan, B. Zhu and Y. Inoue, Polymer, 2011, 52, 2667–2676 CrossRef CAS PubMed.
- J. B. Zeng, Q. Y. Zhu, X. Lu, Y. S. He and Y. Z. Wang, Polym. Chem., 2012, 3, 399–408 RSC.
- H. Y. Lu, S. F. Lu, M. Chen, C. S. Yang, C. H. Chen and C. J. Tsai, J. Polym. Sci., Part B: Polym. Phys., 2008, 46, 2431–2442 CrossRef CAS PubMed.
- S. Gestí, A. Almontassir, M. T. Casas and J. Puiggalı, Polymer, 2004, 45, 8845–8861 CrossRef PubMed.
- X. Y. Li, Z. F. Hong, J. Sun, Y. Geng, Y. J. Huang, H. N. An, Z. Ma, B. J. Zhao, C. G. Shao, Y. P. Fang, C. L. Yang and L. B. Li, J. Phys. Chem. B, 2009, 113, 2695–2704 CrossRef CAS PubMed.
- Z. C. Liang, P. J. Pan, B. Zhu, T. Dong, L. Hua and Y. Inoue, Macromolecules, 2010, 43, 2925–2932 CrossRef CAS.
- C. J. Tsai, W. C. Chang, C. H. Chen, H. Y. Lu and M. Chen, Eur. Polym. J., 2008, 44, 2339–2347 CrossRef CAS PubMed.
- C. P. Roupakias, D. N. Bikiaris and G. P. Karayannidis, J. Polym. Sci., Part A: Polym. Chem., 2005, 43, 3998–4011 CrossRef CAS PubMed.
- C. P. Roupakias, G. Z. Papageorgiou and G. P. Karayannidis, J. Macromol. Sci., Pure Appl. Chem., 2003, A40, 791–805 CrossRef CAS PubMed.
- S. S. Umare, A. S. Chandure and R. A. Pandey, Polym. Degrad. Stab., 2007, 92, 464–479 CrossRef CAS PubMed.
- M. Soccio, N. Lotti, L. Finelli, M. Gazzano and A. Munari, Polymer, 2007, 48, 3125–3136 CrossRef CAS PubMed.
- Z. Wei, C. Zhou, Y. Yu and Y. Li, RSC Adv., 2015, 5, 42777–42788 RSC.
- F. Fenouillot, A. Rousseau, G. Colomines, R. Saint-Loup and J. P. Pascault, Prog. Polym. Sci., 2010, 35, 578–622 CrossRef CAS PubMed.
- J. Łukaszczyk, B. Janicki and M. Kaczmarek, Eur. Polym. J., 2011, 47, 1601–1606 CrossRef PubMed.
- X. H. Feng, A. J. Easta, W. B. Hammonda, Y. Zhang and M. Jaffe, Polym. Adv. Technol., 2011, 22, 139–150 CrossRef CAS PubMed.
- M. Garaleh, T. Yashiro, H. R. Kricheldorf, P. Simon and S. Chatti, Macromol. Chem. Phys., 2010, 211, 1206–1214 CrossRef CAS PubMed.
- B. A. J. Noordover, V. G. van Staalduinen, R. Duchateau, C. E. Koning, R. A. T. M. van Benthem, M. Mak, A. Heise, A. E. Frissen and J. van Haveren, Biomacromolecules, 2006, 7, 3406–3416 CrossRef CAS PubMed.
- D. Juais, A. F. Naves, C. Li, R. A. Gross and L. H. Catalani, Macromolecules, 2010, 43, 10315–10319 CrossRef CAS.
- F. Pion, P. H. Ducrot and F. Allais, Macromol. Chem. Phys., 2014, 215, 431–439 CrossRef CAS PubMed.
- I. Barbara, A. L. Flourat and F. Allais, Eur. Polym. J., 2015, 62, 236–243 CrossRef CAS PubMed.
- M. Z. Oulame, F. Pion, S. Allauddin, K. V. S. N. Raju, P. H. Ducrot and F. Allais, Eur. Polym. J., 2015, 63, 186–193 CrossRef CAS PubMed.
- F. Pion, A. F. Reano, M. Z. Oulame, I. Barbara, A. L. Flourat, P. H. Ducrot and F. Allais, ACS Symp. Ser., 2015, 1192, 41–68 CrossRef CAS PubMed.
- Y. Yang and Z. Qiu, CrystEngComm, 2011, 13, 2408–2417 RSC.
- Z. Wei, G. Chen, Y. Shi, P. Song, M. Zhan and W. Zhang, J. Polym. Res., 2012, 19, 9930–9940 CrossRef.
- X. Liu, C. Li, D. Zhang and Y. Xiao, J. Polym. Sci., Part B: Polym. Phys., 2006, 44, 900–913 CrossRef CAS PubMed.
- H. Han, X. Wang and D. Wu, J. Chem. Technol. Biotechnol., 2013, 88, 1200–1211 CrossRef CAS PubMed.
- P. Pan, L. Zhao, J. Yang and Y. Inoue, Macromol. Mater. Eng., 2013, 298, 201–209 CrossRef CAS PubMed.
- Y. Kong and J. N. Hay, Polymer, 2003, 44, 623–633 CrossRef CAS.
- P. Srimoaon, N. Dangseeyun and P. Supaphol, Eur. Polym. J., 2004, 40, 599–608 CrossRef CAS PubMed.
- G. Y. Wang and Z. B. Qiu, Ind. Eng. Chem. Res., 2012, 51, 16369–16376 CrossRef CAS.
- H. Wu and Z. B. Qiu, Ind. Eng. Chem. Res., 2012, 51, 13323–13328 CrossRef CAS.
- G. F. Shan, X. Gong, W. P. Chen, L. Chen and M. F. Zhu, Colloid Polym. Sci., 2011, 289, 1005–1014 CAS.
- X. Wang, J. Zhou and L. Li, Eur. Polym. J., 2007, 43, 3163–3170 CrossRef CAS PubMed.
- G. Z. Papageorgiou, D. S. Achilias and D. N. Bikiaris, Macromol. Chem. Phys., 2009, 210, 90–107 CrossRef CAS PubMed.
- L. M. W. K. Gunaratne and R. A. Shanks, Eur. Polym. J., 2005, 41, 2980–2988 CrossRef CAS PubMed.
- P. Song, G. Chen, Z. Wei, W. Zhang and J. Liang, J. Therm. Anal. Calorim., 2013, 111, 1507–1514 CrossRef CAS.
- Z. Wei, P. Song, C. Zhou, G. Chen, Y. Chang, J. Li, W. Zhang and J. Liang, Polymer, 2013, 54, 3377–3384 CrossRef CAS PubMed.
- J. Zhang, F. Li and J. Yu, J. Therm. Anal. Calorim., 2013, 111, 711–715 CrossRef CAS.
- Z. Qiu, M. Komurab, T. Ikehara and T. Nishi, Polymer, 2013, 44, 7781–7785 CrossRef PubMed.
- H. Wu and Z. Qiu, CrystEngComm, 2012, 14, 3586–3595 RSC.
- C. Zhou, Z. Wei, Y. Yu and Y. Li, J. Therm. Anal. Calorim., 2015, 120, 1799–1810 CrossRef CAS.
- G. C. Liu, J. B. Zeng, C. L. Huang, L. Jiao, X. L. Wang and Y. Z. Wang, Ind. Eng. Chem. Res., 2013, 52, 1591–1599 CrossRef CAS.
- E. M. Woo and Y. F. Chen, Polymer, 2009, 50, 4706–4717 CrossRef CAS PubMed.
- H. B. Chen, L. Chen, Y. Zhang, J. J. Zhang and Y. Z. Wang, Phys. Chem. Chem. Phys., 2011, 13, 11067–11075 RSC.
- Y. X. Xu, J. Xu, B. H. Guo and X. M. Xie, J. Polym. Sci., Part B: Polym. Phys., 2007, 45, 420–428 CrossRef CAS PubMed.
- Z. Wei, P. Song, L. Sang, K. Liu, C. Zhou, Y. Wang and Y. Li, Polymer, 2014, 55, 2751–2760 CrossRef CAS PubMed.
- A. Celli, G. Barbiroli, C. Berti, D. C. Francesco, C. Lorenzetti, P. Marchese and E. Marianucci, J. Polym. Sci., Part B: Polym. Phys., 2007, 45, 1053–1067 CrossRef CAS PubMed.
- X. Wen, X. Lu, Q. Peng, F. Zhu and N. Zheng, J. Therm. Anal. Calorim., 2012, 109, 959–966 CrossRef CAS.
- H. B. Chen, J. B. Zeng, X. Dong, L. Chen and Y. Z. Wang, CrystEngComm, 2013, 15, 2688–2698 RSC.
Footnote |
| † Electronic supplementary information (ESI) available. See DOI: 10.1039/c5ra13177d |
|
| This journal is © The Royal Society of Chemistry 2015 |
Click here to see how this site uses Cookies. View our privacy policy here. 


![[thin space (1/6-em)]](https://www.rsc.org/images/entities/char_2009.gif) k + n
k + n![[thin space (1/6-em)]](https://www.rsc.org/images/entities/char_2009.gif) ln
ln![[thin space (1/6-em)]](https://www.rsc.org/images/entities/char_2009.gif) t
t
![[thin space (1/6-em)]](https://www.rsc.org/images/entities/char_2009.gif) t for isothermal crystallization of P(PSe-co-IS) copolymers at different temperatures are illustrated in Fig. 7 and Fig. S3.† Good linearity reveals that Avrami equation could explain the isothermal crystallization process of the copolymers well. From the slope and the intercept of the Avrami plots, the parameters k and n, respectively, are estimated and summarized in Table 3. Decreasing the supercooling (difference between Tom and Tc), the values of k decrease obviously, which indicates that the crystallization process is hindered. Both PPSe and its copolymers show the analogous trend. However, Tc varies for all the copolymers while n values change little. The values range from 2.01 to 2.21, indicate the two and three-dimensional growth of the crystal growth.
t for isothermal crystallization of P(PSe-co-IS) copolymers at different temperatures are illustrated in Fig. 7 and Fig. S3.† Good linearity reveals that Avrami equation could explain the isothermal crystallization process of the copolymers well. From the slope and the intercept of the Avrami plots, the parameters k and n, respectively, are estimated and summarized in Table 3. Decreasing the supercooling (difference between Tom and Tc), the values of k decrease obviously, which indicates that the crystallization process is hindered. Both PPSe and its copolymers show the analogous trend. However, Tc varies for all the copolymers while n values change little. The values range from 2.01 to 2.21, indicate the two and three-dimensional growth of the crystal growth.
![[thin space (1/6-em)]](https://www.rsc.org/images/entities/char_2009.gif) t for isothermal crystallization: (a) PPSe, (b) P(PSe-co-27.9 mol% IS).
t for isothermal crystallization: (a) PPSe, (b) P(PSe-co-27.9 mol% IS).


