Electro-catalytic degradation pathway and mechanism of acetamiprid using an Er doped Ti/SnO2–Sb electrode

Shanping Li*ab, Yahui Lia, Xueyuan Zenga, Wenran Wanga, Ruoxin Shia and Lina Maa
aSchool of Environmental Science and Engineering, Shandong University, 27 Shandananlu, Jinan, 250100, China
bShandong Key Laboratory of Water Pollution Control and Resource Reuse, Jinan, 250100, China. E-mail: lishanping@sdu.edu.cn; Fax: +86-0531-88362872; Tel: +86-0531-88362872

Received 19th May 2015 , Accepted 28th July 2015

First published on 28th July 2015


Abstract

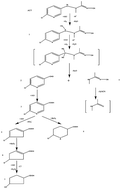
Acetamiprid, a type of new neonicotinoid pesticide, shows a high threat to water systems. Electro-catalytic degradation of acetamiprid was evaluated using an Er doped Ti/SnO2–Sb electrode prepared by the Pechini method. The acetamiprid degradation obeys first order reaction kinetics and is controlled by mass transport and oxygen evolution. TOC removal efficiency and UV scan curves revealed that some intermediate products were produced by the Er doped Ti/SnO2–Sb electrode. Through electrospray ionization quadrupole time-of-flight tandem mass spectrometry, the ion mass-to-charge ratio of intermediate products was determined. Combining the experimental results, a degradation pathway was proposed for the electro-catalytic degradation of acetamiprid. Electrodes were mainly characterized by linear sweep voltammetry and cyclic voltammetry. The acetamiprid and TOC concentrations were reduced to 87.45% and 69.31%, respectively, after 180 min of electrolysis at 10 mA cm−2.


1. Introduction

Electro-catalytic (EC) processes have attracted considerable interest in recent years, because they promise highly efficient methods for degrading pollutants and could be operated essentially under largely similar conditions for a wide variety of wastewaters.1–6 The key factor of EC wastewater treatment is the nature of the electrode used in the process. Dimensionally stable anodes (DSAs) have been used for some years and the substrate of the electrode is generally titanium deposited with a thin layer of metal oxide, e.g., RuO2,7 IrO2,8 PbO2 and SnO2.5,9–11 Although RuO2 and IrO2 electrodes have been widely applied in the chlorine-alkali industry, the prices of metal oxides are high and the electrodes are not efficient for organic oxidation. PbO2 electrodes studied by some researchers5,12,13 showed a highly effective EC capacity for organic oxidation; however, this working electrode may be susceptible to dissolve Pb2+ ions causing the secondary pollution of water. Electrodes based on SnO2 also reflect a similar capacity for organic oxidation as the PbO2 electrode and have a high oxygen evolution over-potential.14,15 Because of its high electrical resistance, the SnO2 electrode is often doped with Sb to improve its electrical conductivity, and SnO2–Sb electrodes present good EC activities and organic oxidation rates.16 Recently, there have been attempts to dope SnO2–Sb electrodes with rare earth elements, such as Nd, Gd and Eu, in order to further improve the performance of SnO2–Sb electrode in an EC process.3,17,18 The phenol degradation rate increased up to 41% as a result of moderate Gd addition into the Ti/SnO2–Sb electrode.3 Moderate Eu doped Ti/SnO2–Sb electrodes could produce smaller grain sizes of SnO2, resulting in larger surface areas and more active sites on the electrode surface improving the EC oxidation.18

New neonicotinoid pesticides are a new class of chemical pesticides and also the fourth class of pesticides after organophosphorus pesticides, pyrethroid pesticides and carbamate pesticides. At present, they have been registered in more than 120 countries maintaining a rapidly increasing application.

Acetamiprid (ACT), exploited in 1996 by NIPPON SODA CO., Ltd ACT, is widely used in agriculture and horticulture to control sucking insects, and there are about 400 companies registered for production of ACT in China. ACT has a high water solubility (the solubility is 4200 mg L−1 in water at 293 K and pH = 7) and is highly stable in the sun and in a weak acidic medium. However, after accumulation in pure water, it is difficult to be degraded through hydrolysis or photolysis, which would cause environmental pollution and introduce a health risk for humans. According to the article,19 6-chloronicotinic acid (6-CNA) is regarded as the degradation product of ACT by photocatalytic oxidation. 6-CNA is mainly used as a pharmaceutical intermediate. After being absorbed, it could combine with serum albumin causing a serious threat to human health.20 The chemical structures of ACT and 6-CNA are presented in Fig. 1.


image file: c5ra09376g-f1.tif
Fig. 1 (A) The chemical structure of ACT; (B) the chemical structure of 6-CNA.

Recent studies have mainly reported the removal of neonicotinoid pollutants by photolytic/photocatalytic oxidation.21–23 Therefore, studying the EC degradation of ACT would provide a treatment or pre-treatment method and enrich research on the new neonicotinoid pesticides.

The objective of this study is analyzing the intermediates and products of EC degradation ACT by means of electrospray ionization quadrupole time-of-flight tandem mass spectrometry (ESI-Q-TOF-MS), proposing the EC degradation pathway of ACT in an aqueous solution. The degradation kinetics of ACT removal at different initial concentrations was further investigated. Several calcination temperatures were used to prepare electrodes by the Pechini method and electrochemical properties of a working electrode prepared by ourselves was evaluated by LSV and CV.

2. Experimental

2.1 Electrode preparation

Ti mesh that was chosen as the substrate for oxide-coated electrodes was rectangular in shape. The size of the diamond mesh was 3 mm × 8 mm. They were polished thoroughly with mechanical polishing, degreased in boiling 5% Na2CO3 for 1 h, and then etched in boiling 10% oxalic acid for 2 h followed by thorough washing with distilled water. The treated Ti meshes became grey, lost their metallic sheen and were preserved in 95% ethanol.

The electrodes were covered with a rare earth Er doped SnO2–Sb film prepared by the Pechini method. The preparation procedure was similar to our previous report and other reports.24,25 The metal[thin space (1/6-em)]:[thin space (1/6-em)]citric acid (CA)[thin space (1/6-em)]:[thin space (1/6-em)]ethylene glycol (EG) mole ratio was 1[thin space (1/6-em)]:[thin space (1/6-em)]3[thin space (1/6-em)]:[thin space (1/6-em)]10. Briefly, CA was dissolved in EG at 65 °C with stirring and is named solution A. SnCl4·5H2O, SbCl3 and Er were added into solution A. The mixed solution was heated to 90 °C with stirring for 30 min to generate the precursor solutions. The Sn/Sb/Er molar ratio was 100[thin space (1/6-em)]:[thin space (1/6-em)]6[thin space (1/6-em)]:[thin space (1/6-em)]0.5. The pre-treatment of the Ti meshes were dipped into the precursor solution, and then dried in an electric oven at 130 °C for 30 min. After four cycles of both dipping and drying, the electrode covered by the metals film was heated in a muffle oven at a heating rate from 10 °C min−1 to 550 °C and maintained at 550 °C for 30 min for coating pyrolysis. This entire process (dipping, drying and pyrolysis) was repeated 3 times and finally, the electrodes were calcined at a variable temperature of 550 °C, 600 °C, 650 °C, 700 °C or 750 °C for 2 h with a heating rate of 5 °C min−1. In this study, all chemicals were of reagent grade. The schematic of citric acid chelate precursor method for electrode preparation is shown in Fig. S10.

2.2 Analytical methods

A thermal analyzer (SDT Q600, TA, America) was employed to monitor the changes of the Er precursor temperature and weight to reflect the change of material and the formation of phase in the process of the electrode calcination stage. There were few analysis conditions, namely, the temperature ranged from 25 °C to 800 °C, the heating rate was 10 °C min−1, and the testing atmosphere was air. Before testing, the precursor containing Er was dried at 130 °C for 30 min to obtain a xerogel.

The precursor solution was dried, heat treated, and calcined at 650 °C to obtain the precursor powder. The diffuse reflection spectrum of precursor powder was obtained by UV/Vis/NIR diffuse reflectance spectroscopy (UV-3600, Shimadzu). Diffuse scanning ranged from 230 nm to 800 nm, and the control and analysis software was UV probe 2.10.

The concentration of ACT during the EC degradation process was established by an UV-spectrometer (TU-1810 PC, Beijing Purkinje General Instrument Co. Ltd, China). The 245 nm peak was used for quantification.

The organic concentration in the solution was measured by a total organic carbon (TOC) analyzer (TOC-5000A, Shimadzu) based on the combustion-infrared method.

Electrospray ionization quadrupole time-of-flight tandem mass spectrometry (ESI-Q-TOF-MS, Agilent, America) was used for the measurement of intermediates. Before injecting the sample into the ESI-Q-TOF-MS, the sample was extracted with ethanol. The ion peak of [M + H]+ or [M − H] was obtained to analyze the degradation products in the ESI ionization source mode.

2.3 Electrochemical characterization of the electrode

Electrochemical measurements were carried out using an electrochemical workstation (CHI700B, Shanghai Chenhua, China) in a three-compartment cell. The self-made electrode (10 mm × 10 mm) was used as the working electrode, a Ti plate electrode (20 mm × 30 mm) was employed as the counter electrode, and a saturated calomel electrode (SCE) was used as the reference electrode (all the electrode potentials in this study are in reference to this electrode).

The linear sweep voltammetry (LSV) tests were employed to analyze the oxygen evolution potential of the self-made electrodes. The solution contained 0.5 M Na2SO4. The scanning voltage ranged from −2 V to 3 V with a scan rate of 20 mV s−1.

The kinetic of the oxygen evolution reaction (OER) was studied in terms of a Tafel plot, which has sometimes been referred to as “the first law of electrode kinetics”,26 namely,

 
η = a + b[thin space (1/6-em)]log[thin space (1/6-em)]i (1)
where a (V) is the overpotential value with the unit of the current density, b (V) is the Tafel slope, and i (mA cm−2) is the current density.

Cyclic voltammetry (CV) experiments were conducted to inspect the reaction characteristics and mechanisms of anode preliminarily.27 The solution contained either 0.5 M Na2SO4 or 0.5 M Na2SO4 with 25 mg L−1 ACT (Na2SO4 is the electrolyte). Cycling between 0.5 V and 2.5 V with a scan rate of 50 mV s−1 obtained the CV diagram.

2.4 Electrochemical experiment for ACT and 6-CNA

Taking ACT and 6-CNA as model organic compounds, EC experiments were conducted in a batch of electrolysis cells that were 150 mL glass beakers. For each cell, a prepared anode (30 mm × 40 mm) and a Ti plate of the same size used as the cathode were placed in the beaker at a spacing of 20 mm between the electrodes. A direct current (DC) potentiostat was used as the power supply for the organic degradation studies with a voltage output up to 20 V.

For EC experiments, ACT (25 mg L−1, 50 mg L−1, 100 mg L−1 or 200 mg L−1) and 6-CNA (50 mg L−1) were placed in cells (140 mL) with electrolyte (0.5 M Na2SO4). Through the experiments under different current densities, it was found that the removal efficiency of ACT increase was slower, and a side reaction (oxygen evolution reaction) intensified, when the current density was higher than 10 mA cm−2. The current density of 10 mA cm−2 was selected as the appropriate value. Therefore, EC experiments were performed under a DC current of 0.12 A, which resulted in a current density of 10 mA cm−2. The EC cells were placed on a magnetic stirrer for continuous mixing. Samples were withdrawn from the electrolyzed solution at a pre-determined time to analyze the model organic compounds, total organic carbon (TOC), UV absorbance, and intermediate products.

According to a related article,28 the UV absorbance spectra scanning range was identified from 280 nm to 200 nm. The characteristic absorption wavelength is 245 nm for water samples before and after degradation. The method of analyzing the UV absorbance spectra to express the concentration of the ACT and the removal efficiencies of ACT and TOC of each period is expressed as follows:

 
image file: c5ra09376g-t1.tif(2)
where C0 is the ACT concentration or the total organic carbon at the beginning and Ct is the ACT concentration or the total organic carbon at the end of each time period.

3. Results and discussion

The preceding article24 revealed that doping with the rare earth Er had effects on scanning electron microscopy (SEM, Fig. S1), X-ray diffraction (XRD, Fig. S2), and energy dispersive spectrometry (EDS, Table S1) for the electrodes, and the details are presented in the ESI.

3.1 Characterization of the precursor

3.1.1 The influence of calcination temperature. The experiments that investigated the influence of calcination temperature (550 °C, 600 °C, 650 °C, 700 °C and 750 °C) on the removal rate of ACT were carried out in the 0.5 M Na2SO4 solution with 50 mg L−1 ACT at room temperature. There was a space (20 mm) between these two electrodes for magnetic stirring.

From Fig. 2, the EC activity of the five electrodes for ACT removal is in the order of 650 °C > 600 °C ≈ 700 °C > 550 °C > 750 °C. When the calcination temperature was 650 °C, the removal efficiency reached 87.45%. Nevertheless, when the calcination temperature was increased to 750 °C, the removal efficiency was only 63.9%. For the solution containing 50 mg L−1 ACT under the same experimental conditions, the removal efficiencies for the Er doped Ti/SnO2–Sb electrode and Ti/SnO2–Sb electrode were 87.45% and 65.73%, respectively. The Sn/Sb/Er molar ratios were 100[thin space (1/6-em)]:[thin space (1/6-em)]6[thin space (1/6-em)]:[thin space (1/6-em)]0.5 for doped and 100[thin space (1/6-em)]:[thin space (1/6-em)]6[thin space (1/6-em)]:[thin space (1/6-em)]0 for undoped electrodes. Doping the appropriate amount of Er could improve the EC performance of the electrodes.


image file: c5ra09376g-f2.tif
Fig. 2 The impact of calcination temperatures on the removal efficiencies of ACT for the Er doped and undoped SnO2–Sb electrodes.

Some researchers3,4,18 thought the main mechanism to be that calcination temperature affects the EC performance and stability of the electrode as follows. The suitable calcination temperature could obtain a better crystallinity of SnO2 grain, a higher order degree in the atomic lattice of the SnO2 lattice, and reduce the oxygen vacancy defect in the crystal. Therefore, these make for an observable electrochemical combustion reaction, and turns oxidized organic matter into CO2 and H2O thoroughly in a relatively short time. For the lower calcination temperature, the process of oxidation decomposition was incomplete and the crystallinity of SnO2 grain was poor. The EC performance of the electrode would not achieve the ideal state. If the calcination temperature is too high, the growth of SnO2 grain accelerates, which facilitates the secondary crystallization, making the grain distribution of the coating nonuniform. This results in poor density of the electrode coating, which might contribute to generating the nonconductive TiO2 in the titanium substrate. At last, these reasons are expected to result in electrode instability and a decrease of electro-catalytic property.

In conclusion, 650 °C was considered as the suitable calcination temperature, Santos et al. reached a similar conclusion for the calcination temperature.25

3.1.2 Analysis on phase transformation of the containing Er precursor. Fig. 3 presents the TGA-DTA spectrogram of the xerogel sample of doping Er, and the thermal oxidation process of the xerogel sample in stages.
image file: c5ra09376g-f3.tif
Fig. 3 TGA-DTA spectra of xerogel sample of doping Er.

The first stage is from 38 °C to 305 °C. The weight loss of the xerogel sample reaches the maximum, and the ratio of weight loss is about 75.92%. There are three weight loss steps: (1) from 38 °C to 100 °C, the volatilization of water that adsorbs and remains on the xerogel sample shows an endothermic peak corresponding to the DTA curve; (2) from 100 °C to 250 °C, the volatilization of the excess EG and the residual moisture shows an endothermic peak corresponding to the DTA curve. There is a weak exothermic peak in the DTA curve that could be due to the removal of nitrate from the sample; (3) from 250 °C to 305 °C, due to –CH2–CHOH– groups decomposing into –CH[double bond, length as m-dash]CH– in the CA, the weight of sample decreases dramatically, which shows an endothermic peak.

The second stage is from 305 °C to 437 °C. The weight loss of the xerogel sample is about 5.9%, which is due to citric acid metal complex decomposing into metal oxides.29 The DTA curve increases slowly accompanied with the temperature increase. The heat emission of the xerogel sample is slow, and there is not an obvious exothermic peak. The xerogel sample shifts from an amorphous form to an oriented form, and forms SnO2 crystals.

The third stage is from 437 °C to 527 °C. The weight loss of the xerogel sample is about 5.95%. There is a sharp exothermic peak at 512.2 °C in the DTA curve corresponding to SnO2 transforming amorphous crystalline state into quartet rutile phase crystalline state.30,31 Moreover, previous literature24 also revealed that SnO2 transformed from an amorphous crystalline state into a quartet rutile phase crystalline state by XRD analysis, which is shown in Fig. S2.

The fourth stage is from 527 °C to 664 °C. There are two weak exothermic peaks in the DTA curve at 578.10 °C and 616.73 °C. The peaks indicate the oxidation of Sb2O3 form Sb2O4, which consists of Sb2O3 and Sb2O5. The volatilization of Sb2O3 at high temperature causes a 5.21% weight loss.

The fifth stage is from 664 °C to 700 °C. The weight of sample does not change any longer and there is a weak exothermic peak in the DTA curve at 681.02 °C. The weak exothermic peak indicates that Sb2O4 is in the oblique square cervantite form32 at 681.02 °C.

In addition, the TGA-DTA spectrogram of the xerogel sample without Er doping is generally similar with that of the doped sample, as shown in Fig. S11. However, from 100 °C to 250 °C, the volatilization of the excess EG and the residual moisture shows a smaller endothermic peak and less ratio of weight loss (68.02%) compared with the TGA-DTA spectrogram of the xerogel sample doped with Er at the first stage, possibly due to the lack of nitrate.

According to the abovementioned analysis and the TGA-DTA spectra, minimum forming temperature of SnO2 (quartet rutile phase crystalline state) is about 550 °C; therefore, the thermal oxidation temperature should be higher than this during the electrode preparation process, which is in agreement with the 3.1.1 Section conclusion.

3.1.3 UV/Vis/NIR diffuse reflectance spectra analysis. Fig. 4 gives the UV/Vis/NIR diffuse reflectance spectra of the precursor powders and the illustration is an amplification of the spectra between 230 nm and 400 nm. After Er was doped into the precursor powder, optical absorption peaks of the sample slightly moved towards the short-wave direction. The phenomenon of the blue shift in the absorption peak could be attributed to the quantum size effect.33 According to the Burstein–Moss mobility theory, the blue shift in the absorption peak indicates that the precursor powder with Er has a higher carrier concentration, signifying that the Er doped Ti/SnO2–Sb electrode has better electrical conductivity than the Ti/SnO2–Sb electrode. The improved electrical conductivity could enhance current efficiency and increase the efficiency of electro-catalysis.
image file: c5ra09376g-f4.tif
Fig. 4 UV/Vis/NIR diffuse reflectance spectra obtained from the precursor powders with and without Er for the electrode preparation.

The band gap energy of semiconductors (Eg) can be estimated from the absorption edge (λg) using the following formula:34

 
Eg = 1240/λg (3)
λg of the prepared electrodes and the corresponding Eg calculated by eqn (3) are shown in Fig. S9 and Table 1, respectively. The doping of Sb and Er into SnO2 transformed the band gap of the SnO2 semiconductor structure.

Table 1 Band gap energies for the Er doped and undoped SnO2–Sb samples
Samples Optical absorption threshold λg/nm Band gap Eg/eV
0 mol% Er doped 375 3.31
0.5 mol% Er doped 395 3.14


Sb5+ doped in SnO2 increases the concentration of electrons in the conduction band and facilitates conductivity. Hence, the band gap energy value of the SnO2–Sb electrode was reduced to 3.31 eV. Er3+ doped in the SnO2–Sb is beneficial to electronic transfer from the valence band to the conduction band, and the band gap energy value of 0.5 mol% Er doped in the SnO2–Sb was reduced to 3.14 eV. As presented in Fig. 3, a blue shift in the absorbance peak was observed in our experiment. For SnO2, the band gap energy value was 3.8 eV,35,36 which is significantly more than the calculated value of the samples.

A narrower band gap may lead to a higher carrier concentration, which can improve the electrical conductivity of the electrodes.37 The band gap of Er doped in the Ti/SnO2–Sb is lower than the band gap of 0 mol% Er doped in the Ti/SnO2–Sb, resulting in better electrical conductivity of the electrodes.

3.2 Electrochemistry characterization of the electrode

3.2.1 Examination of electrode by linear sweep voltammetry. The linear sweep voltammograms (LSVs) of the electrodes in 0.5 M Na2SO4 are given in Fig. 5. For the two types of electrodes, namely, the Er doped Ti/SnO2–Sb electrode and the Ti/SnO2–Sb electrode, the initiation potentials for oxygen evolution were around 1.85 V and 1.6 V (vs. SCE), respectively, and the absolute value of oxygen evolution was generally consistent with previous literature.38 Adding rare earth Er into electrode can improve the initiation potential of the electrons in oxygen evolution. In wastewater treatment, a higher oxygen evolution voltage was suggested to be more desirable.39 The lower oxygen evolution voltage has the disadvantage of degrading organics in an aqueous electrolyte, because anodic oxygen evolution is one of the side effects that causes an unwanted power loss and consumes active substances.
image file: c5ra09376g-f5.tif
Fig. 5 LSVs of the Er doped and undoped SnO2–Sb electrodes in 0.5 M Na2SO4 at a scan rate of 20 mV s−1.
3.2.2 The oxygen evolution reaction kinetic analysis. According to the high overpotential regions in Fig. 5 and eqn (1), we calculated the oxygen evolution reaction kinetic parameters (Table 2) of different electrodes and obtained the Tafel plots, as shown in Fig. 6.
Table 2 The oxygen evolution reaction kinetic parameters of different electrodes
Electrodes a/V b/V
The SnO2–Sb electrode 1.86019 0.45822
The Er doped SnO2–Sb electrode 2.15247 0.40721


image file: c5ra09376g-f6.tif
Fig. 6 Tafel plot of different electrodes at the high overpotential regions.

In eqn (1), “a”, the overpotential value with units of current density, represents the intercept value obtained and contrasts the difficulty level of electron transfer in different electrode systems, and “b” (Tafel slope) reflects how the electrode potential changes the reaction speed. In general, Tafel analysis presents the information of exchange current density and over-potentials.40–42 High exchange current density and low Tafel slope are considered to be beneficial to the OER.43 In this case, the Tafel slope is higher and the oxygen evolution reaction occurs more easily on account of the smaller polarization resistance. From Fig. 6 and Table 2, there is a nice linear relation between electrode potentials and the logarithm of current densities, which meets the criteria of eqn (1). The value of “a” for the Er doped Ti/SnO2–Sb electrode is larger than the value of “a” for the Ti/SnO2–Sb electrode, and the former Tafel slope value is less than the latter. This indicates that adding the proper amount of rare earth Er into an electrode can improve the electron transfer rate, reduce the energy loss in the process of wastewater treatment, and improve current efficiency.

3.2.3 Examination of electrode by cyclic voltammetry. It is generally believed that organic compounds in aqueous solutions can be oxidised at the anode by direct electron-oxidation and indirect electron-oxidation.14,16,44,45 In the direct electron-oxidation process, organic compounds are adsorbed on the anode surface and electrons transfer to the anode. In the indirect electron-oxidation process, it is generally considered that oxygen containing radicals, especially the hydroxyl radicals generated from water electrolysis, play a critical role in the EC oxidation mechanism of organic substances.45–47 Fig. 7 shows the cyclic voltammograms (CVs) of 0.5 M Na2SO4 with and without 25 mg L−1 ACT. In Fig. 7, we can see that there are no anodic peaks in the two types of aqueous solutions before the oxygen evolution potentials and adding the ACT has no obvious effect on the CV curves shapes. This indicates that ACT of the solution does not cause the direct electron transfer reaction in the self-made electrode, and the process of ACT degradation is “indirect electron-oxidation” rather than “direct electron-oxidation”.45,48
image file: c5ra09376g-f7.tif
Fig. 7 CVs of the Er doped SnO2–Sb electrode in 0.5 M Na2SO4 and 0.5 M Na2SO4 containing 25 mg L−1 ACT at a scan rate of 50 mV s−1.
3.2.4 Examination for the service life of electrode. The electrodes should not only have higher electrochemical activity but also have good stability. The small current density in actual applications requires a considerable long time test of the service life of the electrode. Taking this factor into consideration, we used an accelerated test method to measure the service life, and predict the actual working life of the electrodes by eqn (4):
 
image file: c5ra09376g-t2.tif(4)
where τ2 and τ1 are actual working life and accelerated service life and i2 and i1 are the actual working current density and accelerated current density, respectively.

The method of accelerated test of service life for the Er doped Ti/SnO2–Sb electrode was similar to previous literature.11 The distance between the tested electrodes (anode) and Ti plate (cathode) was 20 mm, and an external DC power source provided a current density of 2000 A m−2 in the electrolysis cells with 1.0 mol L−1 H2SO4 as electrolyte. The accelerated service life test of an electrode would typically end up with a 5 V increase of the electrolysis cells voltage.

The results of tested accelerated service lives of Er doped Ti/SnO2–Sb and Ti/SnO2–Sb electrode are shown in Table 3. The actual working lifetimes of the electrodes were calculated by eqn (4). The actual working life of Er doped Ti/SnO2–Sb electrode was obviously longer than that of the Ti/SnO2–Sb electrode, which would reduce the cost of electrochemical degradation in actual processes.

Table 3 Service life in the accelerated test for different electrodes
Electrodes Accelerated service life/h Actual working life/day
Er doped Ti/SnO2–Sb 18 298
Ti/SnO2–Sb 8 132


Fig. S1(a) and (b) show the morphologies of freshly prepared 0 mol% Er doped and 0.5 mol% Er doped Ti/SnO2–Sb electrodes, respectively. A cracked-clay morphology existed for both the types of electrode surface coatings. Compared with the undoped samples, the crack of the doped samples was narrower, more compact, and with more refined grains, which were beneficial to improve the stability of the electrodes, increasing the specific surface area, and extending the life of the electrodes.24

3.4 Performance of the electrode on ACT degradation

The electrode degrades organic matter mostly associated with the oxygen evolution reaction; therefore, it is important to research the oxygen evolution reaction. This reaction at the Ti/SnO2–Sb electrode is generally divided into the following steps:4,49
 
SnO2−x + H2O → SnO2−x(HO˙) + H+ + e (5)
 
SnO2−x(HO˙) → SnO2−x+y + yH+ + ye (6)
 
image file: c5ra09376g-t3.tif(7)
 
image file: c5ra09376g-t4.tif(8)

Eqn (5) shows that the water molecule is oxidized on the electrode surface and forms an adsorption state of the hydroxyl radical, i.e., SnO(2−x)(HO˙). On account of the existence of an oxygen vacancy in the SnO2 grain, SnO(2−x)(HO˙) might either undergo the oxygen evolution reaction as in eqn (8) or cause an oxygen atom transfer reaction creating a high valence state oxide (SnO(2−x+y), eqn (6)), further causing the oxygen evolution reaction, as in eqn (7). The oxygen content of SnO(2−x+y) is always less than 2 (i.e., 2 − xy < 2). The reaction system was under an acidic environment, and the changes of pH with various electrolysis times are shown in Fig. S4. The FT-IR analysis also supports the abovementioned formula in Fig. S3.

In the EC system, degradation of organic matter also needs SnO(2−x)(HO˙) as the main participator (eqn (9)).3

 
Organics + SnO2−x(HO˙) → CO2 + SnO2−x + zH+ + ze (9)

Based on the CV analysis result that the process of ACT degradation is “indirect electron-oxidation”, the adsorption state SnO(2−x)(HO˙) on the electrode surface should react with the ACT spreading towards the electrode surface. Some are mineralized into small inorganic molecules, the others are degraded into organic intermediates first and then gradually into small molecule inorganics (eqn (10)).

 
image file: c5ra09376g-t5.tif(10)

With constant current (10 mA cm−2), the presence of hydroxyl radicals played an important role in the degradation process, as shown in Fig. S6. The degradation rate “r” for ACT can be expressed as follows,

 
image file: c5ra09376g-t6.tif(11)
where kACT is the real rate constant, kapp(ACT) is the apparent rate constant of the ACT oxidation and α and β are the reaction order relating to HO˙ and ACT, respectively.

Then, the initial concentrations of ACT were changed (25 mg L−1, 50 mg L−1, 100 mg L−1, 200 mg L−1) with other conditions unchanged for a kinetics evaluation. We processed the experimental data and obtained a relationship between ln(ACT0/ACTt) and various time points, as shown in Fig. 8. The straight lines obtained in Fig. 8 suggest that the kinetics of ACT degradation is in line with pseudo-first order reaction kinetics. Therefore, eqn (11) could be rewritten as eqn (12) and eqn (13). In addition, the ACT concentration could be obtained from the curve of the calibrated absorbency value vs. concentration of ACT at 245 nm, as shown in Fig. S5.

 
image file: c5ra09376g-t7.tif(12)
 
image file: c5ra09376g-t8.tif(13)
where km is the apparent mass transfer coefficient, S is the effective electrolysis area and V is the volume of the electrolyte.


image file: c5ra09376g-f8.tif
Fig. 8 Linear regression for ln(ACT0/ACTt) as a function of time at room temperature with a current density of 10 mA cm−2.

Table 4 summarizes the removal amount of ACT after 180 min of electrolysis and the degradation kinetic parameters for different initial ACT concentrations.

Table 4 The removal amount of ACT and degradation kinetic parameters, including kapp(ACT) (apparent rate constant), km(ACT) (mass transport rate) and km (apparent mass transfer coefficient) for different initial ACT concentrations
Initial concentration of ACT (mg L−1) 25 50 100 200
Removal amount (mg L−1) after 180 min 21.927 43.134 83.212 148.312
kapp(ACT) (10−4 s−1) 1.8167 1.7333 1.5333 1.1667
km(ACT) (10−7 mg m−2 s−1) 0.4646 0.8635 1.4887 2.0185
km (10−5 ms−1) 2.119 2.022 1.789 1.361


Table 4 reflects that the mass transport rate (km(ACT)) for ACT molecule diffusion from the solution to the surface of electrode, which always varied with the increase of ACT initial concentration. The higher the initial concentration of ACT, the more ACT removal observed after 180 min of electrolysis.

Table 4 also shows that the apparent mass transfer coefficient (km) and apparent rate constant (kapp(ACT)) decreased with increasing ACT concentration in the range from 25 mg L−1 to 200 mg L−1. km and kapp(ACT) changed slightly in the low concentration region, but in the high concentration region varied tremendously. The reason for causing this may be as follows.

The values of km or kapp(ACT) should be very close in theory at different concentrations. However, hydroxyl radical (HO˙) concentration should be regarded as invariant at constant current (10 mA cm−2). According to eqn (10), degradation generated some intermediates and conducted the oxygen evolution reaction. If the amount of ACT in the aqueous solution is increased, the intermediate is accumulated accompanying the degradation process. Nevertheless, HO˙ has a strong ability to oxidize and react with most organic matter and this intermediate competes with ACT for HO˙. Therefore, the parameters are lower and HO˙ is another important factor for ACT degradation.

3.5 ACT degradation and TOC removal

In the electrochemical oxidation of ACT (50 mg L−1), the concentration of ACT after different periods of galvanostatic electrolysis was analyzed by UV-spectrometry and TOC analyses. Eqn (2) was applied for the removal efficiencies of ACT and TOC. With increasing time, the removal efficiencies of ACT and TOC also increased progressively. After 180 min of electrolysis, the ultimate removal efficiencies were 87.45% (ACT removal) and 69.31% (TOC removal). Therefore, the Er doped Ti/SnO2–Sb electrode is effective for ACT mineralization, as shown in Fig. 9.
image file: c5ra09376g-f9.tif
Fig. 9 ACT and TOC removal efficiencies for 50 mg L−1 ACT by the Er doped Ti/SnO2–Sb electrode at a current density of 10 mA cm−2 during variation time.

However, the TOC removal efficiency is less than the ACT removal efficiency all of the time. Some articles also expressed a similar phenomenon in the anode electrolysis of refractory wastewaters.4,50 This indicates that the formation and accumulation of some organic intermediates (such as 6-CNA) may prolong electrolytic time, before ACT was thoroughly decomposed into inorganic substances such as carbon dioxide and water molecules.

Handling the TOC removal data obtained the relationship between ln(TOC0/TOCt) and various time points and generated a straight line (Fig. 10), illustrating that the reaction kinetics of TOC removal matched the pseudo first-order kinetics expressed by the following equation.

 
image file: c5ra09376g-t9.tif(14)
where TOC0 is the total organic carbon at the beginning and TOCt is the total organic carbon at the end of each time period.


image file: c5ra09376g-f10.tif
Fig. 10 Linear regression for ln(TOC0/TOCt) as a function of time at a current density of 10 mA cm−2.

3.6 Degradation pathway and mechanism analysis of ACT

The UV spectrum is often applied to analyze compounds containing a conjugated system. Molecular structures of compounds and energy level gaps of electronic transition are different; therefore, the wavelength of maximum absorption (λmax) is distinct for different compounds. According to the organic spectral theory, the condition that the organics produce UV absorption includes chromophores and auxochromes. Chromophore is a general term for a group containing π electrons. Examples of few chromophores are as follows:
image file: c5ra09376g-u1.tif

Auxochrome is common for groups containing n electrons such as –OH, –NH–, –Cl and, –NR2. An auxochrome has no UV absorption but nevertheless can often affect the λmax when connected with a chromophore. There are three main UV absorption bands for organic matter, namely, the R band, K band and B band, whose characters are listed in Table 5.

Table 5 The source and character of the R band, K band and B band
Categories Origin Characteristics
R band Transition from n to π* Weak absorption, λmax ≧ 270 nm
If other bands appear, sometimes it shifts to red shift, or be covered with strong absorption band
K band Especial for conjugated system on transition from π to π* Strong absorption, 210 nm ≦ λmax ≦ 270 nm
B band Transition from π to π* for heterocyclic ring Moderately strong absorption
The value of B band for pyridine ring is 256 nm


The UV scan curves of the electrolytes (50 mg L−1 ACT, 50 mg L−1 6-CNA) at various electrolysis time with the Er doped Ti/SnO2–Sb electrode are illustrated in Fig. 11A and B.


image file: c5ra09376g-f11.tif
Fig. 11 UV scan curves of electrolytes for (A) ACT (50 mg L−1); (B) 6-CNA (50 mg L−1). The samples were diluted 10 times before measuring.

As Fig. 11A displays, the peak wavelength absorption is always at 245 nm, indicating the presence of the K band28,58 before and after ACT degradation. Because the molecular structure of ACT contains chromophores (imine, amino and pyridyl) and auxochromes (–Cl, –CH3, –NR2), the K band was formed by the conjugated double bond absorption, which consists of imine and amino groups. During electrolysis, the peak wavelength absorption decreased, suggesting that the conjugated double bonds have been slowly destroyed. Furthermore, there were two new absorption peaks at 275 nm and 265 nm after 120 min of electrolysis, indicating the presence of intermediate products containing a pyridine ring. Castan et al. and Gipson et al. obtained similar conclusions in previous studies.51,52 The two new absorption peaks corresponded to the R band and B band of the pyridine ring. The pyridine ring connected with auxochrome, i.e., hydrogen bonded at the pyridine nitrogen and carbonyl group,53 promoted the absorption band to red shift. The two new absorption peaks at 275 nm and 265 nm continuously decreased, illustrating the destruction of pyridine rings in the intermediate products.

There are three absorption peaks at 224 nm, 265 nm and 275 nm corresponding to the K band, B band and R band, respectively (Fig. 11B). Strong absorption in the K band was formed by a conjugated system that is made up by a pyridine ring and carboxyl group. After 180 min of electrolysis, the three characteristic absorption peaks almost disappeared. This further proves that organic matter containing a pyridine ring undergoes a ring-opening reaction in an EC system.

Mass spectra of ACT before and after treatment are exhibited in Fig. 12, and Table 6 lists the possibly stable degradation products. Based on the abovementioned results, a degradation pathway was proposed for the ACT EC that is shown in Fig. 13. Some undetected compounds are also written in brackets of Fig. 13 and could readily and rapidly be oxidized or hydrolyzed to other or small inorganic molecules.


image file: c5ra09376g-f12.tif
Fig. 12 (A) MS spectrograms of ACT before treatment in positive ion mode, MS range: 120–400. (B) MS spectrograms of ACT after treatment for 90 min in negative ion mode, MS range: 60–420. (C) MS spectrograms of ACT after treatment for 90 min in positive ion mode, MS range: 110–250. (D) MS spectrograms of ACT after treatment for 90 min in positive ion mode, MS range: 136–174. (E) MS spectrograms of ACT after treatment for 180 min in positive ion mode. MS condition: drying temperature: 350 °C; sheath gas: 40; attach gas: 10; purge gas: 0; MS range: 50–800.
Table 6 MS data for ACT and several stable degradation intermediate products
Number Molecular formula Compounds name Calculated value of m/z Estimated value of m/z
ACT C10H11ClN4 (E)-N-((6-Chloropyridin-3-yl)methyl)-N′-cyano-N-methylacetimidamide 222.0672 223.0770[M + H]
1 C10H11ClN4O (E)-N-((6-Chloropyridin-3-yl) (hydroxy)methyl)-N′-cyano-N-methylacetimidamide 238.0621 238.8917[M − H]
2 C6H4ClNO 6-Chloronicotinaldehyde 140.9981 142.9366[M + H]
3 C6H4ClNO2 6-Chloronicotinic acid 156.9931 158.9628[M + H]
4 C4H7N3 (E)-N′-Cyano-N-methylacetimidamide 97.0640 96.9602[M − H]
5 C6H5ClO2 4-Chlorocyclopenta-1,3-dienecarboxylic acid 143.9978 144.9805[M + H]
6 C6H7ClO2 4-Chlorocyclopent-1-enecarboxylic acid 146.0135 146.9768[M + H]
7 C6H10O3 3-Hydroxycyclopentanecarboxylic Acid 130.0630 131.0974[M + H]
8 C6H10ClNO2 6-Chloropiperidine-3-carboxylic acid 163.0400 164.9198[M + H]


image file: c5ra09376g-f13.tif
Fig. 13 The degradation pathway of ACT treated by Er doped Ti/SnO2–Sb electrode.

Because ACT wastewater has the characteristic of low alkalinity, ACT proceeded the deprotonation reaction in the oxidation system, in which HO˙ is the main active substance, and the active site of the ACT molecule is α-C in tertiary amine. HO˙ captures hydrion (H+) to from α-C, generating a water molecule (H2O) and an α-amido hydroxyl radical (−HC˙ –N<). α-Amido hydroxyl radical has the high reducibility;54 therefore, oxygen molecules (O2) are reduced to superoxide radical (O2)55 and was oxidized to organic species 1.

The superoxide radical (O2) continues to react based on eqn (15) and (16) and forms an oxygen molecule (O2) and hydrogen peroxide (H2O2).56 Minghua Zhou57 verified that there was no H2O2 molecule in the anodic EC degradation of phenol. Therefore, there was a relationship between H2O2 of the in situ reaction with the special structure of ACT in this study.

 
O2˙ H+ ⇔ HO2˙ (15)
 
2HO2˙ → H2O2 + O2 (16)

According to the deprotonation reaction mentioned above, organic species 1 was further oxidized and generated organic species 3 and 4, as shown in Fig. 13. The pathway is consistent with what Maria L. Dell'Arciprete19 proposed to explain the photocatalytic degradation of ACT.

The mass spectrum test detected three molecular ion peaks, namely, m/z = 164.9198, 146.9768 and 144.9805 representing organic species 5, 6 and 8. To verify whether 6-CNA as an intermediate product was oxidized further and generated three organic species, 6-CNA was used as a model organic compound and was treated under the conditions as ACT. Mass spectra of 6-CNA before and after treatment are displayed in Fig. 14.


image file: c5ra09376g-f14.tif
Fig. 14 (A) MS spectrograms of the 6-CNA before treatment. (B) MS spectrograms of the 6-CNA after treatment.

As shown in Fig. 14b, there are three molecular ion peaks similar to the aforementioned mass spectrum of 6-CNA after degradation, deducing that three organic species were generated by 6-CNA reacting with HO˙ during the EC degradation of ACT.

The hydroxyl radical (HO˙) has a close electrical characteristic and tends to attack positions of higher electron density over other parts of the molecular structure. The pyridine ring is similar to the benzene ring. The p-orbital in each atom is perpendicular to the ring plane, and these p-orbitals are parallel to each other and the sides overlap to form a closed π bond. There is a hybrid orbital sp2 for the N atom of the pyridine ring. It does not participate in bonding and exists in the form of a lone electron pair that skews the π electron cloud to the N atom forming a high density electron cloud around the N atom; therefore, the density of electron cloud is lower for the rest of the ring. The N atom was attacked by HO˙ in the pyridine ring of 6-chloronicotinic acid and is separated from the pyridine ring in the form of NO2 or NO3. Unpaired electrons of the two C atoms beside the N atom attract each other forming organic species 5. Reduction of organic species 5 via an electrophilic addition reaction generated organic species 6 by in situ reaction with H2O2. An active Cl atom and double bond that are easy to develop an electrophilic addition reaction is replaced by HO˙ and reduced to a single bond by H2O2 (organic species 7). Previous literature58 about acetamiprid removal by low-temperature plasma using dielectric barrier discharge also achieved a similar conclusion, which reduced 6-chloronicotinic acid to a piperidine derivative. The abovementioned degradation reactions were also mentioned by an electro-catalytic degradation mechanism of nitenpyram using the Ti-based SnO2–Sb59 of our previous study.

Organic species 7 (cyclopentane carboxylic acid), organic species 8 (piperidine derivative) and an amide derivative that was generated by oxidized organic species 4 had a good biodegradable property and were further were oxidized to low molecular weight organic matter and inorganic matter by HO˙.

4. Conclusions

Adding Er into the Ti/SnO2–Sb electrode could improve the electrical conductivity and oxygen evolution potential of the electrode. The electrode showed improved EC performance for the degradation of ACT at 650 °C chosen as the suitable calcination temperature. The removal efficiency of ACT and TOC reached 87.45% and 69.31% after 180 min of electrolysis for synthetic wastewater containing 50 mg L−1 ACT at a current density of 10 mA cm−2. The kinetics of ACT and TOC by electro-catalysis is in accordance with pseudo-first order reaction kinetics. According to the UV spectra and mass spectra, a degradation pathway was proposed for ACT. 6-CNA was identified as the main intermediate product before the pyridine ring cleavage, finally converted to small molecules. The degradation mechanism involved the attack of HO˙ and H2O2.

Overall, EC had higher removal efficiency for ACT and could be an attractive alternative for pre-treatment or treatment of wastewater containing ACT.

Acknowledgements

The research was supported by Technological Progress Plan of Shandong, grant no. 2011GGE27048, China.

References

  1. C. Comninellis, Electrochim. Acta, 1994, 39, 1857 CrossRef CAS.
  2. C. Comninellis and C. Pulgarin, J. Appl. Electrochem., 1991, 21, 703 CrossRef CAS.
  3. Y. J. Feng, Y. H. Cui, B. Logan and Z. Q. Liu, Chemosphere, 2008, 70, 1629 CrossRef CAS PubMed.
  4. X. Y. Li, Y. H. Cui, Y. J. Feng, Z. M. Xie and J. D. Gu, Water Res., 2005, 39, 1972 CrossRef CAS PubMed.
  5. J. T. Kong, S. Y. Shi, L. C. Kong, X. P. Zhu and J. R. Ni, Electrochim. Acta, 2007, 53, 2048 CrossRef CAS PubMed.
  6. M. Panizza and G. Cerisola, Environ. Sci. Technol., 2004, 38, 5470 CrossRef CAS.
  7. B. O. Park, C. D. Lokhande and H. S. Park, et al., Mater. Chem. Phys., 2004, 87, 59–66 CrossRef CAS PubMed.
  8. J. M. Hu, J. Q. Zhang and C. N. Cao, Int. J. Hydrogen Energy, 2004, 29, 791–797 CrossRef CAS PubMed.
  9. J. B. Cheng, H. M. Zhang, G. B. Chen and Y. N. Zhang, Electrochim. Acta, 2009, 54, 6250 CrossRef CAS PubMed.
  10. A. T. Marshall and R. G. Haverkamp, Electrochim. Acta, 2010, 55, 1978 CrossRef CAS PubMed.
  11. B. Correalozano, C. Comninellis and A. D. Battisti, J. Appl. Electrochem., 1997, 27, 970 CrossRef CAS.
  12. D. Devilliers, M. T. Dinh-Thi, E. Mahe and Q. L. Xuan, Electrochim. Acta, 2003, 48, 4301 CrossRef CAS PubMed.
  13. Y. Mohd and D. Pletcher, J. Electrochem. Soc., 2005, 152, 97 CrossRef PubMed.
  14. J. D. Rodgers, W. J. Jedral and N. J. Bunce, Environ. Sci. Technol., 1999, 33, 1453 CrossRef CAS.
  15. E. C. P. E. Rodrigues and P. Olivi, J. Phys. Chem. Solids, 2003, 67, 1105 CrossRef.
  16. A. M. Polcaro, S. Palmas, F. Renoldi and M. Mascia, J. Appl. Electrochem., 1999, 29, 147 CrossRef CAS.
  17. S. P. Li, H. B. Wang, J. F. Lian and X. Y. Zeng, Adv. Mater. Res., 2012, 455, 1356 Search PubMed.
  18. Y. J. Feng and Y. H. Cui, J. Hazard. Mater., 2010, 178, 29 CrossRef CAS PubMed.
  19. M. L. Dell'Arciprete, L. Santos-Juanes, A. A. Sanz, R. Vicente, A. M. Amat, J. P. Furlong, D. O. Mártire and M. C. Gonzalez, Photochem. Photobiol. Sci., 2009, 8, 1016 Search PubMed.
  20. O. Malev, R. S. Klobučar and E. Fabbretti, et al., Pestic. Biochem. Physiol., 2012, 104, 178–186 CrossRef CAS PubMed.
  21. P. N. Moza, K. Huster, E. Feicht and A. Kettruo, Chemosphere, 1998, 36, 497 CrossRef CAS.
  22. S. Malato, J. Caceres, A. Agüera, M. Mezcua, D. Hernando, J. Vial and A. R. Fernández-Alba, Environ. Sci. Technol., 2001, 35, 4359 CrossRef CAS.
  23. G. Mailhota, M. Sarakhaa, B. Lavedrinea, J. Cáceresb and S. Malatob, Chemosphere, 2002, 49, 525 CrossRef.
  24. S. P. Li, X. Y. Zeng and Y. Y. Jiang, Adv. Mater. Res., 2013, 699, 724 CrossRef CAS.
  25. I. D. Santos, S. R. Gabriel, J. C. Afonso and A. J. B. Dutra, Mater. Res., 2011, 14, 408 CrossRef CAS.
  26. E. Gileadi and E. K. Eisner, Corros. Sci., 2005, 47, 3068 CrossRef CAS PubMed.
  27. N. W. Fan, Z. K. Li, L. Zhao, N. M. Wu and T. Zhou, Chem. Eng. J., 2013, 214, 83 CrossRef CAS PubMed.
  28. J. V. Guzsvány, J. J. Csanádi, S. D. Lazić and F. F. Gaál, J. Braz. Chem. Soc., 2009, 20, 152 Search PubMed.
  29. M. Alves, S. Souza and M. Silva, et al., J. Therm. Anal. Calorim., 2009, 97, 179–183 CrossRef CAS.
  30. K. N. P. Kumar, J. Kumar and K. Keizer, J. Am. Ceram. Soc., 1994, 77, 1396–1400 CrossRef CAS PubMed.
  31. K. N. P. Kumar, K. Keizer and A. J. Burggraaf, et al., Nature, 1992, 358, 48–51 CrossRef CAS PubMed.
  32. Z. H. Liang, Y. F. Sun, Y. B. Ding and W. T. Zhang, Rare Met. Mater. Eng., 2011, 40, 64 Search PubMed.
  33. J. Woltersdorf, A. S. Nepijko and E. Pippel, Surf. Sci., 1981, 106, 164 CrossRef.
  34. J. Fu, B. Chang and Y. Tian, et al., J. Mater. Chem. A, 2013, 1, 3083–3090 CAS.
  35. A. Hagfeldt and M. Graetzel, Chem. Rev., 1995, 95, 49–68 CrossRef CAS.
  36. Y. Yamashita, K. Yoshida and M. Kakihana, et al., Chem. Mater., 1999, 11, 61–66 CrossRef CAS.
  37. R. Kötz, S. Stucki and B. Carcer, J. Appl. Electrochem., 1991, 21, 14–20 CrossRef.
  38. H. Xu, A. P. Li and Q. Qi, et al., Korean J. Chem. Eng., 2012, 29, 1178–1186 CrossRef CAS.
  39. R. Kötz, S. Stucki and B. Carcer, J. Appl. Electrochem., 1991, 21, 14–20 CrossRef.
  40. L. M. da Silva, J. F. C. Boodts and L. A. D. Faria, Electrochim. Acta, 2001, 46, 1369–1375 CrossRef CAS.
  41. P. Shrivastava and M. S. Moats, J. Appl. Electrochem., 2009, 39, 107–116 CrossRef CAS.
  42. G. N. Martelli, R. Ornelas and G. Faita, Electrochim. Acta, 1994, 39, 1551–1558 CrossRef CAS.
  43. Y. Lai, Y. Li and L. Jiang, et al., J. Electroanal. Chem., 2012, 671, 16–23 CrossRef CAS PubMed.
  44. L. C. Chiang, J. E. Chang and T. C. Wen, Water Res., 1995, 29, 671–678 CrossRef CAS.
  45. J. Iniesta, P. A. Michaud, M. Panizza, G. Cerisola and A. Aldaz, Electrochim. Acta, 2001, 46, 3573 CrossRef CAS.
  46. X. Y. Li, F. Ding, P. S. Y. Lo and S. H. P. Sin, J. Environ. Eng. Div. (Am. Soc. Civ. Eng.), 2002, 128, 697–704 CrossRef CAS.
  47. O. Simod, V. Schaller and C. Comninellis, Electrochim. Acta, 1997, 42, 2009–2012 CrossRef.
  48. Y. H. Cui, Y. J. Feng and Z. Q. Liu, Electrochim. Acta, 2009, 54, 4903 CrossRef CAS PubMed.
  49. Y. Q. Wang, B. Gu and W. L. Xu, J. Hazard. Mater., 2009, 162, 1159 CrossRef CAS PubMed.
  50. G. R. de Oliveiraa, N. S. Fernandesa, J. V. de Meloa, D. R. da Silva a, C. Urgegheb and C. A. Martínez-Huitlea, Chem. Eng. J., 2011, 168, 208 CrossRef PubMed.
  51. P. Castan, F. Dahan and S. Wimmer, et al., J. Chem. Soc., Dalton Trans., 1990, 2679–2683 RSC.
  52. K. Gipson, B. Ellerbrock and K. Stevens, et al., J. Nanotechnol., 2011, 2011, 8 Search PubMed.
  53. M. K. Nayak and S. K. Dogra, J. Mol. Struct., 2004, 702, 85–94 CrossRef CAS PubMed.
  54. K. O. Hiller and K. D. Asmus, J. Phys. Chem., 1983, 87, 3682 CrossRef CAS.
  55. C. V. Sonntag and H. Schuchmann, Angew. Chem., Int. Ed., 2001, 30, 1229 CrossRef PubMed.
  56. M. C. Gonzalez, E. Oliveros, M. W. Orner and A. M. Braun, J. Photochem. Photobiol., C, 2004, 5, 225 CrossRef CAS PubMed.
  57. M. H. Zhou, Q. Z. Dai, L. C. Lei, C. A. Ma and D. H. Wang, Environ. Sci. Technol., 2005, 39, 363 CrossRef CAS.
  58. S. P. Li, X. L. Ma and Y. Jiang, et al., Ecotoxicol. Environ. Saf., 2014, 106, 146–153 CrossRef CAS PubMed.
  59. S. P. Li, W. R. Wang and X. Y. Zeng, et al., Desalin. Water Treat., 2015, 54, 1925–1938 CrossRef CAS PubMed.

Footnote

Electronic supplementary information (ESI) available. See DOI: 10.1039/c5ra09376g

This journal is © The Royal Society of Chemistry 2015
Click here to see how this site uses Cookies. View our privacy policy here.