Recovery of potassium chloride from blast furnace flue dust

Mei Zhang, Wen-Song Li, Wei-Yan Wang, Wen-Ying Liu, Zhi-Gang Fu and Yun-Quan Yang*
School of Chemical Engineering, Xiangtan University, Xiangtan City, Hunan 411105, PR China. E-mail: yangyunquan@xtu.edu.cn; Fax: +86 731 58298801; Tel: +86 731 58298809

Received 30th June 2015 , Accepted 24th September 2015

First published on 25th September 2015


Abstract

A simple, efficient, economic and environmentally-friendly recovery process for large amounts of potassium chloride from blast furnace flue dust (BF flue dust) with an abundant potassium content is developed. This process is mainly composed of water-leaching, purification, decolorization, vacuum evaporation and cooling crystallization. In this study, the basic properties of blast furnace flue dust were identified by X-ray diffraction (XRD), inductively coupled plasma analysis (ICP), and laser granulometry (LG). The purity of the KCl products was analyzed by ICP combined with the sodium tetraphenylborate (Na-TPB) chemical method and XRD. The particle sizes of the KCl products were characterized by LG and SEM. The results showed that the BF flue dust had a good recovery value with a potassium chloride content of 39.58%. After treating the dust by water-leaching and processing the as-prepared eluent via purification, decolorization and vacuum evaporation, the KCl crystal products were obtained with a yield of 72.77%, 79.52% and 71.09% with 0 °C, 5 °C and 10 °C as the cooling crystallization temperature and 2.27, 2.52 and 2.36 as the mass distribution coefficient, respectively. The KCl crystal products exhibited a narrow particle size distribution with a purity of greater than 96.00%.

1. Introduction

Quite an amount of dust and slag are produced as waste materials or byproducts in iron and steel plants every day.1,2 Since 2013, China has been the one of the biggest crude steel producers in the world with an output exceeding 779 million tons.3 It was reported that, in China, for 1 ton of steel production, 20 kg of BF flue dust would be generated averagely.4 By these calculations, the output of BF flue dust is about 15.58 million tons per year. This BF flue dust is generally dumped into landfills or fields.5,6 As is well known, BF flue dust contains abundant alkali-metal elements such as potassium and sodium and various toxic heavy-metal elements such as lead, zinc, manganese and copper.7–9 Meanwhile, this dust also contains a small amount of cyanide generated from the coal or the coke which is used as the BF production raw material.8,10 Therefore, the traditional dumped-treatment method for BF flue dust not only can cause environmental pollution and do harm to human beings,11–14 but also can lead to the waste of valuable elements or recoverable resources. Hence, the dust must be made environmentally-friendly before being discharged. In addition, recovering these valuable resources from BF flue dust can bring huge economic benefits.

Meanwhile, as the world’s second largest consumer, China is extremely dependent on the import of potassium products from the international market due to its lack of potassium resources.15–17 Thus, the recovery of secondary potassium resources will relieve the imbalance in potassium products in the supply–demand currently in China and promote national sustainable development.

It has been well demonstrated to be feasible to recycle some metal elements through physical or chemical mineral processing techniques such as hydrocyclonation, magnetic separation, grinding, chemical-leaching, floatation, and high-temperature roasting.2 So far, several effective ways have been developed to recover potassium chloride,18 mainly including the cold-decomposition and floatation process, the reverse flotation and cold crystallization process, the hot-melt crystallization process and the dilution-cooling and reaction-extraction coupling crystallization process. For instance, J.-H Chang19 reported a method for the preparation of potassium sulphate from discharged sintering dust. The process was as follows. Firstly, ammonium bicarbonate was used to separate the impurity ions from the sintering dust, such as Ca2+, Mg2+, Cu2+, Pb2+, Zn2+. Then, ammonium sulphate was added into solution to carry out a double decomposition reaction after decolorization by activated carbon. Finally, industrial and agricultural fertilizer product grade potassium sulphate and agricultural combined fertilizer (K, NH4)Cl were acquired by the procedure of concentration and crystallization. Z. Shen et al.20 also reported a method for the recovery of potassium chloride products from sintering dust with a purity of 61.03%. However, the wider applications of these products are limited by the not high enough content or the purity of potassium in the products. Moreover, potassium chloride with a higher content or purity of potassium has a much more wide range of application than potassium sulphate,21 such as in the production of basic or additional fertilizer for some crops in agriculture,22 medical adhibition and as a raw material in the diverse non-chlorine potassium fertilizers industry. For these reasons, the recovered potassium products from BF flue dust or sintering dust are usually in the form of potassium chloride rather than potassium sulphate.

Because BF flue dust usually contains a small amount of cyanide which is generated from the coal or the coke used as the raw material in the iron and steel metallurgic processes,8,10 this will deteriorate the quality of the potassium chloride. Hence, it is significant to remove the cyanide compounds from the KCl crystal products to meet with the quality standards regulated by China.23 It was reported that cyanide could be effectively removed from aqueous solution by the adsorption ability of impregnated activated carbons with silver and nickel distributed on their surface.24 However, compared with chemical purification, the adsorption purification of cyanide by activated carbon is of high cost and a little complicated in operation. Thus, it is necessary to develop an efficient chemical purification method for the removal of cyanide from potassium chloride to obtain a high purity of the KCl products.

In this paper, a novel and simple process was investigated to recover potassium chloride with high potassium purity and content by using the BF flue dust from Tangshan Iron & Steel Corporation of China as the raw material. The basic properties of the BF flue dust and the purity of the recovered products of potassium chloride were analyzed and characterized.

2. Experimental

2.1 Experimental reagents and apparatus

The main experimental reagents and apparatus used in the study are listed in Tables 1 and 2, respectively.
Table 1 The main experimental reagents used in the research
Reagent Specification Manufacturer
Hydrochloric acid AR Hunan Huihong reagent Co., Ltd., China
Sulfuric acid AR Hunan Huihong reagent Co., Ltd., China
Sodium carbonate AR Changsha Xiangke Fine Chemical plant, China
EDTA AR Tianjin Hengxing Chemical Preparation Co., Ltd., China
Sodium hydroxide AR Changsha Xiangke Fine Chemical plant, China
Potassium dichromate AR Tianjin Fengchuan Chemical Reagent Co., Ltd., China
Na-TPB or K-TPB AR Shanghai Shanpu Chemical Co., Ltd., China
Magnesium chloride hexahydrate AR Tianjin Kermel Chemical Reagent Co., Ltd., China
Phenolphthalein AR Foshan Chemical Demonstration Plant, China
Ferrous chloride AR Tianjin Guangfu Fine Chemical Research Institute, China


Table 2 The main experimental apparatus used in the research
Apparatus Specification Manufacturer
Magnetism msier D-971 Zheng Zhou Great Wall Scientific Industry and Trade Co., Ltd, China
Electronic scales ALC-2100.1 BSISL, Switzerland
Water-circulation multifunction vacuum pump SHB-IIIA Zheng Zhou Great Wall Scientific Industry and Trade Co., Ltd., China
Three-column centrifuge SS600 mm Zhangjiagang Juda centrifuge manufacturing plant, China
Vacuum rotatory evaporator RE-2000A Shanghai Yarong Biochemistry Equipment Apparatus Co., Ltd., China
Thermostatic cooling tank HC2010 Chongqing Sida Experimental Instrument Co., Ltd., China
ICP Perkin-Elmer OPTIMA 3000 Rhys Scientific Ltd., USA
XRD D/Max2550-18 KW Rigaku, Japan
Drying oven 101-2AB Tianjin Taisite Instrument Co., Ltd., China
SEM JEOL 7500F JEOL, Japan
LG Mastersizer 2000 Mastersizer, UK


2.2 Physicochemical characterization of the BF flue dust

The samples of the BF flue dust from Tangshan Iron & Steel Corporation were used as the raw material in the recovery of potassium chloride. The structural characterization of the BF flue dust was performed by XRD, and the patterns were analyzed using search-match software. The particle size distributions of the BF flue dust and the products of potassium chloride were measured with a laser granulometer (LG). The content of the elements Zn, Fe, Pb, Cu, Na, Ca and Mg in the dust samples was analyzed by inductively coupled plasma (ICP), the detection of total-cyanide was identified by a Chinese standard method (GB 7487-1987), and the content of potassium chloride was tested by the sodium tetraphenylborate (Na-TPB) chemical method.

2.3 The fundamentals of the recovery flow of potassium chloride

As we know, the chloride compounds of potassium, sodium, calcium and magnesium can easily be dissolved in water and the carbonate compounds of Ca, Mg, Fe, Pb and Cu are insoluble in water. Therefore, water-leaching can be used to separate potassium, sodium, calcium and magnesium chloride from the metal elements of Fe, Pb and Cu.

In addition, it is found that both ferro– and ferric–cyanide complexes are insoluble in water and exhibit extreme stability under most environmental conditions.25,26 Hence, this property can be used to eliminate cyanide effectively from the leached aqueous solution by adding ferrous chloride into the eluent.

Furtherly, by chemical precipitation via adding sodium- or potassium-carbonate into the eluent, the elements of Ca, Mg, Fe, Pb and Cu will be effectively separated from sodium and potassium in the eluent. Thus, the eluent will be purified from all impure metal elements except sodium. Meanwhile, by adding activated charcoal into the eluent, the chroma and the trace metals such as iron and copper in the eluent will be removed.

Finally, by evaporation and cooling-crystallization, the desired product of potassium chloride will be separated from the sodium chloride in the purified eluent.

The chemical reaction equations for the removal of cyanide and the impure metal elements are shown as follows.

 
6CN + Fe2+ → [Fe(CN)6]4− (1)
 
[Fe(CN)6]4− + 2Fe2+ → Fe2[Fe(CN)6]↓ (2)
 
CO32− + M2+ → MCO3 (3)
 
3CO32− + 2Fe3+ + 3H2O → 2Fe(OH)3↓ + 3CO2 (4)
where M = Ca, Mg, Fe, Pb, Cu and Zn.

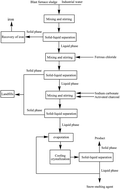
According to the above ideas, a flow chart for the preparation of the potassium chloride product was designed as shown in Fig. 1.


image file: c5ra12653c-f1.tif
Fig. 1 Flow chart of experimental process.

2.4 Recovery of potassium chloride from the BF flue dust

All the reagents used in the experiments were of analytical purity and used without further purification. On the basis of previous probing experiments, 2.0 kg of the BF flue dust was mixed with 8.0 L of water, stirred at the speed of 200 rpm at room temperature and filtered after 20 min. Then, the obtained eluent was treated with ferrous chloride at 2.5 times the theoretical quantity and stirred for 30 min. After filtration, a certain amount of sodium carbonate was added into the eluent until the pH was up to 8.0. Then, activated charcoal, at the rate of 2.5 g L−1 of the eluent, was added for decolorization. The purified eluent was filtered after 25–40 min. Finally, 700 mL of the purified eluent (with a KCl content of 51.80 g L−1 or 0.65 mol L−1, and an NaCl content of 4.02 g L−1 or 0.069 mol L−1) was subject to vacuum evaporation by a rotary evaporator27,28 in each run.

When a certain concentration of the condensed eluent was reached, the condensed liquor was cooled in a thermostatic cooling tank at 0 °C, 5 °C or 10 °C with a stirring speed of 120 rpm for 4 h.29,30 Then, by filtration, the dried crystals of KCl and the residual mother liquor were analyzed via the Na-TPB method to determine the potassium chloride content. Several runs of repeat experiments were carried out to ascertain the reliability of the process. The as-prepared products were also identified and characterized by XRD, LG, SEM, and ICP.

2.5 Characterization of the KCl products

2.5.1 XRD characterization. The structural characterization of the KCl products was performed by XRD. The X-ray patterns of the samples which were powdered to 300 mesh were acquired in the 2θ-range from 10° to 90° with a scan step of 0.05°/2θ and a fixed counting time of 1 s for each step. Finally, the patterns were analyzed by search-match software.
2.5.2 Granulometric analysis. The particle size distributions of the KCl products were measured with a laser granulometer (LG) by dry analysis.
2.5.3 SEM characterization. The products were examined by a SEM instrument for the granulometric distributions and the particle shapes.
2.5.4 ICP analysis. The products were analyzed with an ICP instrument to determine their contents and compositions.

3. Results and discussion

3.1 Physicochemical characterization of the BF flue dust

As shown in Fig. 2, the XRD pattern of the BF flue dust sample is presented with five major phases: iron oxide,31 potassium chloride, sodium chloride, magnesium chloride and calcium chloride. The strong diffraction peaks of potassium chloride illustrate its high content in the BF flue dust. In particular, the characteristic peaks of other potassium-containing compounds have not been discovered, probably due to the different compositions of iron ore. These results are identical with the data obtained by ICP analysis. Thus, potassium chloride is the only form of potassium-containing compound in the BF flue dust, which provides the theoretical foundation for further research into the recovery of large amounts of potassium chloride from the BF flue dust.
image file: c5ra12653c-f2.tif
Fig. 2 XRD pattern of the BF flue dust.

The granulometric distribution analysis of the BF flue dust sample is shown in Fig. 3 and Table 3. It exhibits a wide and non-uniform distribution of particle sizes, possibly owing to the capture technology of the BF flue dust in the ferrous metallurgy. The mean particle size P50 (the mass percentage of the particles at 50%), P10 and P90 of the BF flue dust is 37.47 μm, 6.27 μm and 254.64 μm, respectively. Combined with the small specific surface area of the dust which is shown in Table 3, a conclusion can be drawn that such granulometric distribution of the BF flue dust is beneficial to the leaching of soluble potassium compounds without the addition of a dispersant or surfactant.


image file: c5ra12653c-f3.tif
Fig. 3 Granulometric distribution of the BF flue dust.
Table 3 The granulometric characteristic parameters of the BF flue dust
Granulometric characteristic parameter Value
Median diameter, μm 6.63
Volume mean diameter, μm 91.44
Superficial area mean diameter, μm 16.87
Specific surface area, m2 g−1 0.36


The element content of the BF flue dust by chemical analysis combined with the ICP method is demonstrated in Table 4. The results showed that the metal content in the BF flue dust was 41.00% Fe, 20.72% K and 4.39% Mg, including a small amount of Pb (0.65%), Cu (0.12%), Zn (0.03%), Ca (0.51%), Na (0.55%) and total-cyanide (0.03%). This result indicates that the BF flue dust is a ferric oxide mixture with a high content of potassium, implying it is of great potential value for recovering.

Table 4 The main metal element constituents of the BF flue dust
Element TFe K Pb Cu Zn Ca Na Mg Total-cyanide
Content, wt% 41.00 20.72 0.65 0.12 0.03 0.51 0.55 4.39 0.03


3.2 The effect of operation conditions on the KCl recovery process

3.2.1 The effect of the dosage of activated charcoal on decolorization. The dosage of activated charcoal is a key factor in the adsorption for the decolorization of the eluent. The relationship between the dosage of activated charcoal and the chroma of the eluent was studied and the results are shown in Fig. 4. It can be found that the decolorization efficiency becomes better with the increase in the amount of activated carbon. Particularly, when 2.00 g L−1 of activated charcoal is used to treat the eluent, the chroma of the eluent decreases from 170° to 4° and the removal rate of the chroma rises up to 97.65%, possibly owing to the increase in active molecular particles in the sorbent. Moreover, when the dosage of activated charcoal is increased to 2.50 g L−1, the chroma in the eluent reduces to near 0. Therefore, 2.50 g L−1 was chosen as the optimum parameter for the dosage of activated charcoal in the decolorization.
image file: c5ra12653c-f4.tif
Fig. 4 The relationship between the dosage of activated charcoal and the chroma (experimental conditions: decolorization time = 30 min; agitation speed = 120 rpm; temperature = room temperature).
3.2.2 The effect of time on decolorization. Decolorization time is also a significant factor which has an important influence on the adsorption effect of activated charcoal. As shown in Fig. 5, the chroma decreases with an increase in the decolorization time. The chroma of the eluent declines from 170° to 17° after 25 min of adsorption time. Correspondingly, the chroma removal rate reaches 90%. Whereas after 35 min of adsorption time, the removal efficiency of the chroma reaches the highest value of 90.59%. Thus, 30 min was chosen as the proper decolorization time from the viewpoint of cost and the treatment capacity in industrial practice.
image file: c5ra12653c-f5.tif
Fig. 5 The relation between decolorization time and chroma (experimental conditions: dosage of activated charcoal = 2.50 g L−1; agitation speed = 100 rpm; temperature = room temperature).
3.2.3 The effect of agitation speed on decolorization. The speed of the agitator is a non-ignorable factor which does impact on the dosage of activated charcoal. As shown in Fig. 6, the tendency of the chroma in the eluent is to decrease with an increase in the stirring speed of the agitator. The chroma in the eluent markedly decreases from 170° to 15° at the stirring speed of 80 rpm and the removal efficiency of the chroma reaches 91.18%, probably due to the increase in the turbulence and mixing degree. Therefore, 80 rpm was selected as the suitable agitation speed.
image file: c5ra12653c-f6.tif
Fig. 6 The relation between the stirring speed and the chroma (experimental conditions: dosage of activated charcoal = 2.50 g L−1; decolorization time = 30 min; temperature = room temperature).

To validate the reliability of the selected operation conditions for the KCl recovery process, a further experiment was conducted under the following conditions; a dosage of activated charcoal of 2.50 g L−1, a decolorization time of 30 min, an agitation speed of 80 rpm and a temperature of 25 °C. The result shows that the chroma of the eluent decreases from 170° to 2° with a removal efficiency of 98.82%, indicating that the selected operation conditions are suitable to purify the chroma of the eluent.

After decolorization and purification, the element content of the purified eluent was analyzed by ICP with other chemical methods. The results are shown in Table 5. Table 5 indicates that the purified eluent is mainly composed of K with a little Na, Ca and Mg, and the elements Fe, Pb, Cu, and Zn and cyanide (CN) are not detected in the eluent, showing that the impurities are effectively removed by the separation process.

Table 5 The main element content of the purified eluent
Element Fe K Pb Cu Zn Ca Na Mg CN
Concentration, g L−1 Not detected 50.69 Not detected Not detected Not detected 0.08 0.03 0.55 Not detected


3.2.4 The effect of temperature on the KCl crystallization process. In the KCl crystallization process, the influence of temperature on the purity and the yield of the KCl crystals are shown in Fig. 7.
image file: c5ra12653c-f7.tif
Fig. 7 The influence of crystallization temperature on the KCl purity and yield (experimental conditions: mass distribution coefficient = 2.27; initial KCl crystallization concentration = 1.29 mol L−1 or 96.2 g L−1; crystallization time = 4.0 h).

Fig. 7 reveals that the potassium chloride purity of the crystals increases with the increase in the cooling crystallization temperature, whereas the yield of the KCl crystals decreases with the increase in the temperature. Therefore, to get more potassium chloride product from the eluent, the cooling crystallization temperature should be lower. Contrarily, the cooling crystallization temperature must be higher for the purpose of obtaining a high content of potassium chloride. Aimed at getting a higher content of potassium chloride to satisfy the quality demands regulated by the KCl product market, a higher cooling crystallization temperature in the range of 10 °C to 15 °C may be feasible, but the yield of the KCl product will be sacrificed a little.

3.2.5 The effect of KCl crystallization concentration on the crystal recovery. The influence of the initial KCl crystallization concentration in the condensed eluent on the purity and the yield of the product crystals is demonstrated in Fig. 8.
image file: c5ra12653c-f8.tif
Fig. 8 The influence of KCl crystallization concentration on the crystal purity and yield (experimental conditions: mass distribution coefficient = 2.27; crystallization temperature = 10 °C; crystallization time = 4.0 h).

Fig. 8 indicates that, at a certain cooling crystallization temperature, the potassium chloride purity of the product crystals decreases with the increase in the initial crystallization concentration of KCl in the condensed eluent, whereas for the yield, it rises up. This implies that the content of sodium chloride in the crystal products will be increased with the increase in the initial KCl crystallization concentration, which will lead to the deterioration of the crystal product quality.

3.3 Characterization and analysis of the KCl product

3.3.1 XRD results of the KCl products. The potassium chloride crystals obtained at different crystallization temperatures with the distribution coefficient (the mass of KCl in the crystal to that in the mother liquor) of 2.27 and the initial KCl crystallization concentration of 1.33 mol L−1 or 99.2 g L−1, were characterized by XRD and the results are shown in Fig. 9.
image file: c5ra12653c-f9.tif
Fig. 9 XRD patterns of the recovered crystals, and NaCl and KCl guide samples.

Combined with the standard XRD spectra of potassium chloride and sodium chloride, it can be seen from Fig. 9 that the characteristic diffraction peaks at 2θ = 28.38°, 40.47°, 50.15°, 58.61°, 66.35°, 73.66° and 87.66° are ascribed to potassium chloride. Whereas for the characteristic diffraction peaks at 2θ = 24.24°, 31.69°, 45.39°, 66.39°, 75.19° and 83.88°, they are ascribed to sodium chloride. Hence it can concluded that the recovered products contain a great amount of potassium chloride with very small amounts of sodium chloride or other impurities.

A further analysis of the recovered crystals was conducted by ICP combined with the Na-TPB or K-TPB method and the results are shown in Table 6. From Table 6, it can be seen that the recovered crystals are mainly composed of potassium chloride (97.08%) with very small amounts of sodium chloride (1.78%) and other impurities (0.08% of Ca, 0.04% of Mg) according to the ICP method. Whereas the chemical analysis method for the same sample reveals that the recovered crystals are composed of 96.77% potassium chloride, 1.91% sodium chloride, 0.10% Ca and 0.08% Mg. Therefore, it can be concluded that the recovered crystal products are of high content and purity of KCl, the Na- or K-TPB methods are of similar accuracy compared with the ICP method, and the quality of the KCl products is satisfactory for the demands of the national product standards of China regulated by GB6549-2011.

Table 6 The analysis results of the products by ICP and Na- or K-TPB methodsa
Analysis method KCl NaCl Ca Mg Ca + Mg
a Where the “*” represents the value from calculation.
ICP, % 97.08 1.78 0.08 0.04 0.12*
Chemical analysis 96.77 (Na-TPB) 1.91 (K-TPB) 0.10 (ICP) 0.08 (ICP) 0.18*
GB6549-2011 (ref. 23) ≥91.94 ≤2.00 ≤0.5 ≤0.4 ≤0.2


3.3.2 Granulometric distributions of the KCl products. The granulometric distributions of the crystal products obtained at a cooling crystallization temperature of 0 °C, 5 °C and 10 °C, correspondingly with the distribution coefficients of 2.27, 2.52 and 2.36 are demonstrated in Fig. 10.
image file: c5ra12653c-f10.tif
Fig. 10 Granulometric distributions of the products at cooling crystallization temperatures of (a) 0 °C, (b) 5 °C and (c) 10 °C.

Fig. 10 reveals that the mean particle size P50, P10 and P90 of the products is 94.29 μm, 39.91 μm and 169.48 μm at a cooling crystallization temperature of 0 °C, 98.58 μm, 38.46 μm and 178.82 μm at 5 °C and 107.74 μm, 44.18 μm and 194.59 μm at 10 °C, respectively.

From Fig. 10, it also can be seen that all the particles of the crystals obtained at different cooling crystallization temperatures exhibit a narrow size distribution, indicating that the particles have a considerably uniform size and the crystal products are of a good extrinsic quality.32

3.3.3 SEM results of the KCl products. The SEM images of the products at crystallization temperatures of 0 °C, 5 °C and 10 °C are shown in Fig. 11. The SEM characterization testifies that the principal crystalline forms of the products at different temperatures are all cubic and the size of the particles is comparatively homogeneous. Interestingly, it can be observed from the figure that the crystals become larger and larger with the rise in the crystallization temperature. It was reported that the products with a small particle size would be easy to consolidate, which would affect the stability and quality of the product.33 Therefore, the cubic potassium chloride crystals with a bigger particle size are beneficial to the stabilization of the products.34 In conclusion, the crystallization process operated at a higher temperature level is of advantage to the apparent quality of the KCl products.
image file: c5ra12653c-f11.tif
Fig. 11 SEM images of the products at cooling crystallization temperatures of (a) and (b): 0 °C; (c) and (d): 5 °C and (e) and (f): 10 °C.

4. Conclusions

In brief, a simple, efficient, economic and environmentally-friendly recovery process for large amounts of potassium chloride from BF flue dust is developed. This process is mainly composed of water-leaching, decolorization, purification, vacuum evaporation and cooling crystallization.

The physicochemical characterization revealed that the BF flue dust contained a high content of potassium chloride which was of recovery value.

The effects of the dosage of activated charcoal, the adsorption time and the agitation speed on the decolorization efficiency were investigated. By single-factor experiments, the appropriate operation conditions for the decolorization of the eluent from the water-leaching of the BF flue dust were selected as follows: 2.50 g L−1 of activated charcoal, 30 min of adsorption time and an 80 rpm stirring speed. Under these conditions, the removal efficiency of the chroma in the eluent was 98.82%. By a further chemical precipitation of sodium carbonate, the impure elements of Ca, Mg, Fe, Pb and Cu in the eluent were effectively separated from K and Na.

In the KCl crystallization process, the influence of temperature and the initial KCl crystallization concentration of the condensed eluent on the purity and the yield of the KCl crystal products were studied. The results showed that a cooling crystallization temperature of 10 °C to 15 °C was feasible, and that the purity of the KCl crystal products decreased whereas the yield increased with the increase in the initial crystallization concentration of the KCl in the condensed eluent.

The KCl crystal products obtained at different cooling crystallization temperatures and the mass distribution coefficients were analyzed by ICP or chemical methods and characterized by XRD, SEM and LG, respectively. The qualitative XRD combined with the quantitative ICP or chemical analysis results showed that the recovered KCl products contained a great amount of potassium chloride with a purity of greater than 96.00%, and very small amounts of sodium chloride or other impurities were detected in the products, implying that they are satisfactory to meet the national product standards of China regulated by GB6549-2011. The SEM and LG analysis revealed that the KCl crystal products exhibited a narrow particle size distribution with P50, P10 and P90 values of 94.29–107.74 μm, 38.46–44.18 μm and 169.48–194.59 μm, respectively, indicating that the KCl crystal products have a good extrinsic quality, and that a crystallization process operated at a higher temperature level is beneficial to the stabilization and the apparent quality of the products.

Acknowledgements

Financial support from the Natural Science Foundation of Hunan Province (14JJ5027), and the Major National Science and Technology Project of Control and Management of Water Pollution (2010ZX07212-008) are gratefully acknowledged.

References

  1. J. Vereš, M. Lovás, Š. Jakabský, V. Šepelák and S. Hredzák, Hydrometallurgy, 2012, 129, 67–73 CrossRef PubMed.
  2. B. Das, S. Prakash, P. Reddy and V. Misra, Resour., Conserv. Recycl., 2007, 50, 40–57 CrossRef PubMed.
  3. X.-Y. Wang, H.-L. Zhang and K.-J. Tian, Metallurgical Economy and Management, 2014, pp. 9–15 Search PubMed.
  4. B.-G. Liu, J.-H. Peng, Li-B. Zhang, S.-M. Zhang and J.-L. Mao, Express Information of Mining Industry, 2007, vol. 23, pp. 14–19 Search PubMed.
  5. Y.-L. Wang, Y.-Q. Yang, G.-L. Li, Z.-K. Duan and W.-Y. Liu, Inorganic Salt Industry, 2007, vol. 39, pp. 42–44 Search PubMed.
  6. C. Földi, R. Dohrmann and T. Mansfeldt, Chemosphere, 2014, 99, 248–253 CrossRef PubMed.
  7. M. V. Cantarino, C. de Carvalho Filho and M. Borges Mansur, Hydrometallurgy, 2012, 111, 124–128 CrossRef PubMed.
  8. A. López-Delgado, C. Pérez and F. Lopez, Water Res., 1998, 32, 989–996 CrossRef.
  9. C. Li and C.-S. Cong, Environmental Protection and Circular Economy, 2011, vol. 31, pp. 15–17 Search PubMed.
  10. T. Mansfeldt and H. Biernath, Anal. Chim. Acta, 2001, 435, 377–384 CrossRef CAS.
  11. R. R. Dash, C. Balomajumder and A. Kumar, Chem. Eng. J., 2009, 146, 408–413 CrossRef CAS PubMed.
  12. Ü. B. Öğütveren, E. Törü and S. Koparal, Water Res., 1999, 33, 1851–1856 CrossRef.
  13. S. Sirianuntapiboon, K. Chairattanawan and M. Rarunroeng, J. Hazard. Mater., 2008, 154, 526–534 CrossRef CAS PubMed.
  14. M.-Q. Guo, Z.-J. Niu and Z.-X. Tian, China’s Mining Industry, 2011, vol. 20, pp. 37–40 Search PubMed.
  15. X.-W. Zhang, Ind. Miner. Process., 2006, 35, 1–4 CAS.
  16. Z.-C. Shang, G. Liu and J. Bao, Fert. Ind., 2012, 39, 5–8 CAS.
  17. J.-M. Zhang, Guangzhou Chem., 2010, 38, 55–56 CAS.
  18. X. Liu, X. M. Jiang and Y. Yang, Met. Mater. Metall. Eng., 2011, 39, 40–57 Search PubMed.
  19. J.-H. Chang, Chemical Industry and Engineering Technology, 2013, vol. 34, pp. 58–61 Search PubMed.
  20. Z. Shen, B. Han and S. R. Wickramasinghe, Desalination, 2006, 195, 40–50 CrossRef CAS PubMed.
  21. H. L. Jia and M. L. Pan, Light Met., 2007, 17–20 Search PubMed.
  22. G. Zhan and Z. Guo, J. Environ. Sci., 2013, 25, 1226–1234 CrossRef CAS.
  23. GB6549–2011.
  24. N. Adhoum and L. Monser, Chem. Eng. Process., 2002, 41, 17–21 CrossRef CAS.
  25. N. Kuyucak and A. Akcil, Miner. Eng., 2013, 50, 13–29 CrossRef PubMed.
  26. L.-F. Chen, X. Liu, Z.-Q. Qiao, W.-Y. Wang, Y.-Q. Yang and H.-Z. Peng, Ind. Water Treat., 2011, 31, 73–77 CAS.
  27. M. Matsuoka, K. Yamamoto, H. Uchida and H. Takiyama, J. Cryst. Growth, 2002, 244, 95–101 CrossRef CAS.
  28. J. W. Mullin and J. Mullin, Crystallization, Butterworth-Heinemann, Oxford, 1993 Search PubMed.
  29. L.-H. Qian, B.-N. Lu and C.-Y. Ren, J. Salt Chem. Ind., 2006, 35, 15–17 CAS.
  30. H.-B. Qi, W.-Q. Yang and G.-C. Wang, Inorganic Salt Industry, 2007, vol. 39, pp. 41–43 Search PubMed.
  31. A. Lopez-Delgado, C. Perez and F. Lopez, Carbon, 1996, 34, 423–426 CrossRef CAS.
  32. H.-B. Qi, W.-Q. Yang and H.-N. Zhao, J. Salt Chem. Ind., 2006, 35, 4–7 CAS.
  33. A. G. Jones, Crystallization process systems, Butterworth-Heinemann, 2002 Search PubMed.
  34. A. Mersmann, Drying Technol., 1995, 13, 1037–1038 CrossRef PubMed.

This journal is © The Royal Society of Chemistry 2015
Click here to see how this site uses Cookies. View our privacy policy here.