DOI:
10.1039/C5RA12319D
(Paper)
RSC Adv., 2015,
5, 84056-84065
Tailoring the surface properties of cerium oxide nanoabrasives through morphology control for glass CMP
Received
25th June 2015
, Accepted 15th September 2015
First published on 16th September 2015
Abstract
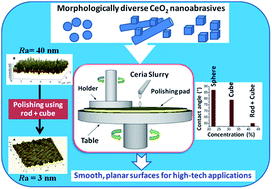
Nanosized cerium oxide (CeO2) particles possessing different morphologies like nanorods, nanocubes and nanospheres have been successfully synthesized by a simple one step, surfactant free, precipitation technique and by hydrothermal methods. The diverse morphology motifs were further utilized for the planarization of silicate glass with an initial surface roughness of ∼40 nm and we observed a strong morphology dependence of the abrasive in glass polishing. Polishing efficiency of the nanoabrasives in terms of the mass removal and surface roughness was investigated using a table top lapping machine. Surface roughness analysis by atomic force microscopy reveals that the ceria nanostructure with a mixed morphology of rods and cubes could produce a surface finish of ∼3 Å. The surface properties of the abrasive were found to play a key role in polishing as evidenced by X-ray photoelectron spectroscopy and Raman spectral analysis. The powder contact angle/hydrophilicity of the nanopowders followed the same trend as that of the dipolar (200) plane and [Ce3+]. This work has shown promise in polishing efficiency with nano CeO2 slurry to achieve nanolevel planarity on glass substrates, which is desirable for the global planarization of complex device topography.
Introduction
Inorganic nanocrystals with tailored geometries display exceptional shape dependent phenomena and consequently utilization of them as building blocks for the fabrication of nanodevices is of significant interest. Motivated by both the possible applications and their excellent innate properties, much attention has been directed to the controlled synthesis of cerium oxide (also known as ceria, CeO2) nanophase materials. Some of the widespread applications of this endowed inorganic oxide are in heterogeneous catalysis,1 solid oxide fuel cells,2 optical films,3 polishing materials,4 gas sensors,5 and oxygen membranes. Ceria in its fluorite structure exhibits several native defects depending on the partial pressure of oxygen, which is the intrinsic property for its potential in catalysis, energy conversion, and others.
Academic interest in ceria largely stems from their use in modern automotive catalysts and also as an abrasive in the chemical-mechanical planarization (CMP) of silicon substrates. Many technological applications of glass such as displays, microelectronics, optical windows and advanced lithography depend upon the planarity of the surface. Moreover, clean, smooth, and reproducible sample surfaces are desirable for various surface science studies of materials, e.g., corrosion, adsorption, film deposition, etc.6 Ceria is the most widely used abrasive for the CMP of silicate glasses,7 to finish CRT screens, in LCDs and it is extensively used in ophthalmic industry for prescription lens polishing.8 CMP appears to be the most promising technology in microelectronic fabrication for the planarization of globally complex device topographies.9 Ceria slurries have stimulated widespread interest because of enhancements in the material removal rate, surface finish, and selectivity over slurries formulated with silica abrasives.10
Conventional colloidal silica slurries widely used in the polishing of silicon wafers contain lots of toxic chemicals and hence the chemical pollution after CMP is still a big concern.11 Though both ceria and alumina possess proper chemical and mechanical properties suitable for polishing, the enhanced chemical reactivity of ceria makes it a superior candidate in glass polishing. There are only few a published reports on glass polishing using nanostructured ceria in the past couple of decades.8,12–16
The effect of ceria abrasive slurry consistency in optical glass polishing was investigated by Wang et al. who observed that the material removal rate increases with a decrease of the ceria concentration.7 A lot of controversy exists around the effect of the particle size and concentration of slurry on polishing. For instance, the polishing rate was reported to increase with both the particle size and concentration,17,18 while others claim that a decreased particle size led to higher polishing rates,19 or had no effect on the same.12 Jindal et al. evaluated a mixed abrasive slurry containing alumina/ceria particles in dielectric CMP performance at a slurry pH of 4 and demonstrated an excellent selectivity of oxide over nitride as well as very low rms surface roughness values of ∼1 nm, making them attractive candidates for the shallow trench isolation (STI) CMP process.20 However, the stabilization of ceria in water is still a big challenge to be tackled and the use of dispersants is normally recommended.21 The dispersion agents used by manufacturers for preparing commercial CMP slurry are proprietary and are not disclosed to the users. Some of the dispersants reported in the literature include polyethylene glycol,21 polyacrylic acid etc.13 Luo et al. have studied the stabilization of alumina slurry using different dispersants and found that the addition of polyethylene glycol improves the slurry stability significantly, leading to a stable alumina slurry that can be utilized for the CMP of copper.21 Another seminal factor reported in glass polishing is the pH of the slurry. Both polishing rates and the surface smoothness are maximized in the pH range of 9.5–10, where 50% of the surface silanols are dissociated.11,12 Though few reports are available on the effect of the pH,11 slurry consistency7 and particle size,9,22 no detailed study was carried out on the nanoabrasive morphology dependent polishing and mechanism of glass polishing/removal using nanoceria.
In the present work, we have demonstrated synthetic strategies for anisotropic shapes of ceria such as spheres, rods, and cubes by precipitation methods along with hydrothermal treatment, employing cerium nitrate hexahydrate as the precursor. The prepared NPs have been utilized in polishing slurries in glass polishing and the surface properties of the abrasives have been correlated with the quality of the polished surface. The effect of the morphology of the abrasives, pH and solid content of the slurry on the planarity achieved by polishing a glass substrate has been systematically carried out. The present work gives new insight into the morphology dependent glass polishing mechanisms.
Experimental section
Synthesis
Small crystals of spherical cerium oxide (AP) were synthesized by ammonia precipitation using 0.5 M Ce(NO3)3·6H2O (CN) aqueous solution by the salt into precipitant (SIP) technique using ammonia as the precipitant.23 The detailed synthetic procedures are reported elsewhere.23–25 Nanorods and nanocubes of ceria were fabricated by a hydrothermal method at different autoclaving temperatures and concentrations of precipitant. For nanorod preparation, cerium hydroxide was precipitated from 0.5 M cerium nitrate hexahydrate solution using 8 M sodium hydroxide solution. The slurry was stirred vigorously and transferred to the 1 litre autoclave set at 120 °C. The sample so obtained is henceforth called HT1. For preparation of the nanocubes (HT2), the synthesis conditions were identical to those of HT1 with two exceptions: the hydrothermal treatment temperature used was 180 °C and the concentration of the precipitant was 5 M instead of 8 M. A commercial ceria powder (CC) normally used in the glass polishing industry was also included in the present study for comparison.
Slurry preparation
Previously weighed CeO2 nanopowder and carboxy methyl cellulose (CMC) dispersant were added to 100 ml distilled water and stirred mechanically at 3000 rpm for 2 h.
Surface treatment of the microscopic glass
The microscopic glass slides were cut into small pieces of a 1 × 1 cm2 area and were cleaned by ultrasonicating in water and ethanol alternatively several times and dried. To induce roughness on the glass substrate chemical etching using 5% hydrofluoric acid has been carried out.26 These chemically etched rough glass substrates were used for all further polishing studies.
Polishing study on the glass substrate
A table top lapping machine (Buehler, Germany) was used for the polishing purpose. Total material removal, as a function of time, was estimated by polishing the glass substrate against a rotating disc while a slurry containing nanosized CeO2 abrasives was charged on the rotating disc at a uniform rate. The diameter of the rotating disc of the lapping machine was ∼20 cm and was covered with a Selvyt polishing cloth. The pressure applied on the work-piece was 2 psi. A new polishing pad was used for every slurry without any pre-treatment, such as diamond conditioning etc. Since the slurry was only used on a single pass (as opposed to recirculation), changes to the slurries’ particle size distribution with recirculation are not considered in this study. Microscope glass slides of thickness ∼2 mm were used for polishing against a wet-cloth in the presence of the nanosized CeO2 slurry. The speed of rotation was 150 rpm for all the polishing experiments. The glass substrate was held at a point close to the periphery of the polishing disc. A slurry of ceria powders with consistency 1–10 wt% was used as the abrasive for polishing the glass substrates and was poured onto the disc (close to the point where the glass substrate was held) at a rate of ∼10 ml min−1.
Characterization techniques
The phase composition of the solid products was determined from the powder X-ray diffraction patterns collected at room temperature using a Philips X’PERT PRO diffractometer with Ni-filtered Cu Kα1 radiation (λ = 1.5406 Å). The X-ray data was collected in the 2θ range between 20 to 100° at a scanning rate of 2° min−1 with a step size of 0.04°. The broadening of the X-ray diffraction peaks (Bragg peaks) is related to the average grain size and microstrain in the crystal lattice. Particle size information was obtained by analyzing the XRD peak widths using the Williamson–Hall (also known as Cauchy–Cauchy) procedure.27 This is in preference to the Scherrer approach, which underestimates the grain size when there is significant microstrain in the lattice.4
The morphology of the synthesized materials was studied by means of high-resolution transmission electron microscopy (HR-TEM) using an HR-TEM system (FEI Tecnai 30 G2 S-Twin) operated at 300 kV. Raman spectra were taken using a HR800 LabRAM confocal Raman spectrometer with excitation by a 20 mW, 633 nm He–Ne laser. The spectrum was recorded using a Peltier cooled CCD detector with an acquisition time of 10 s using a 5× objective. X-ray photoelectron spectra were recorded with a VG Microtech Multilab ESCA 3000 spectrometer maintaining a base pressure of the analysis chamber in the range of 3–6 × 10⁻¹⁰ Torr using Mg Kα excitation (1253.6 eV, 10 kV and 25 mA). Selected profiles, especially N 1s and valence band spectra were recorded to eliminate the overlap between different Auger and/or core levels. The spectrometer was calibrated with the Au 4f7/2 core level at 83.9 eV. The surface roughness analyses of the glass slide before and after polishing were done with a I120 Taylor Hobson surface profilometer and the AFM analysis was carried out with NTEGRA (NTMDT) using microfabricated TiN cantilever tips (NSG-10) with a resonating frequency of 299 kHz, a spring constant of 20–80 N m−1 and a multimode scanning probe microscope (Nanoscope IV controller, digital instruments), using tapping mode techniques. 2D surface roughness analysis was performed using the raw AFM images. Five measurements were used to compute the average surface roughness of each sample. The dynamic water contact angle of the polished glass slides and powders were measured using the DataPhysics DCAT 21 Dynamic contact angle meter and tensiometer. The dynamic contact angle analyzer operates by holding a glass slide in a fixed vertical position attached to a microbalance and moving a test liquid (water) contained in a vessel at a constant rate up.
Results and discussion
Electron microscopy
Detailed morphological and structural analyses of the samples were done by bright field high-resolution TEM, typical images are shown in Fig. 1. In the precipitation approach, the NPs are slightly agglomerated (panel E) compared to the hydrothermally synthesized crystals (A and C). This may be due to the formation of hydrogen bonds between the water molecules adsorbed on the approaching crystals. A hydrothermal process at the boiling temperature was reported to be effective to dehydrate the adsorbed water and decrease the hydrogen bonding effect leaving a weakly agglomerated powder of hydrated ceria.28 The ammonia precipitated CeO2 NPs in AP are found to be almost spherical. The mean particle size (DTEM) in AP is 8.2 nm with a standard deviation of σ = 0.99 nm (DXRD = 7 nm). Mild hydrothermal treatment at 120 °C with a high base concentration (8 M) produced predominantly nanorods (HT1) from an anisotropic growth of the unstable Ce(OH)3 nuclei, governed by the dissolution recrystallization mechanism.29
 |
| Fig. 1 TEM images of the hydrothermally synthesized CeO2 crystals. (A and B) HT1 containing nanorods and cubes autoclaved at 120 °C, (C and D) HT2 CeO2 nanocubes, (E and F) AP containing spheres, (G) CC containing highly agglomerated particles, and (H) an HR-TEM image of a nanorod in HT1 showing the exposed crystal facets. | |
When the autoclave temperature was increased to 180 °C (HT2) nanocubes were formed. The average size from TEM (DTEM) for HT2 is 13.5 ± 2.5 nm. The TEM images of the HT1 sample demonstrate that it consists of a mixture of cubic and rod-shaped crystals of CeO2. Detailed analysis of multiple images of HT1 reveals that it contains ∼28.1% (number) of nanorods with an average length of ∼370 nm and diameter ∼24 nm, that is, an aspect ratio of ∼15. This equates to an average (equivalent sphere) diameter of 64.3 nm. The remaining 71.9% are nanocubes with an average edge length of ∼20.2 nm. By volume (or mass) the sample is approximately 88.8% rods and 11.2% cubes. An HR-TEM image of a typical nanorod (layer H) shows one-dimensional (1D) growth in the (220) direction with (111) as well as (200) terminated surfaces.
X-ray diffraction analysis
XRD patterns of the three samples HT1, HT2 and AP can be readily indexed to a pure fluoritic cubic phase (space group: Fm3m) of CeO2 with a lattice constant of 0.5411 nm (JCPDS 34-0394)30 as shown in Fig. 2. Williamson–Hall plots for all the nanocrystalline CeO2 powders are also shown in Fig. 2.
 |
| Fig. 2 (A) X-ray diffraction patterns and (B) Williamson–Hall plots of CeO2 powders (a) HT1, (b) HT2, (c) AP and (d) CC. | |
The average crystallite size of the nanocrystalline ceria powders was evaluated from line-profiling of the prominent X-ray diffraction peaks using the Williamson–Hall approach and was found to be 19, 14.1, 7 and 15.8 nm in HT1, HT2, AP and CC respectively. There is a moderate broadening of the diffraction peaks in AP, which suggests smaller crystals in this sample.
Dispersant optimization and stability of the polishing slurry
The change in the apparent viscosity of the 5 wt% HT1 ceria dispersion as a function of CMC dispersant at its natural pH (6.1) is presented in Fig. 3. The viscosity was found to decrease initially, reaching a minimum with 1 wt% CMC and increases with further increase in the concentration of the dispersant. A similar effect was observed by Kuo et al. in silica based slurry in the presence of several polymeric dispersants.31 The increase in viscosity beyond 1 wt% may be due to the presence of a large number of ions in the solution phase which enhances the charge shielding to compress the electrical double layer around the particles. So the optimum dispersant concentration was fixed at 1%. The stability of the polishing slurry was monitored by performing turbidity measurements (transmittance of visible light)4,32 against time and is presented in Fig. 3.
 |
| Fig. 3 (A) Viscosity of the ceria slurry as a function of the concentration of CMC, and (B) turbidity measurement of the 1 wt% CMC added HT1 ceria slurry. | |
The slurry was visibly stable at room temperature for ∼1 day without changing its appearance, and after this period settling was observed which is corroborated by the decrease in turbidity.
Glass polishing: surface treatment of microscopic glass
Chemical etching using hydrofluoric acid (HF) was reported to be an efficient way to induce roughness on the ceramic substrates.26 The average surface roughness of the microscopic glass slide increased from initial ∼7 nm to 40 nm, higher than that reported by Zogheib et al. on etching using 5% HF for 90 s. This may be due to a change in the etching mechanisms according to the type of the ceramic microstructure and composition.
HF reacts with the glass matrix that contains silica and forms hexafluorosilicate which is selectively removed and the crystalline structure is exposed. As a result, the surface of the ceramic becomes rough.26 This chemically etched rough glass substrate (Fig. 4B) was used for all further polishing studies. Typical 3D AFM images of the glass polished using HT1, HT2, AP abrasive and CC are shown in Fig. 5 and the respective Ra values are graphically presented in Fig. 6.
 |
| Fig. 4 AFM 3D images of the microscopic glass (A) before and (B) after etching. | |
 |
| Fig. 5 AFM images of the glass slide polished using 5 wt% slurry of (A) HT1, (B) HT2, (C) AP and (D) CC. | |
 |
| Fig. 6 (A) Surface roughness analysis and water contact angle of the glass slide polished using a 5 wt% slurry of ceria abrasives. A schematic of HT1 polishing a glass substrate is shown as the inset. (B) Surface profiles of the glass (a) before polishing showing an Ra value of 50 nm and (b) after polishing with HT1 resulted in Ra = 8 nm. | |
The “error bars” for the roughness data represent the spread in the results of the five repeat experiments. HT1 having a mixed morphology of rods and cubes seemed to be most efficient in producing a smooth surface with an average surface roughness (Ra) of 3 nm, followed by HT2 and AP1. AP1 with its high specific surface area 134 m2 g−1, leads to a transient soft agglomerate formation in the CMP slurries33 which is expected to be higher in the fine spherical particles in AP1. Such agglomerates can cause defects on the substrate which is to be polished. Indeed, it was reported previously that the commercial CMP slurries tend to coagulate and partially disperse during the polishing process, confirming the presence of these agglomerates.33 The profilometry data (Fig. 6B) further supports the AFM results as evidenced by an Ra value of 50 nm for the chemically etched glass and 8 nm for the glass polished using HT1. The water contact angle values of the glass slides measured by the dynamic contact angle method presented in Fig. 6 further elucidates the reduction in the surface roughness. The water contact angle increases from 60 to 64° as we move from CC to HT1 which was in accordance with the Wensels law, which states that the water contact angle for a wettable/hydrophilic glass surface decreases with increased surface roughness.34
The material removal rate of the ceria abrasive in terms of the weight reduction is shown in Fig. 7. Next to CC, HT1 containing a mixed morphology of rods and cubes exhibited the highest material removal rate of 0.18 mg cm−2 min−1 which is followed by HT2 and finally AP.
 |
| Fig. 7 Material removal rate in terms of weight reduction of the glass substrate as a function of the morphology of the ceria abrasive. | |
This can be attributed to the synergistic effect between the chemical corrosion and mechanical abrasion of the ceria abrasive in removing materials. Due to the large effective particle size, agglomerated commercial ceria powder appeared to be better in material removal, though the surface quality was poor (Ra ∼ 26 nm).
Role of Ce3+/defects: XPS and Raman spectral analysis
The morphology dependence of the nanoceria abrasive in glass polishing is further supported by XPS and Raman spectral analysis as shown in Fig. 8 which gives new insight into the surface properties of the abrasives. In the Ce 3d spectrum, the vo, v1, uo, and u1 peaks are attributed to Ce3+; while v, v′′, v′′′, u, u′′ and u′′′ are the characteristic peaks of the Ce4+ ions. The Ce3+ content is estimated using the integrated area of each peak in the deconvoluted Ce 3d spectrum as 42.1, 31.4 and 22.2% for HT1, HT2 and AP respectively (Table 1). The Ce 3d spectrum of the commercial ceria could not be resolved as it contains impurities (dopant cations).25
 |
| Fig. 8 Deconvoluted Ce 3d XPS pattern of (A) HT1, (B) HT2, (C) AP, and (D) Raman spectra of (a) AP and (b) HT1. | |
Table 1 Characteristics of the ceria nanoabrasive used for glass polishing
Sample code |
DXRD (nm) |
DTEM (nm) |
Surface area (m2 g−1) |
Contact angle (°) |
[Ce3+] (%) |
I200/I111 |
C[200] |
JCPDS file 34-394. |
HT1 |
19.0 |
64 |
22.96 |
60 ± 1 |
42.1 |
0.538 |
1.34 |
HT2 |
14.1 |
13.5 |
25.87 |
79 ± 1.5 |
31.4 |
0.453 |
1.2496 |
AP |
7.0 |
8.2 |
134.2 |
87 ± 0.7 |
22.2 |
0.363 |
1.0674 |
CC |
15.8 |
20 |
5.12 |
90 ± 1.2 |
— |
0.27 0.3a |
0.9526 |
It is well-known that the presence of Ce3+ in the fluorite lattice generates oxygen vacancies to maintain a charge balance35,36 as shown in eqn (1):
|
4CeO2 → 2CeO2 + Ce2O3 + V0 + (1/2)O2
| (1) |
where V
0 is the vacancy generated by the presence of Ce
3+.
The presence of the surface oxygen vacancies in the materials was monitored by UV-Raman spectroscopy (Fig. 8) which shows the presence of peaks at 460 (γ), 560 (α) and 600 cm−1 (β) respectively. The main peak at ca. 460 cm−1 is due to the F2g mode vibration of the cubic fluoritic structure in CeO2.37 The phonon modes at 560 and 600 cm−1 are characteristic of the oxygen vacancies in the ceria system.35,37,38 The relative density of the defect sites (∼560 cm−1) in nanoparticulate CeO2 was higher in HT1 compared to that in AP.39
Mechanism of glass polishing
Material removal from the glass surface has been proposed to occur by three basic mechanisms: (1) fracturing, (2) plastic flow, and (3) chemical reaction.15 When the load on the substrate is very low as in the present case, the material removal mechanism is predominantly chemical which proceeds through condensation and hydrolysis reactions as proposed initially by Cook.12 Accordingly, the hydration layer present on the ceria abrasives contains Ce–OH groups which react with the active –Si–O– sites on the silicon dioxide surface to form Ce–O–Si structures. As the Si–O–Si structures in silicon dioxide are weaker than the Ce–O–Si structures, the former are ruptured during polishing due to the mechanical action of the rotating pad. Further, as suggested by Cook et al.,12 more Ce3+ on the surface of the abrasive in the slurry could be beneficial for the CMP process due to the ease of forming a Ce(OH)3 hydration layer which would accelerate the process of CMP.11 Later, Sabia and Stevens15 postulated that an increase in the number of active sites on the ceria abrasives due to the reduction of Ce4+ to Ce3+ might be responsible for the bonding between Ce3+ on the ceria abrasives and silicon dioxide on the substrate.40,41 We also observed a similar trend in which better polishing efficiency in terms of the enhanced surface smoothness and material removal rate was observed with HT1 possessing 42% Ce3+ on the surface.
Hydrophilicity of nanoabrasives
We further measured the powder contact angle values of the nanoabrasives by dynamic water contact angle measurements done in triplicate as it is known that chemical reactions at a liquid and solid interface depend on their contact angle.11,31 The average value of the water contact angles was found to be 60°, 79°, 87° and 90° in the case of the rod-cube, cube, sphere and commercial ceria respectively. We attribute this variation in the contact angle to (i) the change in morphology, (ii) which in turn changes the [Ce3+] and (iii) the predominance of the polar 200 surface. The surface interaction with water is strongly dependent on the ceria oxidation state: no chemisorbed water is possible above 300 K for the fully oxidized ceria (Ce4+). But chemisorbed water and hydroxyls persist up to 500 K on the reduced ceria (Ce3+).42 Hence a reduced ceria surface promotes the dissociation of water, which in turn leads to an enhanced formation of Si–OH linkages that break up the Si–O bonds at the glass surface.42 A similar observation by Martinez et al. suggests that the overall positive charge of the defective oxides allows water to be bounded to the structure which makes such systems more hydrophilic.43 In line with Bentley et al. and Martinez et al. we also observed that HT1 containing 42% Ce3+ is highly hydrophilic as evidenced by a powder contact angle value of 60°. The (200) surface in ceria is a type III dipolar surface44 as shown in Fig. 9 which consists of alternating layers of cerium cations and oxide anions. Datye et al. observed distinct –OH stretching bands for nanoshapes such as rods, cubes and octahedra which they correlated with different surface terminations/exposed planes of the nanostructures.45 Further, they observed that (100) terminated nanostructures possess specific hydroxyl bands more strongly than (111) terminated structures, indicating their enhanced hydrophilicity.
 |
| Fig. 9 A dipolar (200) surface of CeO2. | |
The preferred orientation of the polar crystallographic plane (200) was estimated by performing a Harris analysis on the powder XRD data and expressed as the texture coefficient C(hikili), following the eqn (2):
|
 | (2) |
where
I(
hikili) is the diffraction intensity of the (
hikili) plane of the particular sample under investigation,
Io(
hikili) is the intensity of the (
hikili) plane from the standard JCPDS powder diffraction pattern for the corresponding peak
i, and
n is the number of reflections taken into account. A sample with randomly oriented crystallites presents a
C(
hkl) of 1, while a larger value indicates an abundance of crystallites oriented to that (
hkl) plane. The powder contact angle value of the nanopowders followed the same trend as that of
C(200) and [Ce
3+]
i.e., HT1 > HT2 > AP > CC as tabulated in
Table 1. Additionally, the
I200/
I111 value, calculated for HT1 (see
Table 1) using XRD data is ∼79% higher than that for the bulk ceria (JCPDS file: 34-394) whereas the commercial ceria powder followed the same trend as that of the bulk ceria.
The glass substrate being hydrophilic; a smaller powder contact angle value of 60° in the mixed morphology abrasive HT1 accounts for a better interfacial wettability, which enhances the chemical reaction at the solid–liquid interface.11
Effect of the abrasive content in the slurry
The etched glass substrate was polished using HT1 of varying solid consistency between 1 to 10 wt% for 10 min of polishing. The respective Ra and contact angle values of the polished glass substrate are graphically presented in Fig. 10. Typical AFM images of the glass substrate, polished with a slurry containing 1 and 5 wt% abrasive is also shown in Fig. 10. The Ra value was found to decrease with an increase in the solid content and attained a minimum value of 3 nm with 5 wt% slurry.
 |
| Fig. 10 (A) Surface roughness analysis from AFM and water contact angle values of glass polished using 1–10 wt% (a–d in the inset) slurries of HT1. Typical 3D AFM images of glass polished using (B) 1 wt% and (C) 5 wt% slurry. | |
Further increase in the slurry consistency does not show any more improvement in the Ra value as the abrasive particles might have already reached a monolayer close-packed arrangement in between the polishing pad and the 1 cm2 glass substrate as shown in the inset of Fig. 10A. This observation was contradictory to that reported by Wang et al., but most of the polishing slurries reported in the literature use concentrated slurries.7,22,31
Effect of pH of slurry
The effect of pH in glass polishing was studied by performing polishing experiments using a slurry of HT1 at pH 4, 6.1 and 10. The Ra values from the AFM analysis versus the pH of the slurry and the zeta potential against the slurry pH are presented in Fig. 11. Detailed study on the electrokinetic properties of the polishing slurry gave new insight into the mechanism of the material removal in the glass polishing process. The CMC dispersant was found to influence the electrokinetic properties of the ceria slurry as evidenced by the zeta potential measurements (Fig. 11). The isoelectric point (IEP/PZC) of the pure ceria slurry was found to be at pH 6.7 which is very close to the value reported by others.46 CMC is an anionic linear polyelectrolyte and its molecular conformation in aqueous solution strongly depends on the concentration, ionic strength and pH value.47 On addition of 1.0 wt% CMC, CeO2 particles become negatively charged in the entire experimental pH range. A similar behavior was observed by Shen et al. in aluminium oxide suspensions on the addition of a cationic polyelectrolyte polydiallydimethylammonium chloride (PDADMAC).48 Rapid adsorption of a large number of negatively charged CMC molecules takes place on the positively charged NPs causing charge neutralization and causes a relatively strong charge inversion (zeta potential −8.5 mV at pH of 2.9). At pH values above the pKa of CMC (pH 3.65), the dissociation of the CMC molecules increases and the molecular chains possess a partially expanded structure with strong electrostatic repulsion between the neighboring CMC chains.47,49,50 Hence at a pH above 4, the adsorption of the CMC molecules onto the NPs increases, thereby stabilizing the ceria NPs in the slurry as evidenced by a zeta potential in the range of −(40–60) mV.
 |
| Fig. 11 (A) The surface roughness analysis and advancing water contact angle of glass polished with slurry at pH 4, 6 and 10 and (B) zeta potential of the ceria slurry as a function of pH with and without CMC. | |
The Ra value of the glass surface was found to be 1, 3 and 0.3 nm after polishing using a slurry of pH 4, 6.1 and 10 respectively. The hydrolysis of the –Si–O–Si– links in the glass is both hydroxyl and hydronium ion catalyzed,51 which is a major step involved in the glass polishing as mentioned earlier. Hence the slurry pH of 4 and 10 facilitate the glass polishing and bolster performance. At pH 10, far away from the IEP of ceria (6.7), the CeO2 abrasive slurry possesses a superior dispersion stability as evidenced by a zeta potential value of (51 ± 5) mV and enables fine polishing of the glass substrate. Further, the acceleration of the chemical etching happens in alkaline solution (at pH 10)11 which improves the surface quality of the glass to 3 Å. These results demonstrate that the electrostatic repulsion, providing superior dispersion, is one of the essential parameters for polishing slurry.
Conclusions
Spherical, fine cerium oxide nanoparticles have been synthesized by a simple ammonia precipitation method. Anisotropic shapes of CeO2 crystals, such as rods and cubes were synthesized by hydrothermal treatment of the hydrated oxide precipitate. The polishing efficiency tests showed a clear morphology of the abrasives and a pH dependency in achieving smoother surfaces with an optimum material removal rate. Surface roughness analysis by AFM reveals that the ceria sample with a mixed morphology of rods and cubes could produce a surface finish of ∼0.3 nm in alkaline medium. In the present study, a precise control over the glass polishing was achieved by tailoring the amount of Ce3+ in the CeO2 abrasive through simple synthetic protocols. Predominance of the Ce3+ and dipolar (200) surface was found to strongly influence the hydrophilicity of the nanoabrasives which in turn resulted in nanolevel planarity on the glass substrates. Thus this piece of work shows promise for achieving a global planarization of complex device topographies through polishing with CeO2 slurry. Probably there is plenty of scope for further research in this area with the size of the CeO2 crystals, thermal treatment, substrates and chemistry of the carrier solvent to tailor and improve the CMP performance and selectivity.
Acknowledgements
The authors are thankful to the Director, NIIST for providing the necessary facilities for the work and CSIR-Central Glass & Ceramic Research Institute for continuing the same. Authors thank the Department of Science & Technology and CSIR, India for providing HR-TEM facility to NIIST. Authors also acknowledge Mr M. Kiran for the HR-TEM imaging and analysis. Authors gratefully acknowledge Mr Krishnan Kartha of NIIST for AFM analysis. This work was funded by the Indian Rare Earths Limited Technology Development Council (IRELTDC), DAE, India. Author TSS acknowledges CSIR for the CSIR Fellowship.
Notes and references
- A. Krishnan, T. S. Sreeremya, A. Peer Mohamed, U. S. Hareesh and S. Ghosh, RSC Adv., 2015, 5, 23965 RSC.
- M. Brigante and P. C. Schulz, Chem. Eng. J., 2012, 191, 563 CrossRef CAS PubMed.
- A. Nugroho, B. Veriansyah, S. K. Kim, B. G. Lee, J. Kim and Y.-W. Lee, Chem. Eng. J., 2012, 193, 146 CrossRef PubMed.
- T. S. Sreeremya, A. Krishnan, A. P. Mohamed, U. S. Hareesh and S. Ghosh, Chem. Eng. J., 2014, 255, 282 CrossRef CAS PubMed.
- T. S. Sreeremya, K. M. Thulasi, A. Krishnan and S. Ghosh, Ind. Eng. Chem. Res., 2012, 51, 318 CrossRef CAS.
- N. P. Mellott, S. L. Brantley, J. P. Hamilton and C. G. Pantano, Surf. Interface Anal., 2001, 31, 362 CrossRef CAS PubMed.
- L. Y. Wang, K. L. Zhang, Z. T. Song and S. L. Feng, Appl. Surf. Sci., 2007, 253, 4951 CrossRef CAS PubMed.
- D. Bouzid, N. Belkhie and T. Aliouane, Mater. Sci. Eng., 2012, 28, 12007 Search PubMed.
- T. Yu, Y. Park, M. C. Kang, J. Joo, J. K. Park, H. Y. Won, J. J. Kim and T. Hyeon, Eur. J. Inorg. Chem., 2008, 855 CrossRef CAS PubMed.
- J. Y. Kim, S. K. Kim, U. Paik, T. Katoh and J. G. Park, J. Korean Phys. Soc., 2002, 41, 413 CAS.
- Y. G. Wang, L. C. Zhang and A. Biddut, Wear, 2011, 270, 312 CrossRef CAS PubMed.
- L. M. Cook, J. Non-Cryst. Solids, 1990, 120, 152 CrossRef CAS.
- P. R. D. Veera, S. Peddeti and S. V. Babu, J. Electrochem. Soc., 2009, 156, H936 CrossRef PubMed.
- N. B. Kirk and J. V. Wood, J. Mater. Sci., 1995, 30, 2171 CrossRef CAS.
- T. Suratwala, M. Feit, W. Steele, L. Wong, N. Shen, R. Dylla-Spears, R. Desjardin, D. Mason, P. Geraghty, P. Miller and S. Baxamusa, J. Am. Ceram. Soc., 2014, 97, 81 CrossRef CAS PubMed.
- D. Ng, M. Kulkarni, J. Johnson, A. Zinovev, D. Yang and H. Liang, Wear, 2007, 263, 1477 CrossRef CAS PubMed.
- R. Jairath, M. Desai, M. Stell and R. Tolles, in Advanced Metallization for Devices and Circuits – Science, Technology and Manufacturability, ed. S. P. Murarka, A. Katz, K. N. Tu and K. Maex, 1994, vol. 337, p. 121 Search PubMed.
- Y. S. Xie and B. Bhushan, Wear, 1996, 200, 281 CrossRef CAS.
- M. Bielmann, U. Mahajan and R. K. Singh, Electrochem. Solid-State Lett., 1999, 2, 401 CrossRef CAS PubMed.
- A. Jindal, S. Hegde and S. V. Babu, J. Electrochem. Soc., 2003, 150, G314 CrossRef CAS PubMed.
- Q. Luo, D. R. Campbell and S. V. Babu, Langmuir, 1996, 12, 3563 CrossRef CAS.
- C. H. Zhou, L. Shan, J. R. Hight, S. Danyluk, S. H. Ng and A. J. Paszkowski, Tribol. Trans., 2002, 45, 232 CrossRef CAS PubMed.
- X. D. Zhou, W. Huebner and H. U. Anderson, Chem. Mater., 2003, 15, 378 CrossRef CAS.
- S. Ghosh, D. Divya, K. C. Remani and T. S. Sreeremya, J. Nanopart. Res., 2010, 12, 1905 CrossRef CAS.
- T. S. Sreeremya, A. Krishnan, K. C. Remani, K. R. Patil, D. F. Brougham and S. Ghosh, ACS Appl. Mater. Interfaces, 2015, 7, 8545 CAS.
- L. V. Zogheib, A. D. Bona, E. T. Kimpara and J. F. McCabe, South Braz. Dent. J., 2011, 22, 45 Search PubMed.
- S. C. Tjong and H. Chen, Mater. Sci. Eng., R, 2004, 45, 1 CrossRef PubMed.
- F. Zhang, S. P. Yang, H. M. Chen and X. B. Yu, Ceram. Int., 2004, 30, 997 CrossRef CAS PubMed.
- H. X. Mai, L. D. Sun, Y. W. Zhang, R. Si, W. Feng, H. P. Zhang, H. C. Liu and C. H. Yan, J. Phys. Chem. B, 2005, 109, 24380 CrossRef CAS PubMed.
- T. S. Sreeremya, A. Krishnan, S. J. Iyengar and S. Ghosh, Ceram. Int., 2012, 38, 3023 CrossRef CAS PubMed.
- P. L. Kuo, C. L. Liao and S. K. Ghosh, Colloid Polym. Sci., 2001, 279, 1212 CAS.
- D. Kim, Y. Hwang, S. I. Cheong, J. K. Lee, D. Hong, S. Moon, J. E. Lee and S. H. Kim, J. Nanopart. Res., 2008, 10, 1121 CrossRef CAS.
- G. B. Basim and B. M. Moudgil, J. Colloid Interface Sci., 2002, 256, 137 CrossRef CAS.
- D. Quere, Phys. A, 2002, 313, 32 CrossRef CAS.
- P. Bharali, P. Saikia and B. M. Reddy, Catal. Sci. Technol., 2012, 2, 931 CAS.
- X. Liu, K. Zhou, L. Wang, B. Wang and Y. Li, J. Am. Chem. Soc., 2009, 131, 3140 CrossRef CAS PubMed.
- Y. Lee, G. He, A. J. Akey, R. Si, M. Flytzani-Stephanopoulos and I. P. Herman, J. Am. Chem. Soc., 2011, 133, 12952 CrossRef CAS PubMed.
- A. Krishnan, T. S. Sreeremya, E. Murray and S. Ghosh, J. Colloid Interface Sci., 2013, 389, 16 CrossRef CAS PubMed.
- Z. Wu, M. Li, J. Howe, H. M. Meyer and S. H. Overbury, Langmuir, 2010, 26, 16595 CrossRef CAS PubMed.
- P. R. D. Veera and S. V. Babu, Imaging and Applied Optics Technical Digest, 2012, DOI:10.1364/oft.2012.om2d.1.
- R. Sabia and H. J. Stevens, GlassResearcher, 1999, 9, 16 Search PubMed.
- J. Bentley, S. R. Gilliss, C. B. Carter, J. F. Al-Sharab, F. Cosandey, I. M. Anderson and P. J. Kotula, J. Phys.: Conf. Ser., 2006, 26, 69 CrossRef.
- L. Martinez, E. Roman, J. L. de Segovia, S. Poupard, J. Creus and F. Pedraza, Appl. Surf. Sci., 2011, 257, 6202 CrossRef CAS PubMed.
- Y. Gao, W. Wang, S. Chang and W. Huang, ChemCatChem, 2013, 5, 3610 CrossRef CAS PubMed.
- S. Agarwal, L. Lefferts, B. L. Mojet, D. A. J. M. Ligthart, E. J. M. Hensen, D. R. G. Mitchell, W. J. Erasmus, B. G. Anderson, E. J. Olivier, J. H. Neethling and A. K. Datye, ChemSusChem, 2013, 6, 1898 CrossRef CAS PubMed.
- R. Dylla-Spears, L. Wong, P. E. Miller, M. D. Feit, W. Steele and T. Suratwala, Colloids Surf., A, 2014, 447, 32 CrossRef CAS PubMed.
- I. Dogsa, M. Tomsic, J. Orehek, E. Benigar, A. Jamnik and D. Stopar, Carbohydr. Polym., 2014, 111, 492 CrossRef CAS PubMed.
- Y.-J. Shin, C.-C. Su and Y.-H. Shen, Mater. Res. Bull., 2006, 41, 1964 CrossRef CAS PubMed.
- K. W. King and R. M. Smibert, Appl. Microbiol., 1963, 11, 315 CAS.
- U. Kastner, H. Hoffmann, R. Donges and J. Hilbig, Colloids Surf., A, 1997, 123, 307 CrossRef.
- C. J. Brinker, J. Non-Cryst. Solids, 1988, 100, 31 CrossRef CAS.
Footnote |
† Presently working at ACTC Div, Central Glass & Ceramic Research Institute, CSIR, 196 Raja S. C. Mullick Road, Kolkata-700 032, India |
|
This journal is © The Royal Society of Chemistry 2015 |
Click here to see how this site uses Cookies. View our privacy policy here.