 Open Access Article
Creative Commons Attribution 3.0 Unported Licence
Heteroleptic copper(I) sensitizers with one versus two hole-transporting units in functionalized 2,9-dimethyl-1,10-phenanthroline ancillary ligands†
Sebastian O.
Fürer
,
Biljana
Bozic-Weber
,
Markus
Neuburger
,
Edwin C.
Constable
and
Catherine E.
Housecroft
*
Department of Chemistry, University of Basel, Spitalstrasse 51, CH-4056 Basel, Switzerland. E-mail: catherine.housecroft@unibas.ch; Tel: +41 61 267 1008
First published on 14th August 2015
Abstract
A series of homoleptic [Cu(L)2][PF6] complexes in which L is a 2,9-dimethyl-1,10-phenanthroline fused at the 5,6-positions with a 2′-functionalized imidazole (ligands 1–4), or substituted at the 4,7-positions with electron-donating 4-(diphenylamino)phenyl groups (ligand 5) is described; the imidazole 2′-functionality in 1 is 4-bromophenyl, in 2 is 4-(diphenylamino)phenyl, in 3 is 4-(bis(4-n-butoxy)phenylamino)phenyl, and in 4 is 4-(carbazol-9-yl)phenyl. The copper complexes were characterized by mass spectrometry, NMR and absorption spectroscopies and cyclic voltammetry; the single crystal structure of ligand 4 has been determined. Compared to the solution absorption spectra of [Cu(1)2][PF6], [Cu(2)2][PF6], [Cu(3)2][PF6] and [Cu(4)2][PF6], that of [Cu(5)2][PF6] shows increased absorbance at wavelengths >375 nm. An on-surface strategy was used to assemble heteroleptic [Cu(6)(L)]+ dyes on TiO2 electrodes where 6 is ((6,6′-dimethyl-[2,2′-bipyridine]-4,4′-diyl)bis(4,1-phenylene))bis(phosphonic acid); solid-state absorption spectra confirmed enhanced light-harvesting between 375 and 600 nm for [Cu(6)(5)]+ with respect to [Cu(6)(1)]+, [Cu(6)(2)]+, [Cu(6)(3)]+ and [Cu(6)(4)]+. Comparison of the performances of dye-sensitized solar cells (DSCs) containing [Cu(6)(2)]+, [Cu(6)(3)]+ and [Cu(6)(4)]+ with those with [Cu(6)(1)]+ indicate only a marginal influence of the diphenylamine or carbazole hole-transporting domains in 5,6-substituted phenanthroline dyes. The introduction of the 4-(diphenylamino)phenyl hole-transporting units in the 4- and 7-positions of the phen unit in 5 proves to be beneficial, with DSCs containing [Cu(6)(5)]+ performing better than those with the other four dyes; duplicate DSCs were tested for each dye to validate the results. While the values of the maximum external quantum efficiencies (EQEmax) for [Cu(6)(1)]+ and [Cu(6)(4)]+ are greater than for [Cu(6)(5)]+, the extension of the EQE spectrum for [Cu(6)(5)]+ to longer wavelengths results in higher short-circuit current densities (JSC) compared to DSCs with [Cu(6)(1)]+, [Cu(6)(2)]+, [Cu(6)(3)]+ and [Cu(6)(4)]+.
Introduction
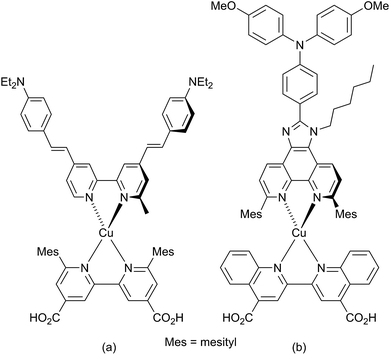
The development of dye-sensitized solar cells (DSCs) has progressed from the prototype ruthenium dyes of Grätzel and O'Regan,1,2 to the use of organic3 and porphyrin-containing4 dyes with solar-to-electrical power conversion efficiencies (PCEs) reaching ≈12%.5 Recently, perovskite DSCs have excited considerable attention, with PCEs of 18–20%.6–8 Our contributions to the advancement of DSCs focus on sustainable components,9 in particular with copper-containing dyes10 replacing those containing precious metals. The potential of copper(I) dyes was first recognized by Sauvage and coworkers,11 and in 2014, PCEs exceeding 3% (relative to ≈7.5% for reference dye N719) were achieved.12,13 Homoleptic copper(I) complexes have also been used as redox mediators combined with ruthenium(II) sensitizers in DSCs.14The simplest copper(I) sensitizers are homoleptic complexes of type [Cu(Lanchor)2]+ in which Lanchor is typically a diimine ligand bearing a carboxylic or phosphonic acid substituent to anchor the dye to the semiconductor surface.15 Dye performance is most easily improved and tuned by employing heteroleptic [Cu(Lanchor)(Lancillary)]+ dyes, although these are often difficult to isolate because of the lability of bis(diimine)copper(I) complexes.16 Two approaches to access heteroleptic dyes are now successfully used. The first is the HETPHEN strategy17 introduced by Odobel and coworkers13,18 which relies on bulky ligands to hinder ligand exchange. Using this approach, a remarkable efficiency of 4.66% (relative to 7.36% for N719) has been recorded for the dye shown in Scheme 1a in the presence of the co-adsorbant chenodeoxycholic acid.13 A second route to heteroleptic dyes is our ‘surface-as-ligand, surface-as-complex’ approach19–22 which involves a stepwise assembly of heteroleptic metal complex dyes on electrode surfaces and has been used for both copper(I)22 and zinc(II)23 sensitizers. The strategy provides a straightforward means for rapid screening of different combinations of anchoring and ancillary ligands. To assemble a [Cu(Lanchor)(Lancillary)]+ dye, an electrode is initially soaked in a solution of Lanchor, and then the functionalized electrode is immersed in a dye-bath containing either [Cu(Lancillary)2]+ or a mixture of [Cu(MeCN)4]+ and Lancillary.22,24
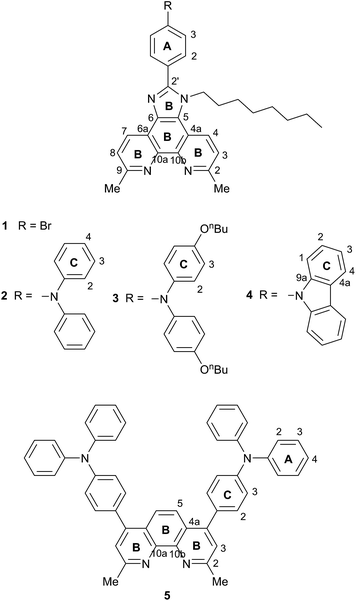
The incorporation of imidazo[4′,5′:5,6]-1,10-phenanthroline ligands bearing electron-donating groups in the 2′-position has been shown to be advantageous in ruthenium-based sensitizers,25 and these ligands are also attractive for copper(I)-based DSCs.18,26 The imidazo[4′,5′:5,6]-1,10-phenanthroline unit is readily extended with a 4-(diphenylamino)phenyl18 or other hole-transporting unit, and Scheme 1b shows a copper(I) sensitizer which is noteworthy for its broad absorption spectrum extending beyond 700 nm; however, DSCs containing this dye gave efficiencies of <0.3% (with respect to 6.55% for N719).18 Ligand 1![[thin space (1/6-em)]](https://www.rsc.org/images/entities/char_2009.gif) 26 (Scheme 2) is a convenient precursor to 2′-functionalized 2,9-dimethyl-imidazo[4′,5′:5,6]-1,10-phenanthrolines for use as ancillary ligands in [Cu(Lanchor)(Lancillary)]+ dyes. The 2,9-substituents in the phen metal-binding domain stabilize copper(I) with respect to oxidation by sterically hindering the transformation of tetrahedral copper(I) to square planar copper(II). An additional feature of 1 is the long N-alkyl substituent which helps to prevent intermolecular aggregation of dye molecules on the semiconductor surface and also militates against charge recombination processes.27
26 (Scheme 2) is a convenient precursor to 2′-functionalized 2,9-dimethyl-imidazo[4′,5′:5,6]-1,10-phenanthrolines for use as ancillary ligands in [Cu(Lanchor)(Lancillary)]+ dyes. The 2,9-substituents in the phen metal-binding domain stabilize copper(I) with respect to oxidation by sterically hindering the transformation of tetrahedral copper(I) to square planar copper(II). An additional feature of 1 is the long N-alkyl substituent which helps to prevent intermolecular aggregation of dye molecules on the semiconductor surface and also militates against charge recombination processes.27
We now report the development of heteroleptic copper(I) dyes for DSCs with ancillary ligands derived through post-functionalization of the peripheral bromo-substituent in 1. We also demonstrate the effects of introducing hole-transporting domains into the 4- and 7-positions of 2,9-dimethyl-1,10-phenanthroline.
Experimental
General
1H and 13C NMR spectra were recorded at 295 K on a Bruker Avance III-500 NMR spectrometer with chemical shifts referenced to residual solvent peaks with respect to δ(TMS) = 0 ppm. Solution and solid-state absorption spectra were recorded on Perkin-Elmer Lambda 25 and Cary 5000 spectrophotometers, respectively, and FT-IR spectra on a Perkin-Elmer Spectrum Two spectrometer equipped with a UATR. Electrospray (ESI) mass spectra (solution samples in MeOH with a drop of CH2Cl2 added) and high resolution ESI-MS were measured on Bruker Esquire 3000plus and Bruker maXis 4G instruments, respectively.Electrochemical measurements were performed on a CHI 900B instrument by cyclic voltammetry (CV) using a glassy carbon working electrode, platinum wire auxiliary electrode, and a silver wire pseudo-reference electrode. HPLC grade, argon degassed CH2Cl2 solutions (≈10−4 mol dm−3) of the copper complexes were used with 0.1 M [nBu4N][PF6] as supporting electrolyte; the scan rate was 0.1 V s−1 and ferrocene was used as an internal standard, added at the end of each experiment.
Ligands and complexes
Compound 1,26 2,26 2,9-dimethyl-1,10-phenanthroline-5,6-dione,28 4-(9H-carbazol-9-yl)benzaldehyde,29 4,7-dichloro-2,9-dimethyl-1,10-phenanthroline,30 [Cu(MeCN)4][PF6]31 and [Cu(2)2][PF6]26 were synthesized as previously reported. 4,4′-Di-n-butoxydiphenylamine was prepared by the method reported for the analogous hexoxy derivative,32 and NMR spectra corresponded to those published.33 Bis(dibenzylideneacetone)palladium(0), [Pd(dba)2] was purchased from Strem Chemicals, and 4-(N,N-diphenylamino)phenylboronic acid from Fluorochem.Compound 3 a flask (50 ml) was charged with 1 (300 mg, 0.582 mmol), 4,4′-di-n-butoxydiphenylamine (279 mg, 0.873 mmol), NaOtBu (140 mg, 1.45 mmol) and a catalytic amount of [Pd(dba)2] (18.4 mg, 0.0291 mmol) and was evacuated for 15 min. Toluene (20 ml) and PtBu3 (0.03 ml of a 0.1 M sol. in toluene, 23.9 mg, 0.0291 mmol) were added and the reddish brown mixture was heated to 95 °C for 8 days. The mixture was allowed to cool to room temperature, filtered and the solvent was removed. The remaining brown solid was purified by column chromatography on alumina eluting with CH2Cl2 to yield the product as a yellow solid (223 mg, 298 mmol, 51.2%). 1H NMR (500 MHz, CDCl3) δ/ppm 9.24 (br, 1H, HB4/B7), 8.48 (d, J = 8.6 Hz, 1H, HB4/B7), 7.66 (d, J = 8.2 Hz, 1H, HB3/B8), 7.62 (d, J = 8.4 Hz, 1H, HB3/B8), 7.54 (m, 2H, HA2), 7.13 (m, 4H, HC2), 7.03 (m, 2H, HA3), 6.88 (m, 4H, HC3), 4.64 (m, 2H, HNCH2), 3.96 (t, J = 6.5 Hz, 4H, HOCH2), 3.07 (s, 3H, HMe-phen), 3.01 (s, 3H, HMe-phen), 1.95 (m, 2H, HNCH2CH2), 1.78 (m, 4H, HOCH2CH2), 1.51 (m, 4H, HOCH2CH2CH2), 1.30–1.16 (m, 10H, HCH2-octyl), 0.99 (t, J = 7.4 Hz, 6H, HMe-butyl), 0.85 (t, J = 6.9 Hz, 3H, HMe-octyl). 13C NMR (126 MHz, CDCl3) δ/ppm 157.5 (CB2+B9), 156.1 (CC4), 139.6 (CC1), 130.6 (CA2), 128.7 (CB4/B7), 127.6 (CC2), 124.5 (CB3/B8), 123.6 (CB3/B8), 118.6 (CA3), 117.5 (CB4a/B6a), 115.6 (CC3), 67.9 (COCH2), 46.9 (CNCH2), 31.8 (CCH2-octyl), 31.5 (COCH2CH2), 30.2, (CNCH2CH2), 29.2 (CCH2-octyl), 29.0 (CCH2-octyl), 26.4 (CCH2-octyl), 25.3 (Cphen-Me), 25.1 (Cphen-Me), 22.7 (CCH2-octyl), 19.4 (COCH2CH2CH2), 14.2 (CMe-octyl), 14.0 (CMe-butyl), (other CQ not resolved). UV-Vis (CH2Cl2, 1.00 × 10⁻⁵ mol dm−3) λ/nm (ε/dm3 mol−1 cm−1) 267 (35![[thin space (1/6-em)]](https://www.rsc.org/images/entities/char_2009.gif) 700), 296 (40
700), 296 (40![[thin space (1/6-em)]](https://www.rsc.org/images/entities/char_2009.gif) 700), 341 sh (23
700), 341 sh (23![[thin space (1/6-em)]](https://www.rsc.org/images/entities/char_2009.gif) 800). HR ESI-MS m/z: 748.4582 [M + H]+ (calc. 748.4585). Found C 78.52, H 7.51, N 8.96; C49H57N5O2 requires C 78.68, H 7.68, N 9.36%.
800). HR ESI-MS m/z: 748.4582 [M + H]+ (calc. 748.4585). Found C 78.52, H 7.51, N 8.96; C49H57N5O2 requires C 78.68, H 7.68, N 9.36%.
Compound 4a 4-(9H-carbazol-9-yl)benzaldehyde (535 mg, 1.97 mmol), 2,9-dimethyl-1,10-phenanthroline-5,6-dione (481 mg, 2.02 mmol) and an excess of NH4OAc (5.04 g, 65.4 mmol) were added to EtOH (100 ml). The yellow mixture was heated at reflux overnight after which time the solvent was removed. The remaining orange solid was washed with water and Et2O. The product was purified using column chromatography (alumina, CH2Cl2 with 3% MeOH) and was isolated as a yellow solid (282 mg, 0.575 mmol, 29.2%). 1H NMR (500 MHz, DMSO-d6) δ/ppm 13.8 (br, NH), 8.84 (d, J = 8.2 Hz, 2H, HB4), 8.56 (m, 2H, HA2), 8.29 (m, 2H, HC4), 7.91 (m, 2H, HA3), 7.72 (m, 2H, HB3), 7.55 (m, 2H, HC1), 7.49 (m, 2H, HC2), 7.34 (m, 2H, HC3), 2.82 (s, 6H). 13C NMR (126 MHz, DMSO-d6) 156.0 (CB2), 149.3 (Cimid-2), 143.1 (CB10a), 139.8 (CC9a), 137.6 (CA4), 129.9 (CB4), 129.0 (CA1), 127.6 (CA2), 126.9 (CA3), 126.5 (CB5), 126.3 (CC2), 123.2 (CB3), 120.5 (CC4), 120.2 (CC3), 109.6 (CC1), 24.7 (CMe), (CB4a not resolved). ESI MS m/z: 490.4 [M + H]+ (calc. 490.2).
Compound 4 NaH (60% oil dispersion, 122 mg, 3.05 mmol) was suspended and stirred vigorously for 1.5 h in DMF (5 ml) under N2. Compound 4a (200 mg, 0.409 mmol) was added and the suspension was stirred for 10 min. Then 1-bromo-n-octane (0.711 ml, 789 mg, 4.09 mmol) was added and the mixture was heated at 70 °C for 3 days. The black mixture was allowed to cool to room temperature and was diluted with water, giving a suspension which was extracted with CH2Cl2 (25 ml). The organic layer was washed with water (5 × 40 ml), dried over Na2SO4 and the solvent was removed. The remaining DMF was removed by azeotrope distillation with toluene five times. The brown residue was washed with petroleum ether and dried in vacuo. This gave a brown foam which was purified by column chromatography (three columns: alumina, CH2Cl2 changing to CH2Cl2/2% MeOH; alumina, toluene/ethyl acetate 4![[thin space (1/6-em)]](https://www.rsc.org/images/entities/char_2009.gif) :
:![[thin space (1/6-em)]](https://www.rsc.org/images/entities/char_2009.gif) 1 changing to 1
1 changing to 1![[thin space (1/6-em)]](https://www.rsc.org/images/entities/char_2009.gif) :
:![[thin space (1/6-em)]](https://www.rsc.org/images/entities/char_2009.gif) 1; alumina, CH2Cl2/0.25% MeOH). Compound 4 was isolated as a beige solid (45 mg, 0.075 mmol, 18.3%). 1H NMR (500 MHz, DMSO-d6) δ/ppm: 8.85 (d, J = 8.3 Hz, 1H, HB7), 8.78 (d, J = 8.6 Hz, 1H, HB4), 8.30 (d, J = 7.9 Hz, 2H, HC4), 8.10 (m, 2H, HA2), 7.91 (m, 2H, HA3), 7.77 (d, J = 8.3 Hz, 1H, HB3), 7.73 (d, J = 8.0 Hz, 1H, HB8), 7.56 (d, J = 8.2 Hz, 2H, HC1), 7.50 (t, J = 7.6 Hz, 2H, HC2), 7.35 (t, J = 7.3 Hz, 2H HC3), 4.82 (m, 2H, HNCH2), 2.84 (s, 3H, HMe-phen), 2.83 (s, 3H, HMe-phen), 1.85 (m, 2H, HNCH2CH2), 1.15–1.05 (m, 10H, HCH2), 0.68 (m, 3H, HMe-octyl). 13C NMR (126 MHz, DMSO-d6) δ/ppm: 156.2 (CB2/B9), 155.7 (CB2/B9), 152.4 (Cimid-2), 139.7 (CC9a), 137.8 (CA4), 131.6 (CA2), 130.0 (CB7), 129.3 (CB4), 129.2 (CA1), 126.6 (CA3), 126.2 (CC2), 124.4 (CB5), 123.5 (CB8), 123.0 (CB3), 122.8 (CC4a), 121.4 (CB6a), 120.5 (CC4), 120.3 (CC3), 117.4 (CB4a), 109.5 (CC1), 45.7 (CNCH2), 30.9 (CCH2), 28.9 (CNCH2CH2), 28.0 (CCH2), 25.0 (CCH2), 24.6 (overlapping CMe-phen), 21.7 (CCH2), 18.4 (CCH2), 13.6 (CMe-octyl), (CB6, CB10a, CB10b not resolved). UV-Vis (CH2Cl2, 1.00 × 10⁻⁵ mol dm−3) λ/nm (ε/dm3 mol−1 cm−1) 294 (55
1; alumina, CH2Cl2/0.25% MeOH). Compound 4 was isolated as a beige solid (45 mg, 0.075 mmol, 18.3%). 1H NMR (500 MHz, DMSO-d6) δ/ppm: 8.85 (d, J = 8.3 Hz, 1H, HB7), 8.78 (d, J = 8.6 Hz, 1H, HB4), 8.30 (d, J = 7.9 Hz, 2H, HC4), 8.10 (m, 2H, HA2), 7.91 (m, 2H, HA3), 7.77 (d, J = 8.3 Hz, 1H, HB3), 7.73 (d, J = 8.0 Hz, 1H, HB8), 7.56 (d, J = 8.2 Hz, 2H, HC1), 7.50 (t, J = 7.6 Hz, 2H, HC2), 7.35 (t, J = 7.3 Hz, 2H HC3), 4.82 (m, 2H, HNCH2), 2.84 (s, 3H, HMe-phen), 2.83 (s, 3H, HMe-phen), 1.85 (m, 2H, HNCH2CH2), 1.15–1.05 (m, 10H, HCH2), 0.68 (m, 3H, HMe-octyl). 13C NMR (126 MHz, DMSO-d6) δ/ppm: 156.2 (CB2/B9), 155.7 (CB2/B9), 152.4 (Cimid-2), 139.7 (CC9a), 137.8 (CA4), 131.6 (CA2), 130.0 (CB7), 129.3 (CB4), 129.2 (CA1), 126.6 (CA3), 126.2 (CC2), 124.4 (CB5), 123.5 (CB8), 123.0 (CB3), 122.8 (CC4a), 121.4 (CB6a), 120.5 (CC4), 120.3 (CC3), 117.4 (CB4a), 109.5 (CC1), 45.7 (CNCH2), 30.9 (CCH2), 28.9 (CNCH2CH2), 28.0 (CCH2), 25.0 (CCH2), 24.6 (overlapping CMe-phen), 21.7 (CCH2), 18.4 (CCH2), 13.6 (CMe-octyl), (CB6, CB10a, CB10b not resolved). UV-Vis (CH2Cl2, 1.00 × 10⁻⁵ mol dm−3) λ/nm (ε/dm3 mol−1 cm−1) 294 (55![[thin space (1/6-em)]](https://www.rsc.org/images/entities/char_2009.gif) 000), 310 sh (35
000), 310 sh (35![[thin space (1/6-em)]](https://www.rsc.org/images/entities/char_2009.gif) 500), 325 sh (29
500), 325 sh (29![[thin space (1/6-em)]](https://www.rsc.org/images/entities/char_2009.gif) 900), 340 (23
900), 340 (23![[thin space (1/6-em)]](https://www.rsc.org/images/entities/char_2009.gif) 000), 370 sh (4200). ESI MS m/z: 602.6 [M + H]+ (calc. 602.3). Found: C 78.95, H 6.56, N 10.80; C41H39N5·H2O requires C 79.45, H 6.67, N 11.30%.
000), 370 sh (4200). ESI MS m/z: 602.6 [M + H]+ (calc. 602.3). Found: C 78.95, H 6.56, N 10.80; C41H39N5·H2O requires C 79.45, H 6.67, N 11.30%.
Compound 5 K3PO4 (343 mg, 1.62 mmol) was dissolved in H2O (2 ml) under N2, and N2 was bubbled through the solution for 10 min. In a separate flask, N2 was bubbled through 1,4-dioxane (5 ml) for 10 min and then 4,7-dichloro-2,9-dimethyl-1,10-phenanthroline (100 mg, 0.361 mmol), 4-(diphenylamino)phenylboronic acid (230 mg, 0.794 mmol) and catalytic amounts of [Pd(dba)3] (24.7 mg, 0.0238 mmol, 6.6 mol%) and tricyclohexylphosphine (15.2 mg, 0.0542 mmol) were added. The aqueous solution of K3PO4 was then added to the reaction mixture and this was heated at reflux at 95 °C for 15 h. The orange mixture was allowed to cool down to room temperature and water (10 ml) was added. The mixture was extracted with CH2Cl2 (5 × 15 ml) and the organic layer was dried over Na2SO4 and the solvent then removed. The product was recrystallized from CH2Cl2/MeOH (1![[thin space (1/6-em)]](https://www.rsc.org/images/entities/char_2009.gif) :
:![[thin space (1/6-em)]](https://www.rsc.org/images/entities/char_2009.gif) 1) and 5 was isolated as a yellow solid (97.0 mg, 0.140 mmol, 38.7%). 1H NMR (500 MHz, CDCl3) δ/ppm 8.00 (s, 2H, HB5), 7.55 (s, 2H, HB3), 7.41 (m, 4H, HC2), 7.32 (m, 8H, HA3), 7.19 (m, 12H, HA2+C3), 7.10 (m, 4H, HA4), 3.14 (s, 6H, HMe). 13C (126 MHz, CDCl3) δ/ppm 158.8 (CB2), 150.2 (CB4), 148.9 (CC4), 147.3 (CA1), 142.9 (CB10a), 130.8 (CC2), 129.7 (CA3), 125.2 (CA2), 125.1 (CB4a), 124.8 (CB3), 123.9 (CA4), 123.5 (CB5), 122.5 (CC3), 24.7 (CMe), (CC1 not resolved). UV-Vis (CH2Cl2, 1.00 × 10⁻⁵ mol dm−3) λ/nm (ε/dm3 mol−1 cm−1) 297 (49
1) and 5 was isolated as a yellow solid (97.0 mg, 0.140 mmol, 38.7%). 1H NMR (500 MHz, CDCl3) δ/ppm 8.00 (s, 2H, HB5), 7.55 (s, 2H, HB3), 7.41 (m, 4H, HC2), 7.32 (m, 8H, HA3), 7.19 (m, 12H, HA2+C3), 7.10 (m, 4H, HA4), 3.14 (s, 6H, HMe). 13C (126 MHz, CDCl3) δ/ppm 158.8 (CB2), 150.2 (CB4), 148.9 (CC4), 147.3 (CA1), 142.9 (CB10a), 130.8 (CC2), 129.7 (CA3), 125.2 (CA2), 125.1 (CB4a), 124.8 (CB3), 123.9 (CA4), 123.5 (CB5), 122.5 (CC3), 24.7 (CMe), (CC1 not resolved). UV-Vis (CH2Cl2, 1.00 × 10⁻⁵ mol dm−3) λ/nm (ε/dm3 mol−1 cm−1) 297 (49![[thin space (1/6-em)]](https://www.rsc.org/images/entities/char_2009.gif) 000), 360 sh (18
000), 360 sh (18![[thin space (1/6-em)]](https://www.rsc.org/images/entities/char_2009.gif) 100), 500 sh (4950). HR ESI-MS m/z: 695.3174 [M + H]+ (calc. 695.3169). Satisfactory elemental analysis was not obtained.
100), 500 sh (4950). HR ESI-MS m/z: 695.3174 [M + H]+ (calc. 695.3169). Satisfactory elemental analysis was not obtained.
![[thin space (1/6-em)]](https://www.rsc.org/images/entities/char_2009.gif) 200), 304 (95
200), 304 (95![[thin space (1/6-em)]](https://www.rsc.org/images/entities/char_2009.gif) 300), 474 (13
300), 474 (13![[thin space (1/6-em)]](https://www.rsc.org/images/entities/char_2009.gif) 400). ESI MS m/z: 1093.7 [M − PF6]+ (calc. 1093.3). Found C 57.02, H 5.38, N 9.01; C58H62Br2CuF6N8P requires C 56.20, H 5.04, N 9.04%.
400). ESI MS m/z: 1093.7 [M − PF6]+ (calc. 1093.3). Found C 57.02, H 5.38, N 9.01; C58H62Br2CuF6N8P requires C 56.20, H 5.04, N 9.04%.
![[thin space (1/6-em)]](https://www.rsc.org/images/entities/char_2009.gif) 200), 292 (88
200), 292 (88![[thin space (1/6-em)]](https://www.rsc.org/images/entities/char_2009.gif) 800), 342 sh (58
800), 342 sh (58![[thin space (1/6-em)]](https://www.rsc.org/images/entities/char_2009.gif) 700), 469 (16
700), 469 (16![[thin space (1/6-em)]](https://www.rsc.org/images/entities/char_2009.gif) 100). HR ESI-MS m/z: 1557.8334 [M − PF6]+ (calc. 1557.8315). Satisfactory elemental analysis could not be obtained.
100). HR ESI-MS m/z: 1557.8334 [M − PF6]+ (calc. 1557.8315). Satisfactory elemental analysis could not be obtained.
![[thin space (1/6-em)]](https://www.rsc.org/images/entities/char_2009.gif) 400), 292 (104
400), 292 (104![[thin space (1/6-em)]](https://www.rsc.org/images/entities/char_2009.gif) 300), 338 (52
300), 338 (52![[thin space (1/6-em)]](https://www.rsc.org/images/entities/char_2009.gif) 900), 475 (14
900), 475 (14![[thin space (1/6-em)]](https://www.rsc.org/images/entities/char_2009.gif) 500). ESI MS m/z: 1266.0 [M − PF6]+ (calc. 1265.6). HR ESI-MS: m/z 1265.5687 [M − PF6]+ (calc. 1265.5701). Found C 69.00, H 5.78, N 9.74; C82H78CuF6N10P·0.5H2O requires C 69.30, H 5.60, N 9.86%.
500). ESI MS m/z: 1266.0 [M − PF6]+ (calc. 1265.6). HR ESI-MS: m/z 1265.5687 [M − PF6]+ (calc. 1265.5701). Found C 69.00, H 5.78, N 9.74; C82H78CuF6N10P·0.5H2O requires C 69.30, H 5.60, N 9.86%.
![[thin space (1/6-em)]](https://www.rsc.org/images/entities/char_2009.gif) 200), 384 (54
200), 384 (54![[thin space (1/6-em)]](https://www.rsc.org/images/entities/char_2009.gif) 000), 486 (23
000), 486 (23![[thin space (1/6-em)]](https://www.rsc.org/images/entities/char_2009.gif) 600). ESI MS m/z: 1452.1 [M − PF6]+ (calc. 1452.6). Found C 72.47, H 4.79, N 7.01; C100H76CuF6N8P·3H2O requires C 72.69, H 5.00, N 6.78%.
600). ESI MS m/z: 1452.1 [M − PF6]+ (calc. 1452.6). Found C 72.47, H 4.79, N 7.01; C100H76CuF6N8P·3H2O requires C 72.69, H 5.00, N 6.78%.
Crystallography
Single crystal data were collected on a Bruker APEX-II diffractometer with data reduction, solution and refinement using the programs APEX34 and CRYSTALS.35 Structure analysis used Mercury v. 3.5.1.36,37Compound 4 C41H39N5, M = 601.79, colourless needle, triclinic, space group P![[1 with combining macron]](https://www.rsc.org/images/entities/char_0031_0304.gif) , a = 11.7635(14), b = 11.8126(14), c = 12.2155(14) Å, α = 72.343(4), β = 86.285(4), γ = 83.168(4)°, U = 1605.25(18) Å3, Z = 2, Dc = 1.245 Mg m−3, µ(Cu-Kα) = 0.570 mm−1, T = 123 K. Total 18
, a = 11.7635(14), b = 11.8126(14), c = 12.2155(14) Å, α = 72.343(4), β = 86.285(4), γ = 83.168(4)°, U = 1605.25(18) Å3, Z = 2, Dc = 1.245 Mg m−3, µ(Cu-Kα) = 0.570 mm−1, T = 123 K. Total 18![[thin space (1/6-em)]](https://www.rsc.org/images/entities/char_2009.gif) 881 reflections, 5769 unique, Rint = 0.027. Refinement of 5522 reflections (415 parameters) with I > 2σ(I) converged at final R1 = 0.0375 (R1 all data = 0.0391), wR2 = 0.0416 (wR2 all data = 0.0477), gof = 1.1112. CCDC 1405837.†
881 reflections, 5769 unique, Rint = 0.027. Refinement of 5522 reflections (415 parameters) with I > 2σ(I) converged at final R1 = 0.0375 (R1 all data = 0.0391), wR2 = 0.0416 (wR2 all data = 0.0477), gof = 1.1112. CCDC 1405837.†
DSC fabrication and measurements
Solaronix Test Cell Titania Electrodes were used for the photoanodes. They were washed with milliQ H2O and heated at 450° C for 30 min, then cooled to ≈80 °C and soaked in a 1.0 mM DMSO solution of 6 for 24 h at room temperature. After removal of the electrodes from the solution, they were washed with DMSO and EtOH and dried in a stream of N2. Each functionalized electrode was then soaked for 3 days in a 0.1 mM MeCN solution of [Cu(Lancillary)2][PF6] (Lancillary = 1–5) at room temperature. The electrodes were removed from the dye-bath, washed with MeCN and dried in a stream of N2.N719 reference electrodes were made by dipping Solaronix Test Cell Titania Electrodes in a 0.3 mM EtOH solution of N719 (Solaronix) for 3 days. The electrodes were removed from the dye-bath, and were washed with EtOH and dried in a stream of N2.
For the counter electrodes, Solaronix Test Cell Platinum Electrodes were used, and volatile organic impurities were removed by heating on a heating plate at 450 °C for 30 min.
The dye-covered TiO2 electrode and Pt counter-electrode were combined using thermoplast hot-melt sealing foil (Solaronix Test Cell Gaskets, 60 µm) by heating while pressing them together. The electrolyte (LiI (0.1 M), I2 (0.05 M), 1-methylbenzimidazole (0.5 M), 1-butyl-3-methylimidazolinium iodide (0.6 M) in 3-methoxypropionitrile) was introduced into the DSC by vacuum backfilling. The hole in the counter electrode was sealed with hot-melt sealing foil (Solaronix Test Cell Sealings) and a cover glass (Solaronix Test Cell Caps).
For each dye, duplicate DSCs were made and the cells were completely masked.38,39 Measurements were made by irradiating the DSC from behind using a SolarSim 150 (Solaronix) light source previously calibrated with a silicon reference cell to 100 mW cm−2 (1 sun).
External quantum efficiency (EQE) measurements were made using a Spe-Quest quantum efficiency instrument from Rera Systems (Netherlands) with a 100 W halogen lamp (QTH) and a lambda 300 grating monochromator (Lot Oriel). The monochromatic light was modulated to 3 Hz using a chopper wheel (ThorLabs). The cell response was amplified with a large dynamic range IV converter (CVI Melles Griot) and measured with a SR830 DSP Lock-In amplifier (Stanford Research).
Results and discussion
Synthesis and characterization of ancillary ligands 1–5
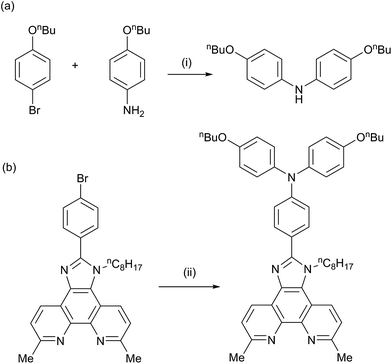
We have previously reported the preparation and characterization of the bromo-derivative 1 and subsequent Hartwig–Buchwald amination with diphenylamine to give 2 (Scheme 2).26 The same strategy was used for the synthesis of 3. 4,4′-Di-n-butoxydiphenylamine was prepared by a copper(I) iodide/L-proline catalysed32 Ullmann coupling (Scheme 3a) and was then used in the Hartwig–Buchwald amination shown in Scheme 3b. Compound 3 was isolated in 51.2% yield. Attempts to prepare 4 by reaction of 1 with 9H-carbazole using Hartwig–Buchwald conditions led to very low yields of 4; changing the catalyst from [Pd(dba)2]/PtBu3 to [Pd(OAc)2]/PtBu3 or [Pd(PPh3)4] gave mixtures from which pure 4 could not be separated. We therefore opted for the alternative route to 4 shown in Scheme 4. Compound 4a was formed by treatment of 4-(9H-carbazol-9-yl)benzaldehyde with 2,9-dimethyl-1,10-phenanthroline-5,6-dione and NH4OAc; subsequent alkylation of the imidazole gave 4 in 18.3% yield. The electrospray mass spectra of 3 and 4 exhibited ions arising from [M + H]+, and the compounds were characterized by 13C and 1H NMR spectroscopies using COSY, NOESY, HMQC and HMBC techniques. The alkyl chain desymmetrizes the phen unit, giving rise to pairs of signals in both the 1H and 13C NMR spectra for H/CB3/B8, H/CB4/B7, and H/CMe-phen. For example, the methyl groups in the 1H NMR spectrum appear at δ 3.01 and 3.07 ppm in 3, and δ 2.83 and 2.84 ppm in 4. In contrast to 4, the 1H NMR spectrum of precursor 4a (see Experimental section) reflects the C2 symmetry that results from the tautomerism of the imidazole ring.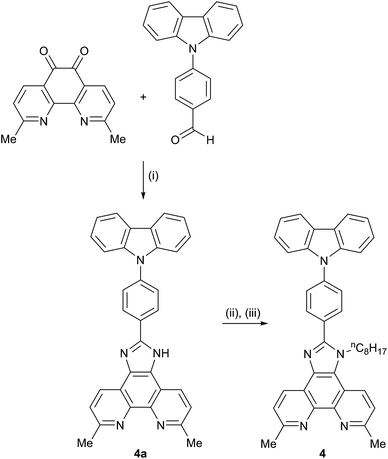 | ||
| Scheme 4 Synthetic route to compound 4; conditions (i) excess NH4OAc, EtOH; (ii) NaH, DMF under N2; (iii) nC8H17Br, DMF, 75 °C, 15 h. | ||
The synthetic approach to compound 5 (Scheme 2) was based on that described in the patent literature for 4,7-bis(4-(diphenylamino)phenyl)-1,10-phenanthroline.40 Suzuki coupling of 4,7-dichloro-2,9-dimethyl-1,10-phenanthroline with two equivalents of 4-(N,N-diphenylamino)phenylboronic acid (Scheme 5) gave 5 in moderate yield. The high-resolution electrospray mass spectrum confirmed the presence of the [M + H]+ ion at m/z = 695.3174. Fig. 1 shows the 1H NMR spectrum of 5 which is consistent with a C2-symmetric molecule. Protons HB3 and HB5 were distinguished using the NOESY cross peak between HMe and HB3; HC2/HB3 and HC2/HB5 NOESY cross peaks were used to discriminate between HC2 and HC3. Assignment of the 13C NMR spectrum was made using HMBC and HMQC methods.
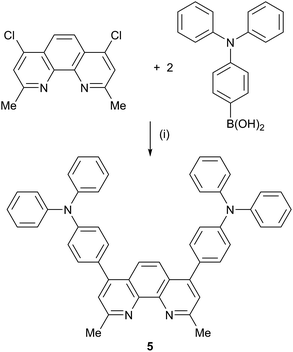 | ||
Scheme 5 Synthetic route to compound 5; conditions (i) K3PO4, catalytic [Pd(dba)2]/P(C6H11)3, 1,4-dioxane/H2O (ratio 5![[thin space (1/6-em)]](https://www.rsc.org/images/entities/char_2009.gif) : :![[thin space (1/6-em)]](https://www.rsc.org/images/entities/char_2009.gif) 2), reflux, 95 °C, 15 h. 2), reflux, 95 °C, 15 h. | ||
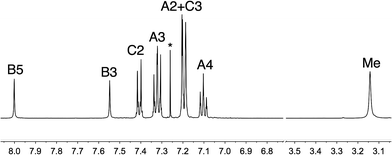 | ||
| Fig. 1 500 MHz 1H NMR spectrum of 5 (CDCl3, 295 K). See Scheme 2 for atom labelling; * is residual CHCl3. Chemical shifts are in δ/ppm. | ||
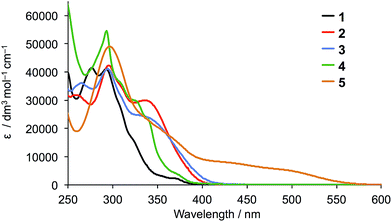
The solution absorption spectra of the five ligands are compared in Fig. 2. Introduction of the diphenylamino or carbazole units on going from 1 to 2, 3 or 4 enhances the photoresponse of the ligands in the region between 325 and 400 nm, but the most significant improvement in absorption towards the red-region is observed in compound 5 which absorbs down to ≈550 nm.
Single crystal structure of 4
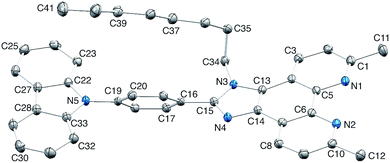
The single crystal structure of 4 was determined from crystals grown from a DMSO-d6 solution in an NMR tube. The compound crystallizes in the triclinic space group P![[1 with combining macron]](https://www.rsc.org/images/entities/char_0031_0304.gif) and the structure is shown in Fig. 3. Bond lengths (caption to Fig. 3) and bond angles are unremarkable, and the phenyl ring containing C19 is twisted through 53.4° with respect to the plane through the imidazole ring consistent with minimizing inter-ring H…H contacts. The n-octyl chain is folded over the N-phenylcarbazole unit (Fig. 3), with an orientation which mimics that in 1
and the structure is shown in Fig. 3. Bond lengths (caption to Fig. 3) and bond angles are unremarkable, and the phenyl ring containing C19 is twisted through 53.4° with respect to the plane through the imidazole ring consistent with minimizing inter-ring H…H contacts. The n-octyl chain is folded over the N-phenylcarbazole unit (Fig. 3), with an orientation which mimics that in 1![[thin space (1/6-em)]](https://www.rsc.org/images/entities/char_2009.gif) 26 and this leads to close CHalkyl…π contacts, both to the phenyl spacer (CH…centroid = 3.47 Å) and to the heterocyclic ring of the carbazole (CH…centroid = 3.32 Å). Two packing motifs are of importance. Firstly, carbazole and phen units in adjacent molecules engage in face-to-face π-stacking interactions, leading to the assembly of chains parallel to the c-axis (Fig. 4a). As Fig. 3a illustrates, the carbazole and phen units are slipped with respect to one another giving an optimum configuration for π-interactions; the carbazolecentroid…phenplane distance is 3.40 Å. Adjacent chains interact through π-stacking and this is best described in terms of the quadruple-decker stack shown in Fig. 4b. The central interaction is between a centrosymmetric pair of 1H-phenanthro[9,10-d]imidazole domains (interplane separation = 3.33 Å). Extension beyond the quadruple-decker unit is prevented by the CH…π contacts from the terminal methyl group of the n-octyl chain (Fig. 4b).
26 and this leads to close CHalkyl…π contacts, both to the phenyl spacer (CH…centroid = 3.47 Å) and to the heterocyclic ring of the carbazole (CH…centroid = 3.32 Å). Two packing motifs are of importance. Firstly, carbazole and phen units in adjacent molecules engage in face-to-face π-stacking interactions, leading to the assembly of chains parallel to the c-axis (Fig. 4a). As Fig. 3a illustrates, the carbazole and phen units are slipped with respect to one another giving an optimum configuration for π-interactions; the carbazolecentroid…phenplane distance is 3.40 Å. Adjacent chains interact through π-stacking and this is best described in terms of the quadruple-decker stack shown in Fig. 4b. The central interaction is between a centrosymmetric pair of 1H-phenanthro[9,10-d]imidazole domains (interplane separation = 3.33 Å). Extension beyond the quadruple-decker unit is prevented by the CH…π contacts from the terminal methyl group of the n-octyl chain (Fig. 4b).
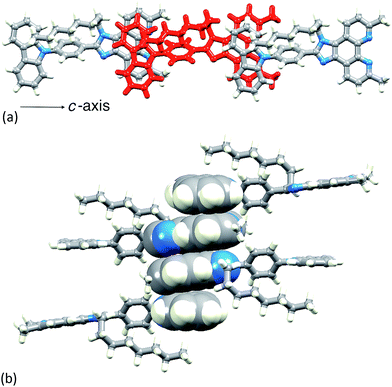 | ||
| Fig. 4 (a) In 4, chains run along the c-axis, assembled through π-stacking interactions between phen and carbazole units. (b) One quadruple-decker π-stack in 4. | ||
Synthesis and characterization of homoleptic copper complexes
The copper(I) complexes [CuL2][PF6] with L = 1, 3–5 were prepared by dropwise addition of an MeCN solution of [Cu(MeCN)4][PF6] to a solution of the ligand in CHCl3 or CH2Cl2. The preparation of [Cu(2)2][PF6] has previously been reported.26 The homoleptic complexes were isolated in 70.5–100% yield, and in the electrospray mass spectrum of each, the highest mass peak envelope corresponded to the [M − PF6]+ ion. 1H and 13C NMR spectra were assigned using COSY, NOESY, HMQC and HMBC methods (Fig. S1†). Differing solubility properties of free ligands and complexes precluded the use of common solvents for recording NMR spectra of ligands and copper(I) complexes. Nonetheless, the shifts to higher frequencies for the signals of the phen unit (HB3, HB8, HB4 and HB7) upon complexation are characteristic, as illustrated for 4 to [Cu(4)2][PF6] in Fig. 5.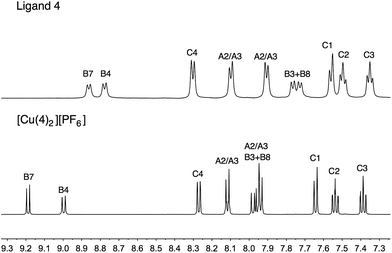 | ||
| Fig. 5 Comparison of the aromatic regions of the 500 MHz 1H NMR spectra of 4 (in DMSO-d6) and [Cu(4)2][PF6] (in CD3CN). See Scheme 2 for atom labelling. | ||
The solution absorption spectra of [CuL2][PF6] with L = 1–5 are shown in Fig. 6. The approximate doubling in the values of the extinction coefficients for the high-energy, ligand-centred absorptions (assigned to π* ← π transitions) on going from L (Fig. 4) to [CuL2]+ (Fig. 6) is consistent with the formation of the homoleptic complexes. The absorption around 470–475 nm for [Cu(1)2][PF6], [Cu(2)2][PF6], [Cu(3)2][PF6] and [Cu(4)2][PF6] arises from metal-to-ligand charge transfer (MLCT) and this undergoes a bathochromic shift to 486 nm on going to [Cu(5)2][PF6]. The enhanced spectral response of [Cu(5)2][PF6] at wavelengths above 375 nm is noteworthy in terms of the incorporation of the {Cu(5)} unit in TiO2-bound sensitizers (see later).
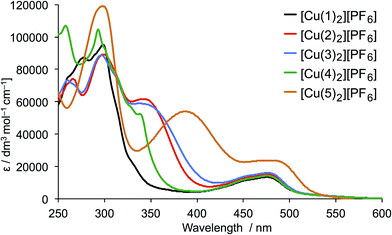 | ||
| Fig. 6 Solution absorption spectra of complexes [CuL2][PF6] for L = 1–5 (CH2Cl2, 1 × 10⁻⁵ mol dm−3). | ||
The copper(I) complexes are redox active and cyclic voltammograms were recorded in CH2Cl2 to avoid possible involvement by coordinating solvents such as MeCN. [Cu(1)2][PF6] exhibits a reversible oxidation process (Fig. 7) at +0.48 V assigned to the Cu+/Cu2+ redox couple. The value is close to the reported value of +0.50 V for 2,9-dimethyl-1,10-phenanthroline,41 indicating that the 2-(4-bromophenyl)-1-octyl-1H-imidazo unit in 1 has little effect on the oxidation potential of the copper(I) centre. For [Cu(2)2][PF6], [Cu(3)2][PF6], [Cu(4)2][PF6] and [Cu(5)2][PF6], a number of quasi-reversible or irreversible oxidation processes were observed (Fig. S2†) consistent with the introduction of the diphenylamino or carbazole functionalizations; these were not investigated in detail. Ligand-based reduction processes are poorly defined (Fig. 7) for all the complexes.
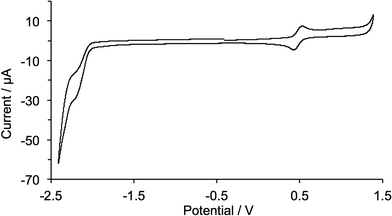 | ||
| Fig. 7 Cyclic voltammogram of [Cu(1)2][PF6] in CH2Cl2 solution (Epc − Epa = 74 mV) with respect to Fc/Fc+; scan rate = 0.1 V s−1. | ||
Preparation of DSCs and solid-state absorption spectra of dye-functionalized electrodes
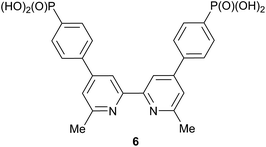
The [Cu(Lanchor)(Lancillary)]+ dyes, in which Lanchor is the phosphonic acid anchoring ligand 6![[thin space (1/6-em)]](https://www.rsc.org/images/entities/char_2009.gif) 42 (Scheme 6) and Lancillary is 1–5, were assembled on TiO2 electrodes by first soaking them in a solution of Lanchor followed by immersion in solutions of [Cu(1)2][PF6], [Cu(2)2][PF6], [Cu(3)2][PF6], [Cu(4)2][PF6] or [Cu(5)2][PF6]. Dye-bath concentrations and dipping times were the same for all electrodes. Commercial TiO2 electrodes with or without a scattering layer were used for DSC measurements or solid-state absorption spectroscopy, respectively. Electrodes with the reference dye N719 were prepared by soaking the TiO2 electrodes in solutions of the sensitizer. Although we have previously shown that DSCs (with screen-printed TiO2) incorporating [Cu(6)(2)]+ perform similarly using either I–/I3– or [Co(bpy)3]2+/3+ electrolytes,26 we chose in the present work to use a standard I–/I3– electrolyte (see Experimental section).
42 (Scheme 6) and Lancillary is 1–5, were assembled on TiO2 electrodes by first soaking them in a solution of Lanchor followed by immersion in solutions of [Cu(1)2][PF6], [Cu(2)2][PF6], [Cu(3)2][PF6], [Cu(4)2][PF6] or [Cu(5)2][PF6]. Dye-bath concentrations and dipping times were the same for all electrodes. Commercial TiO2 electrodes with or without a scattering layer were used for DSC measurements or solid-state absorption spectroscopy, respectively. Electrodes with the reference dye N719 were prepared by soaking the TiO2 electrodes in solutions of the sensitizer. Although we have previously shown that DSCs (with screen-printed TiO2) incorporating [Cu(6)(2)]+ perform similarly using either I–/I3– or [Co(bpy)3]2+/3+ electrolytes,26 we chose in the present work to use a standard I–/I3– electrolyte (see Experimental section).
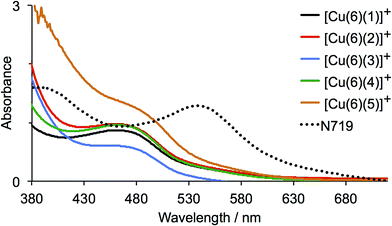
The solid-state absorption spectra of the sensitized electrodes are shown in Fig. 8; Fig. S3† shows photographs of the electrodes, all of which had the same soaking conditions in the dye baths. The values of λmax for the MLCT bands of [Cu(1)2]+, [Cu(2)2]+, [Cu(3)2]+ and [Cu(4)2]+ in solution (470–475 nm) are consistent with those of the on-surface dyes [Cu(6)(1)]+, [Cu(6)(2)]+, [Cu(6)(3)]+ and [Cu(6)(4)]+ (466–469 nm). Pleasingly, the enhanced absorption between 375–600 nm shown by [Cu(5)2]+ compared to the other homoleptic dyes in solution (Fig. 6) is also observed for the surface-anchored [Cu(6)(5)]+ (Fig. 8). However, none of the dyes absorbs as far into the red as N719.
DSC performances
Table 1 gives the performance parameters for duplicate DSCs containing [Cu(6)(1)]+, [Cu(6)(2)]+, [Cu(6)(3)]+, [Cu(6)(4)]+ and [Cu(6)(5)]+ on the day of assembly (day 0) and after 3 days. All DSCs show similar fill factor (ff) values. Values of the open-circuit voltage (VOC) for all the copper(I) dyes lie in the range 523–562 mV on day 0 and show a small gain over a 3 day ageing period (Table 1). Improved performance over time is a known phenomenon for copper(I)-containing dyes combined with an I–/I3– electrolyte;24 it has also been reported for ruthenium(II) dyes and appears to arise from disaggregation and reorganization of the surface-bound dye molecules.43 For DSCs with [Cu(6)(1)]+, [Cu(6)(2)]+, [Cu(6)(3)]+, [Cu(6)(4)]+ and [Cu(6)(5)]+, the improved VOC values are not complemented by an increase in the short-circuit current density (JSC) over time, and the overall efficiencies (η) remain similar or decrease from day 0 to day 3 (Table 1).| Dye | J SC/mA cm−2 | V OC/mV | ff/% | η/% | Relative η/% |
|---|---|---|---|---|---|
| On the day of sealing the DSCs | |||||
| [Cu(6)(1)]+ | 5.38 | 542 | 71 | 2.08 | 25.8 |
| [Cu(6)(1)]+ | 5.82 | 547 | 72 | 2.30 | 28.6 |
| [Cu(6)(2)]+ | 5.41 | 562 | 75 | 2.29 | 28.4 |
| [Cu(6)(2)]+ | 4.71 | 558 | 73 | 1.92 | 23.9 |
| [Cu(6)(3)]+ | 4.75 | 523 | 73 | 1.81 | 22.5 |
| [Cu(6)(3)]+ | 5.65 | 540 | 68 | 2.07 | 25.7 |
| [Cu(6)(4)]+ | 5.82 | 556 | 73 | 2.35 | 29.1 |
| [Cu(6)(4)]+ | 5.89 | 562 | 72 | 2.38 | 29.5 |
| [Cu(6)(5)]+ | 6.81 | 557 | 72 | 2.73 | 33.9 |
| [Cu(6)(5)]+ | 6.40 | 558 | 73 | 2.62 | 32.5 |
| N719 | 17.94 | 642 | 70 | 8.06 | 100.0 |
![[thin space (1/6-em)]](https://www.rsc.org/images/entities/char_2009.gif) |
|||||
| 3 days after sealing the DSCs | |||||
| [Cu(6)(1)]+ | 5.32 | 548 | 71 | 2.06 | 24.3 |
| [Cu(6)(1)]+ | 5.57 | 555 | 72 | 2.23 | 26.3 |
| [Cu(6)(2)]+ | 4.84 | 570 | 75 | 2.06 | 24.3 |
| [Cu(6)(2)]+ | 4.24 | 567 | 72 | 1.74 | 20.4 |
| [Cu(6)(3)]+ | 4.47 | 539 | 72 | 1.73 | 20.4 |
| [Cu(6)(3)]+ | 5.11 | 546 | 68 | 1.88 | 22.2 |
| [Cu(6)(4)]+ | 5.54 | 558 | 72 | 2.22 | 26.1 |
| [Cu(6)(4)]+ | 5.26 | 570 | 71 | 2.14 | 25.2 |
| [Cu(6)(5)]+ | 6.47 | 567 | 71 | 2.59 | 30.5 |
| [Cu(6)(5)]+ | 6.17 | 564 | 73 | 2.54 | 30.0 |
| N719 | 17.77 | 700 | 68 | 8.49 | 100.0 |
An important point is that these studies can be used to validate comparisons between DSC data from our laboratory where we use both commercial electrodes and those made in-house. Images obtained using scanning electron microscopy confirm that the ≈9 µm thickness of the transparent layer of a commercial electrode44 corresponds to 4-layers of in-house screen printed TiO2. The values of JSC, VOC, ff and η of the DSCs with [Cu(6)(2)]+ (Table 1) using commercial electrodes with scattering layer and an I–/I3– electrolyte, compare favourably with parameters (JSC = 5.11 mA cm−2, VOC = 574 mV, ff = 71%, η = 2.08%) for DSCs containing an I–/I3– electrolyte with the dye [Cu(6)(2)]+ anchored on 4-layer screen-printed electrodes post-treated with 40 mmol dm−3 H2O–TiCl4.26
The current density/potential (J–V) curves recorded on the day of device fabrication are shown in Fig. S4;† J–V curves for the best performing device from each pair of duplicate DSCs are displayed in Fig. 9. The DSCs sensitized with [Cu(6)(5)]+ outperform the other solar cells, the main contributing factor being enhanced JSC values. This is consistent with extended light absorption towards the red for complexes containing 5 (Fig. 8) and is confirmed by the higher external quantum efficiencies (EQE) of the DSCs. EQE spectra for all devices are shown Fig. S5,† and Fig. 10 depicts the spectra for the best performing DSC of each pair; values of EQEmax and λmax are given in Table 2. Although the values of EQEmax for [Cu(6)(1)]+ and [Cu(6)(4)]+ are higher than for [Cu(6)(5)]+ (Table 2), the extension of the EQE spectrum of the DSCs with [Cu(6)(5)]+ to longer wavelengths (Fig. 10 and S5†) leads to higher JSC values with respect to DSCs with the other dyes. Fig. S6† shows a comparison of the EQE spectra of duplicate DSCs containing [Cu(6)(5)]+ with the EQE spectrum of an N719 sensitized DSC, and demonstrates the origins of the lower values of JSC for the copper(I) dye versus the ruthenium(II) reference dye.
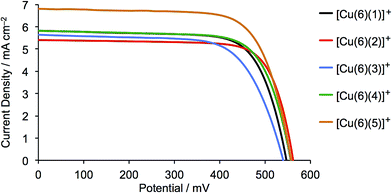 | ||
| Fig. 9 J–V curves for DSCs containing the sensitizers [Cu(6)(1)]+, [Cu(6)(2)]+, [Cu(6)(3)]+, [Cu(6)(4)]+ and [Cu(6)(5)]+; see also Fig. S4†. Data were recorded on the day of DSC fabrication. | ||
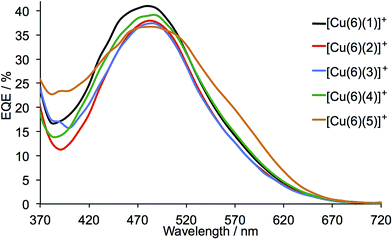 | ||
| Fig. 10 EQE spectra of DSCs containing the sensitizers [Cu(6)(1)]+, [Cu(6)(2)]+, [Cu(6)(3)]+, [Cu(6)(4)]+ and [Cu(6)(5)]+; see also Fig. S5.† The spectra were recorded 3 days after cell assembly. | ||
| Anchored dye | EQEmax/% | λ max/nm |
|---|---|---|
| [Cu(6)(1)]+ | 41.0 | 480 |
| [Cu(6)(1)]+ | 39.4 | 480 |
| [Cu(6)(2)]+ | 37.9 | 480 |
| [Cu(6)(2)]+ | 35.3 | 480 |
| [Cu(6)(3)]+ | 37.3 | 480 |
| [Cu(6)(3)]+ | 34.7 | 480 |
| [Cu(6)(4)]+ | 39.0 | 480 |
| [Cu(6)(4)]+ | 39.1 | 480 |
| [Cu(6)(5)]+ | 36.6 (sh. 19.5) | 490 (sh. 570) |
| [Cu(6)(5)]+ | 37.1 (sh. 19.5) | 490 (sh. 570) |
| N719 | 74.4 | 530 |
Conclusions
We have reported the synthesis and characterization of a series of homoleptic [Cu(L)2][PF6] complexes in which L is a 2,9-dimethyl-1,10-phenanthroline substituted in either the 5,6-positions with a peripherally-functionalized imidazole unit or in the 4,7-positions with electron-donating 4-(diphenylamino)phenyl groups. The solution absorption spectrum of [Cu(5)2][PF6] exhibits a greater spectral response above 375 nm than those of [Cu(1)2][PF6], [Cu(2)2][PF6], [Cu(3)2][PF6] and [Cu(4)2][PF6]. The heteroleptic dyes [Cu(6)(L)]+ were assembled in a stepwise manner on TiO2 electrodes, and solid-state absorption spectra confirmed enhanced absorption between 375–600 nm for [Cu(6)(5)]+ compared to [Cu(6)(1)]+, [Cu(6)(2)]+, [Cu(6)(3)]+ and [Cu(6)(4)]+. Comparison of the performances of DSCs containing [Cu(6)(2)]+, [Cu(6)(3)]+ and [Cu(6)(4)]+ with those with [Cu(6)(1)]+ suggests only a marginal influence of the diphenylamine or carbazole hole-transporting domains in 5,6-substituted phenanthroline dyes. In ancillary ligand 5, the 4-(diphenylamino)phenyl hole-transporting units are introduced directly into the 4- and 7-positions of the phen unit, and this combined with a phosphonic anchoring domain in [Cu(6)(5)]+ leads to the best performing DSCs of those investigated. Although the values of EQEmax for [Cu(6)(1)]+ and [Cu(6)(4)]+ exceed that of [Cu(6)(5)]+, the extension of the EQE spectrum of the DSCs with [Cu(6)(5)]+ towards the red-end of the spectrum results in higher JSC values with respect to DSCs with the other dyes. We are currently exploring the effects on DSC performance of introducing other substituents in the 4,7-positions of 2,9-dimethyl-1,10-phenanthrolines used as ancillary ligands in heteroleptic copper(I) sensitizers, and are also focusing on electrolyte optimization.Acknowledgements
We acknowledge financial support from the European Research Council (Advanced Grant 267816 LiLo), the Swiss National Science Foundation (Grant 200020_144500) and the University of Basel.Notes and references
- B. O'Regan and M. Grätzel, Nature, 1991, 353, 737 CrossRef PubMed.
- G. C. Vougioukalakis, A. I. Philippopoulos, T. Stergiopoulos and P. Falaras, Coord. Chem. Rev., 2011, 255, 2602 CrossRef CAS PubMed.
- A. Mishra, M. K. R. Fischer and P. Bäuerle, Angew. Chem., Int. Ed., 2009, 48, 2474 CrossRef CAS PubMed.
- L.-L. Li and E. W.-G. Diau, Chem. Soc. Rev., 2013, 42, 291 RSC.
- A. Yella, H.-W. Lee, H. N. Tsao, C. Yi, A. K. Chandiran, M. K. Nazeeruddin, E. W.-G. Diau, C.-Y. Yeh, S. M. Zakeeruddin and M. Grätzel, Science, 2011, 334, 629 CrossRef CAS PubMed; M. Zhang, Y. Wang, M. Xu, W. Ma, R. Li and P. Wang, Energy Environ. Sci., 2013, 6, 2944 Search PubMed; K. Kakiage, Y. Aoyama, T. Yano, T. Otsuka, T. Kyomen, M. Unno and M. Hanaya, Chem. Commun., 2014, 50, 6379 RSC; H. Ozawa, Y. Okuyama and H. Arakawa, ChemPhysChem, 2014, 15, 1201 CrossRef PubMed.
- Z. Lin, N.-G. Park and G. Li, J. Mater. Chem. A, 2015, 3, 8924 CAS and papers in this perovskite-themed issue of the journal.
- N. J. Jeon, J. H. Noh, W. S. Yang, Y. C. Kim, S. Ryu, J. Seo and S. I. Seok, Science, 2015, 348, 1234 CrossRef PubMed.
- W. S. Yang, J. H. Noh, N. J. Jeon, Y. C. Kim, S. Ryu, J. Seo and S. I. Seok, Nature, 2015, 517, 476 CrossRef PubMed.
- B. Bozic-Weber, E. C. Constable and C. E. Housecroft, Coord. Chem. Rev., 2013, 257, 3089 CrossRef CAS PubMed.
- T. Bessho, E. C. Constable, M. Graetzel, A. Hernandez Redondo, C. E. Housecroft, W. Kylberg, M. K. Nazeeruddin, M. Neuburger and S. Schaffner, Chem. Commun., 2008, 3717 RSC; B. Bozic-Weber, E. C. Constable, C. E. Housecroft, P. Kopecky, M. Neuburger and J. A. Zampese, Dalton Trans., 2011, 12584 RSC.
- N. Alonso-Vante, J.-F. Nierengarten and J.-P. Sauvage, J. Chem. Soc., Dalton Trans., 1994, 1649 RSC.
- F. J. Malzner, S. Y. Brauchli, E. C. Constable, C. E. Housecroft and M. Neuburger, RSC Adv., 2014, 4, 48712 RSC.
- M. Sandroni, L. Favereau, A. Planchat, H. Akdas-Kilig, N. Szuwarski, Y. Pellegrin, E. Blart, H. Le Bozec, M. Boujtita and F. Odobel, J. Mater. Chem. A, 2014, 2, 9944 CAS.
- A. Colombo, C. Dragonetti, M. Magni, D. Roberto, F. Demartin, S. Caramori and C. A. Bignozzi, ACS Appl. Mater. Interfaces, 2014, 6, 13945 CAS.
- See for example: S. Sakaki, T. Kuroki and T. Hamada, J. Chem. Soc., Dalton Trans., 2002, 840 RSC; E. C. Constable, A. Hernandez Redondo, C. E. Housecroft, M. Neuburger and S. Schaffner, Dalton Trans., 2009, 6634 RSC; B. Bozic-Weber, E. C. Constable, C. E. Housecroft, M. Neuburger and J. R. Price, Dalton Trans., 2010, 3585 RSC; A. Colombo, C. Dragonetti, D. Roberto, A. Valore, P. Biagini and F. Melchiorre, Inorg. Chim. Acta, 2013, 407, 204 CrossRef CAS PubMed.
- M. Mohamkumar, F. Monti, M. Holler, F. Niess, B. Delavaux-Nicot, N. Armaroli, J.-P. Sauvage and J.-F. Nierengarten, Chem.–Eur. J., 2014, 20, 12083 CrossRef PubMed and references therein.
- See for example: M. Schmittel and A. Ganz, Chem. Commun., 1997, 999 RSC; M. Schmittel, H. Ammon, V. Kalsani, A. Wiegrefe and C. Michel, Chem. Commun., 2002, 2566 RSC.
- M. Sandroni, M. Kayanuma, A. Planchat, N. Szuwarski, E. Blart, Y. Pellegrin, C. Daniel, M. Boujtita and F. Odobel, Dalton Trans., 2013, 10818 RSC.
- A. Hernandez Rendondo, E. C. Constable and C. E. Housecroft, Chimia, 2009, 63, 205 CrossRef.
- E. Schönhofer, B. Bozic-Weber, C. J. Martin, E. C. Constable, C. E. Housecroft and J. A. Zampese, Dyes Pigm., 2015, 115, 154 CrossRef PubMed.
- N. Hostettler, S. O. Fürer, B. Bozic-Weber, E. C. Constable and C. E. Housecroft, Dyes Pigm., 2015, 116, 124 CrossRef CAS PubMed.
- S. Y. Brauchli, F. J. Malzner, E. C. Constable and C. E. Housecroft, RSC Adv., 2015, 5, 48516 RSC and references therein.
- N. Hostettler, I. A. Wright, B. Bozic-Weber, E. C. Constable and C. E. Housecroft, RSC Adv., 2015, 5, 37906 RSC and references therein.
- S. Y. Brauchli, F. J. Malzner, E. C. Constable and C. E. Housecroft, RSC Adv., 2014, 4, 62728 RSC and references therein.
- See for example: Y.-C. Hsu, H. Zheng, J. T. Lin and K. C. Ho, Sol. Energy Mater. Sol. Cells, 2005, 87, 357 CrossRef CAS PubMed; J.-F. Yin, D. Bhattacharya, Y.-C. Hsu, C.-C. Tsai, K.-L. Lu, H. C. Lin, J.-G. Chen and K.-C. Ho, J. Mater. Chem., 2009, 19, 7036 RSC; S.-H. Fan, A.-G. Zhang, C.-C. Ju, L.-H. Gao and K.-Z. Wang, Inorg. Chem., 2010, 49, 3752 CrossRef PubMed; S.-H. Fan, A.-G. Zhang, C.-C. Ju, L.-H. Gao and K.-Z. Wang, Sol. Energy, 2011, 85, 2497 CrossRef PubMed; Q.-Y. Yu, J.-F. Huang, Y. Shen, L.-M. Xiao, J.-M. Liu, D.-B. Kuang and C.-Y. Su, RSC Adv., 2013, 3, 19311 RSC.
- B. Bozic-Weber, E. C. Constable, S. O. Fürer, C. E. Housecroft, L. J. Troxler and J. A. Zampese, Chem. Commun., 2013, 49, 7222 RSC.
- See for example: J. E. Kroeze, N. Hirata, S. Koops, M. K. Nazeeruddin, L. Schmidt-Mende, M. Grätzel and J. R. Durrant, J. Am. Chem. Soc., 2006, 128, 16376 CrossRef CAS PubMed; Y. Ooyama and Y. Harima, Eur. J. Org. Chem., 2009, 2903 CrossRef PubMed; W. H. Nguyen, C. D. Bailie, J. Burschka, T. Moehl, M. Grätzel, M. D. McGehee and A. Sellinger, Chem. Mater., 2013, 25, 1519 CrossRef; Q. Feng, G. Zhou and Z.-S. Wang, J. Power Sources, 2013, 239, 16 CrossRef PubMed; K. Omata, S. Kuwahara, K. Katayama, S. Qing, T. Toyoda, K.-M. Lee and C.-G. Wu, Phys. Chem. Chem. Phys., 2015, 17, 10170 RSC and references therein.
- R. H. Zheng, H. C. Guo, H. J. Jiang, K. H. Xu, B. B. Liu, W. L. Sun and Z. Q. Shen, Chin. Chem. Lett., 2010, 21, 1270 CrossRef CAS PubMed.
- K. Guzow, M. Czerwińska, A. Ceszlak, M. Kozarzewska, M. Szabelski, C. Czaplewski, A. Łukaszewicz, A. Kubicki and W. Wiczk, Photochem. Photobiol. Sci., 2013, 12, 284 CAS.
- A. F. Larsen and T. Ulven, Org. Lett., 2011, 13, 3546 CrossRef CAS PubMed.
- G. J. Kubas, Inorg. Synth., 1990, 28, 68 CrossRef CAS PubMed.
- M. Shallaiah, Y. C. Rajan and H.-C. Lin, J. Mater. Chem., 2012, 22, 8976 RSC.
- S. A. Odom, K. Lancaster, L. Beverina, K. M. Lefler, N. J. Thompson, V. Coropceanu, J.-L. Brédas, S. R. Marder and S. Barlow, Chem.–Eur. J., 2007, 34, 9637 CrossRef PubMed.
- Bruker Analytical X-ray Systems, Inc., APEX2, version 2 User Manual, M86-E01078, Madison, WI, 2006 Search PubMed.
- P. W. Betteridge, J. R. Carruthers, R. I. Cooper, K. Prout and D. J. Watkin, J. Appl. Crystallogr., 2003, 36, 1487 CrossRef CAS.
- I. J. Bruno, J. C. Cole, P. R. Edgington, M. K. Kessler, C. F. Macrae, P. McCabe, J. Pearson and R. Taylor, Acta Crystallogr., Sect. B: Struct. Sci., 2002, 58, 389 CrossRef PubMed.
- C. F. Macrae, I. J. Bruno, J. A. Chisholm, P. R. Edgington, P. McCabe, E. Pidcock, L. Rodriguez-Monge, R. Taylor, J. van de Streek and P. A. Wood, J. Appl. Crystallogr., 2008, 41, 466 CrossRef CAS.
- H. J. Snaith, Energy Environ. Sci., 2012, 5, 6513 Search PubMed.
- H. J. Snaith, Nat. Photonics, 2012, 6, 337 CrossRef CAS PubMed.
- N. Herron, M. A. Guidry, V. Rostovtsev, W. Gao, Y. Wang, Y. Shen and J. A. Merlo, Appl. number PCT/US2009/069184 (International Publication Number WO 2010/075379 A2).
- M. K. Eggleston, D. R. McMillin, K. S. Koenig and A. J. Pallenberg, Inorg. Chem., 1997, 36, 172 CrossRef CAS.
- B. Bozic-Weber, S. Y. Brauchli, E. C. Constable, S. O. Fürer, C. E. Housecroft, F. J. Malzner, I. A. Wright and J. A. Zampese, Dalton Trans., 2013, 12293 RSC.
- B. Wenger, M. Grätzel and J.-E. Moser, J. Am. Chem. Soc., 2005, 127, 12150 CrossRef CAS PubMed; B. Wenger, M. Grätzel and J.-E. Moser, Chimia, 2005, 59, 123 CrossRef; V. K. Thorsmølle, B. Wenger, J. Teuscher, C. Bauer and J.-E. Moser, Chimia, 2007, 61, 631 CrossRef.
- S. Y. Brauchli, B. Bozic-Weber, E. C. Constable, N. Hostettler, C. E. Housecroft and J. A. Zampese, RSC Adv., 2014, 4, 34801 RSC.
Footnote |
| † Electronic supplementary information (ESI) available: Fig. S1: representative HMQC and HMBC spectra. Fig. S2: cyclic voltammograms of copper(I) complexes; Fig. S3: photographs of dye-functionalized electrodes; Fig. S4–S6: J–V curves and EQE spectra. CCDC 1405837. For ESI and crystallographic data in CIF or other electronic format see DOI: 10.1039/c5ra12296a |
| This journal is © The Royal Society of Chemistry 2015 |

