Synthesis and characterization of flurbiprofen axetil-loaded electrospun MgAl-LDHs/poly(lactic-co-glycolic acid) composite nanofibers

Chunyu Yanga, Tonghe Zhua, Jihu Wanga, Sihao Chen*a and Wenyao Li*b
aCollege of Chemistry and Chemical Engineering, Shanghai University of Engineering Science, Shanghai 201620, People's Republic of China. E-mail: chensh@sues.edu.cn; Fax: +86 21 67791239; Tel: +86 21 67791239
bSchool of Material Engineering, Shanghai University of Engineering Science, Shanghai 201620, People's Republic of China. E-mail: liwenyao314@gmail.com; Fax: +86 21 67791474; Tel: +86 21 67791474

Received 11th June 2015 , Accepted 5th August 2015

First published on 6th August 2015


Abstract

We have reported a facile method to fabricate drug-loaded hybrid nanofibers for drug sustained release. In our work, a model drug FA was intercalated into the interlayers of layered double hydroxides (LDHs) by ion-exchange intercalation. The particles were dispersed into the PLGA solution to form the electrospun hybrid nanofibers. The intercalation of FA into the LDHs interlayers (MgAl–FA-LDHs) and the composite nanofibers were characterized via different techniques. The results of XRD and FTIR indicate that FA molecules are intercalated into the MgAl-LDHs interlayers. The formed composite nanofibers exhibit a uniform and smooth morphology and the hydrophilicity did not improve significantly. Importantly, the drug-loaded MgAl–FA-LDHs/PLGA shows a sustained release profile which indicates the MgAl-LDHs can be candidates for drug sustained release.

1. Introduction

Flurbiprofen axetil (FA) is a type of lipid microsphere non-steroidal anti-inflammatory drug.1–3 Pain on injection is an acknowledged adverse (AE) of propofol administration for the induction of general anesthesia. Flurbiprofen axetil has been reported to reduce the pain of injection.4–6 However, results of published papers on the efficacy of flurbiprofen axetil in managing pain on injection of propofol are inconsistent.

Layered double hydroxides (LDHs) are well known biocompatible inorganic materials that have recently been used for the development of drug delivery and controlled release systems.7–13 LDHs, which are also known as anionic clay or hydrotalcite-like compounds, can be represented by the general formula [M1−x2+Mx3+(OH2)](An)x/n·mH2O, where M2+ and M3+ are di- and trivalent cations, respectively, and An is the interlayer anion. LDH layers possess positive charges because of the isomorphous substitution, which is balanced by interlayer hydrated anions. The lamellar structure and anion exchange properties of LDHs enable some anionic drugs and bio-molecules to be readily intercalated into their interlayer to form drug or bio-LDH nanohybrids.

Electrospinning, a technique producing ultrafine fibers with diameters ranging from tens of nanometers to several microns, has attracted much attention due to its versatility and potential for applications in the fields of tissue engineering14–18 and pharmaceutical science.19–23 Particularly, electrospun nanofibers with remarkable features such as high porosity, high specific surface area, good structure controllability and space grid structure make them well suited for drug delivery, cell proliferation and tissue repair.24,25 In our previous work, we have shown that flurbiprofen axetil (FA) drug molecules were physically encapsulated within the polyvinylpyrrolidone (PVP), followed by electrospinning the mixture solution of biopolymers and FA-loaded PVP to form a composite drug incorporated nanofiber, which was proved to be able to significantly alleviate the burst release of FA.26,27

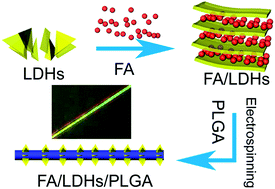
In this work, we attempted to develop a facile approach to fabricating MgAl-LDHs-doped PLGA nanofibers via electrospinning for drug encapsulation and release. A model drug FA was first intercalated into the MgAl-LDHs interlayers via an ion-exchange intercalation method. Then the FA-intercalated MgAl-LDHs particles were mixed with PLGA solution for subsequent formation of electrospinning MgAl–FA-LDHs/PLGA composite nanofibers (Scheme 1). Compared with other drug-loaded systems (such as hybrid drug-loaded system and coaxial electrospinning drug-loaded system, etc.), this drug-loaded system could improve the burst release phenomenon at the initial phase of drug release to some extent. The intercalation of FA into MgAl-LDHs interlayers and the formation of MgAl–FA-LDHs/PLGA composite nanofibers were characterized using different techniques. The release kinetics of FA from the composite MgAl–FA-LDHs/PLGA nanofibers was investigated using UV-Vis spectroscopy and compared with FA/MgAl-LDHs mixture, MgAl–FA-LDHs particles and FA/PLGA nanofibers.


image file: c5ra11150a-s1.tif
Scheme 1 Schematic illustration of the encapsulation of FA within LDHs-doped PLGA nanofibers.

2. Experimental section

2.1 Materials

PLGA (Mw = 100[thin space (1/6-em)]000 g mol−1) with a lactic acid/glycolic acid ratio (molar ratio) of 50[thin space (1/6-em)]:[thin space (1/6-em)]50 and FA (purity > 99%) were purchased from Jinan Daigang Biotechnology Co., Ltd (Shandong, China) and Shanghai Xinya Pharmaceutical Co., Ltd (Shanghai, China), respectively. NO3-LDHs was homemade and the particle size distribution ranged from 60 to 100 nm. Tetrahydrofuran (THF) and N,N-dimethylformamide (DMF) which are analytically pure (AR) were purchased from Sinopharm Chemical Reagent Co., Ltd (Shanghai, China). All the other reagents used were of analytical grade and were used without further purification. The water used in the current study was purified.

2.2 Intercalation of FA into the interlayers of LDHs

An EtOH solution of FA (10 mL, 4 mg mL−1) was added dropwise into a THF suspension of sieved NO3-LDHs (10 mL, 3 mg mL−1) and stirred (3000 rpm) for 30 min. Under nitrogen atmosphere, the 2 mol L−1 NaOH and 0.5 mol L−1 Na2CO3 mixture was dropped into the above mixture to hold constant pH which equaled 10. The exchange process was stirred vigorously for 24 h at room temperature. The formed MgAl–FA-LDHs nanohybrid was separated by centrifugation (5000 rpm, for 5 min) and washed with EtOH three times to remove the excess free FA non-intercalated into the MgAl-LDHs interlayers. The FA concentration in the supernatant was analyzed using a 752N UV-Vis spectrophotometer (Jingke Industrial Co., Ltd, Shanghai, China) at 254 nm using a standard FA concentration–absorbance calibration curve and the FA loading percentage was calculated by eqn (1):
 
FA intercalation percentage = Ma/(Ma + M0) × 100% (1)
where Ma and M0 stands for the mass of intercalated FA and the MgAl-LDHs carrier, respectively. Finally, the MgAl–FA-LDHs was lyophilized, ground down, and sieved to have a uniform size for subsequent electrospinning process. The drug intercalation percentage was optimized by changing the concentrations of FA and MgAl-LDHs, respectively.

2.3 Preparation of electrospinning MgAl–FA-LDHs/PLGA nanofibers

PLGA was dissolved in THF/DMF (v/v = 3[thin space (1/6-em)]:[thin space (1/6-em)]1) at an optimized concentration of 20 wt%. MgAl–FA-LDHs powder (1 wt% FA relative to PLGA) was then blended with PLGA solution for subsequent electrospinning. For comparison, a predetermined amount of MgAl-LDHs (5 wt% relative to PLGA) was added to PLGA solution and stirred for 1 h to get a homogeneous solution. The electrospinning nanofibers were prepared with an electrospinning equipment (SS-2534H Electrospinning Equipment, Beijing Ucalery Technology Co., Ltd, Beijing, China) using a stainless steel needle with an inner diameter of 0.6 mm. A voltage of 15 kV was applied to the collecting target by a high voltage power supply, the nanofibers were collected on a target drum placed 14 cm from the syringe tip and the roller rotation speed was 30 revolutions per minute, and the electrospinning solution flow rate of 1.5 mL h−1 controlled by a syringe pump. The formed electrospun fibrous mats were vacuum dried at room temperature for at least 2 d to remove the residual organic solvent and moisture.

2.4 Characterization

The crystalline structure of the samples was analyzed by X-ray diffraction (XRD) on a wide-angle analyzer (D/max-2500PC, Bruker) with a CuKα source (λ = 0.154 nm) operating at 100 mA and 40 kV. The diffraction patterns were collected from 5 to 80° (2θ) at a scanning rate of 10° min−1.

Fourier transform infrared spectroscopy (FTIR) was performed using a Nicolet FT-IR 370 spectrometer in a wavenumber range from 500 to 4000 cm−1 with a resolution of 2 cm−1 to confirm the loading of FA into the MgAl-LDHs interlayers. The dried samples were mixed with KBr crystals and pressed into pellets before measurements.

Morphologies of pure PLGA, FA/PLGA, MgAl-LDHs/PLGA, and MgAl–FA-LDHs/PLGA were observed by a scanning electron microscope (SEM) (SU8010, Hitachi, Japan). The samples were sprayed gold with a thickness about 10 nm before observation and the diameters of the fibers were measured and statistics by a Image-Pro Plus software.

The hydrophobic or hydrophilic performance of the nanofiber membranes were measured by a JC2000D2A water contact angle tester (Zhongchen Digital Technic Apparatus Co., Ltd, Shanghai, China). The samples were cut into 20 mm × 20 mm and attached to the glass slides, and one droplet of distilled water about 2 μL was dropped onto the random area of each membrane at room temperature and humidity. Each sample needs to be measured five times.

2.5 In vitro drug release

The release of FA from MgAl–FA-LDHs particle, FA/PLGA and MgAl–FA-LDHs/PLGA was determined by the absorbance of FA in phosphate-buffered saline (PBS) at 254 nm using a 752N UV-Vis spectrophotometer (Jingke Industrial Co., Ltd, Shanghai, China). For the MgAl–FA-LDHs particles, 20 mg was put into a dialysis tube containing 5 mL PBS (pH = 7.4). Then the dialysis tube was placed into a conical flask with 45 mL PBS. While for nanofiber membranes, a certain amount of FA/PLGA and MgAl–FA-LDHs/PLGA nanofiber membranes was weighed to ensure that the FA in the membranes had the approximate weight with the FA in the MgAl–FA-LDHs particles and added into the different conical flasks containing 50 mL PBS. All the conical flasks were numbered and incubated in a incubator shaker at 37 °C with a vibrating speed of 100 rpm. The experiment was done in triplicate. At scheduled time intervals, 3 mL PBS was taken and other 3 mL fresh PBS was added to ensure the solution environment rough balance.

3. Results and discussion

3.1 Intercalation of MgAl-LDHs with FA

The powder XRD patterns of the pristine MgAl-LDHs and MgAl–FA-LDHs are shown in Fig. 1. The pristine MgAl-LDHs and the MgAl-LDHs intercalation with FA almost have the same sharp absorption peak at (003), (006), (102), (110) and (113) planes and broad asymmetric peaks at (105) and (108) planes which are the characteristic peaks of MgAl-LDHs.28 The intercalation of FA made the peak at (003) plane generate “blue shift” about 0.4° (2θ from 11.33° to 10.98°) and the intensity of the peak which we could see in the top right-hand corner of the XRD patterns became a little weak. The calculation of the layer spacing via Bragg equation found that the layer spacing of MgAl-LDHs was 0.78 nm, while for the MgAl-LDHs intercalated with FA, the layer spacing was 0.81 nm. The increase of the MgAl-LDHs indicated that FA was intercalated into the interlayer of MgAl-LDHs.
image file: c5ra11150a-f1.tif
Fig. 1 XRD patterns of (a) pristine MgAl-LDHs and (b) MgAl–FA-LDHs.

The successful intercalation of FA into the MgAl-LDHs was also qualitatively confirmed by FTIR spectroscopy (Fig. 2). In Fig. 2a, the typical absorption bands at 1755, 1230 and 1070 cm−1 are due to the carbonyl group, the stretching vibration of C[double bond, length as m-dash]C group and the stretching vibration of C–C bond of FA, respectively. The weak peak near 3000 cm−1 is attributed to the absorption band of the C–H. In Fig. 2b (curve 1), the broad absorption peak near 3500 cm−1 is due to the stretching vibration of O–H groups of both the hydroxide layer and interlayer bonding water. The weak band at 1640 cm−1 is ascribed to the C[double bond, length as m-dash]O bond of CO32−. The strong absorption band at 1385 cm−1 is caused by the asymmetric stretching vibration C–O of the CO32−, compared with the wavenumber of free state CO32− at 1415 cm−1, this peak obviously shifts to low wavenumbers (“red shift”), which indicates CO32− inserted between layers are not free state any more but have strong hydrogen bonds with the interlaminar water molecules. In the low-frequency region, the bands at 658 cm−1 is considered to the lattice vibration modes due to M–O and O–M–O vibrations.29,30 In the MgAl–FA-LDHs (curve 2), the absorption band at 1750 cm−1 is assigned to the stretching vibration of the carbonyl group, while the weak peaks at 1230 and 1060 cm−1 correspond to the stretching vibrations of C[double bond, length as m-dash]C and C–C, respectively. Upon comparing FTIR spectra of the intercalation MgAl–FA-LDHs with FA itself, it is clear that FA is intercalated MgAl-LDHs successfully and the structure of drug molecules is not changed.


image file: c5ra11150a-f2.tif
Fig. 2 FTIR spectra of free FA (a), and MgAl-LDHs before (curve 1) and after (curve 2) FA loading (b).

The intercalation percentage of FA into MgAl-LDHs was optimized by regulating the respective concentration of NO3-LDHs and FA at the same experimental conditions. Fig. 3 shows the profile of the FA intercalation percentage as a function of FA concentration under different NO3-LDHs concentrations. It is clear that the FA intercalation percentage increases with the increase of FA concentration and as the NO3-LDHs concentration increases, the FA intercalation percentage increases first then increases slowly, even when the concentration of NO3-LDHs is 4 mg mL−1, the FA intercalation percentage appears increase first then decrease. This could be ascribed to the aggregation of NO3-LDHs at high concentration, which limited the intercalation of FA molecules. Therefore, the optimized FA intercalation percentage is 23.26% at the optimized concentration of FA (4 mg mL−1) and NO3-LDHs (3 mg mL−1).


image file: c5ra11150a-f3.tif
Fig. 3 The FA intercalation percentage as a function of FA concentration under different NO3-LDHs concentrations.

3.2 Fabrication of electrospinning FA/MgAl-LDHs/PLGA nanofibers

The obtained FA/MgAl-LDHs particles with optimized FA intercalation percentage were then doped with PLGA solution via electrospinning to fabricate MgAl–FA-LDHs/PLGA composite nanofibers (Scheme 1). As a reference for comparison, pure PLGA nanofibers, FA-doped PLGA nanofibers and MgAl-LDHs-doped PLGA nanofibers without FA were also prepared in the same condition. The surface morphology of the PLGA, FA/PLGA, MgAl-LDHs/PLGA, MgAl–FA-LDHs/PLGA nanofibers were observed by SEM (Fig. 4). As shown in Fig. 4, PLGA (Fig. 4a) and FA/PLGA (Fig. 4b) nanofibers exhibited uniform and smooth morphology, which indicated good electrospinnability of PLGA.31–33 While the incorporation of MgAl-LDHs and MgAl–FA-LDHs altered the uniform morphology of PLGA nanofibers and some “beaded” fibers formed (Fig. 4c and d). The diameters of electrospun PLGA, FA/PLGA, MgAl-LDHs/PLGA, FA/MgAl-LDHs/PLGA nanofibers were estimated to be 906 ± 317 nm, 992 ± 205 nm, 1014 ± 414 nm and 1028 ± 210 nm, respectively. The larger diameters of FA/PLGA, MgAl-LDHs/PLGA and FA/MgAl-LDHs/PLGA composite nanofibers than that of pure PLGA nanofibers are presumably attributed to the large increase of the conductivity of the solution, which causes the increase of the flow rate of the solution, thus making the diameter of the nanofibers increase. Additionally, the excess additives make the increase of the viscosity of the solution which can drastically increase the viscous stress and in consequence the fiber diameter increases.
image file: c5ra11150a-f4.tif
Fig. 4 SEM micrographs and diameter distribution histograms of electrospun PLGA fibers, (a) pure PLGA fibers, (b) FA/PLGA composite fibers (4 wt% FA relative to PLGA), (c) MgAl-LDHs/PLGA composite fibers (5 wt% MgAl-LDHs relative to PLGA) and (d) MgAl–FA-LDHs/PLGA composite fibers (5 wt% MgAl–FA-LDHs relative to PLGA).

In order to confirm the existence of MgAl-LDHs in the composite nanofibers, pure PLGA and MgAl-LDHs/PLGA nanofibers were observed under metallurgical microscope under the polarized light in dark field (Fig. 5). It is clear that the pure PLGA nanofibers (Fig. 5a) under metallurgical microscope present dark because PLGA itself is opaque and it presents original colour. While for MgAl-LDHs/PLGA nanofibers (Fig. 5b), the MgAl-LDHs is crystal and appears bright under the polarized light in dark field, which is consistent with the reported literature.34


image file: c5ra11150a-f5.tif
Fig. 5 Metallurgical microscope images of (a) pure PLGA and (b) MgAl-LDHs/PLGA fibers under the polarized light in dark field.

Surface hydrophilicity is an important parameter for electrospun nanofibers to be used in biomedical applications. Fig. 6 shows the water contact angle variations of the electrospun PLGA, FA/PLGA, MgAl-LDHs/PLGA and FA/MgAl-LDHs/PLGA nanofibers. It can be seen that the water contact angle of the pure PLGA nanofibers was 121.65 ± 0.76°, indicating PLGA is hydrophobic.35,36 While the incorporation of FA, MgAl-LDHs, FA/MgAl-LDHs does not seem to significantly change the hydrophilicity of the nanofiber membranes, this is likely due to the diameter of the fibers does not alter largely.


image file: c5ra11150a-f6.tif
Fig. 6 Water contact angle of PLGA, FA/PLGA, MgAl-LDHs/PLGA and MgAl–FA-LDHs/PLGA nanofibers. Data are shown as mean ± SD (n = 5).

3.3 Release of FA from MgAl–FA-LDHs/PLGA composite nanofibers

Drug release profiles for FA/MgAl-LDHs mixture, MgAl–FA-LDHs, FA/PLGA nanofibers and MgAl–FA-LDHs/PLGA nanofibers are presented in Fig. 7. For FA/MgAl-LDHs mixture (Fig. 7a), the drug release rate was very rapid and the drug release cycle was very short, about 2 h. Because the method of physical hybrid only made FA molecules adsorb on the MgAl-LDHs and the interaction was very weak, FA molecules were very easy to be separated from MgAl-LDHs in the process of drug release. Additionally, it is clear that both MgAl–FA-LDHs and FA/PLGA nanofibers (Fig. 7b) shows an obvious initial burst release in the initial 24 h. Within the first 24 h, approximate 70% of the drug was released and only about 10% was released at the following 4 days with a relatively slow speed (totally released < 80% in 5 days). By contrast, the FA release from MgAl–FA-LDHs/PLGA nanofibers (Fig. 7b) needs to go through two processes: the FA molecules dissociate from the interlays of MgAl-LDHs and the free FA molecules diffuse from the PLGA fiber mat. Therefore, about 24% of the FA was released in the initial 24 h and the release was very slow at the following two days which tended towards stability after day 3. So, only 39.19% of the FA was released in 5 days.
image file: c5ra11150a-f7.tif
Fig. 7 In vitro release of FA from (a) FA/MgAl-LDHs mixture and (b) MgAl–FA-LDHs, FA/PLGA nanofibers and MgAl–FA-LDHs/PLGA nanofibers with similar mass of FA.

The rapid release of FA from MgAl–FA-LDHs (Fig. 7b) could be due to the fact that the physical interaction between the FA molecule and MgAl-LDHs is weak hydrogen bonding. While, for FA/PLGA nanofibers (Fig. 7b), the rapid release of FA from the composite nanofibers could be ascribed to on the one hand the FA which is not coated on the surface of the fibers and on the other hand the weak interaction between FA and PLGA. Therefore, for both MgAl–FA-LDHs and FA/PLGA nanofibers, the phenomenon of burst release appears at the initial phase. However, for MgAl–FA-LDHs/PLGA nanofibers drug carrier, the intercalated FA drug molecules should first be dissociated from the interlays of MgAl-LDHs to the PLGA matrix, and then the free drug molecules diffuse from the solid PLGA matrix to the PBS. With the concentration of FA in the PBS increase, the diffusion impetus decreases gradually and tends to stability at last, thereby gaining a sustained release profile. The similar burst release phenomenon occurs in MgAl–FA-LDHs/PLGA nanofibers drug carrier in the initial 15 h, it could be due to the strong electrostatic interactions that makes partial FA molecules dissociate from MgAl-LDHs during the electrospinning process and the partial MgAl–FA-LDHs uncoated by PLGA matrix. This indicates that the drugs intercalated in the MgAl–FA-LDHs/PLGA nanofibers are more difficult to release than those in the FA/PLGA nanofibers and it can be concluded that MgAl-LDHs are more suitable as a controlled-release host.

4. Conclusions

In summary, FA was successfully intercalated into the MgAl-LDHs interlayers by ion-exchange method and the MgAl–FA-LDHs/PLGA nanofibers obtained via a hybrid electrospinning. The incorporation of drug-intercalated MgAl-LDHs not only significantly reduced the burst release of the drug, but also appreciably extended the released time of the drug. For MgAl–FA-LDHs/PLGA nanofibers drug system, the intercalated FA drug molecules should first be dissociated from the interlays of MgAl-LDHs to the PLGA matrix, and then the free drug molecules diffuse from the solid PLGA matrix to the PBS, which is proven to be the an efficient strategy to slow down the release rate of FA.

Acknowledgements

This research work was supported by Shanghai Major Construction Projects (11XK18BXKCZ1205), the Program of Shanghai Science and Technology Capacity Building Project Local Universities (11490501500), and the Foundation of Shanghai University of Engineering Science (E1-0501-15-0105) and the project of Shanghai universities young teacher training scheme (ZZGCD15037).

References

  1. J. Q. Shen, L. Gan, C. L. Zhu, X. X. Zhang, Y. Dong, M. Jiang, J. B. Zhu and Y. Gan, Int. J. Pharm., 2011, 412, 115–122 CrossRef CAS PubMed.
  2. Y. J. Xu, Z. M. Tan, J. W. Chen, F. F. Lou and W. Chen, Can. J. Anaesth., 2008, 55(7), 414–422 CrossRef PubMed.
  3. X. Lin, R. Q. Zhang, J. C. Xing, X. C. Gao, P. Chang and W. Z. Li, Int. J. Clin. Exp. Med., 2014, 7(12), 4887–4896 Search PubMed.
  4. L. L. Zhang, J. Zhu, L. Xu, X. L. Zhang, H. Y. Wang, Z. H. Luo, Y. M. Zhao, Y. Yu, Y. Zhang, H. W. Shi and H. G. Bao, Med. Sci. Monit., 2014, 06(20), 995–1002 Search PubMed.
  5. Y. Fujii and Y. Shiga, Clin. Ther., 2005, 27(5), 588–593 CrossRef CAS PubMed.
  6. Y. Fujii and M. Itakura, Clin. Ther., 2008, 30, 280–286 CrossRef CAS PubMed.
  7. X. Bi, H. Zhang and L. G. Dou, Pharmaceutics, 2014, 6, 298–332 CrossRef CAS PubMed.
  8. K. Zhang, Z. P. Xu, J. Lu, Z. Y. Tang, H. J. Zhao, D. A. Good and M. Q. Wei, Int. J. Mol. Sci., 2014, 15, 7409–7428 CrossRef CAS PubMed.
  9. V. Rives, M. D. Arco and C. Martín, J. Controlled Release, 2013, 169, 28–39 CrossRef CAS PubMed.
  10. F. Barahuie, M. Z. Hussein, S. Fakurazi and Z. Zainal, Int. J. Mol. Sci., 2014, 15, 7750–7786 CrossRef CAS PubMed.
  11. Z. Gu, A. C. Thomas, Z. P. Xu, J. H. Campbell and G. Q. Lu, Chem. Mater., 2008, 20, 3715–3722 CrossRef CAS.
  12. J. H. Choy, J. S. Jung, J. M. Oh, M. Park, J. Y. Jeong, Y. K. Kang and O. J. Han, Biomaterials, 2004, 25, 3059–3064 CrossRef CAS PubMed.
  13. B. X. Li, J. He, D. G. Evans and X. Duan, Appl. Clay Sci., 2004, 27, 199–207 CrossRef CAS PubMed.
  14. J. Stitzel, J. Liu, S. J. Lee, M. Komura, J. Berry, S. Soker, G. Lim, M. Van Dyke, R. Czerw, J. J. Yoo and A. Atala, Biomaterials, 2006, 27(7), 1088–1094 CrossRef CAS PubMed.
  15. G. Sui, X. Yang, F. Mei, X. Hu, G. Chen, X. Deng and S. Ryu, J. Biomed. Mater. Res., Part A, 2007, 82(2), 445–454 CrossRef PubMed.
  16. E. I. Paşcu, J. Stokes and G. B. McGuinness, Mater. Sci. Eng., C, 2013, 33, 4905–4916 CrossRef PubMed.
  17. E. Schnell, K. Klinkhammer, S. Balzer, G. Brook, D. Klee, P. Dalton and J. Mey, Biomaterials, 2007, 28(19), 3012–3025 CrossRef CAS PubMed.
  18. X. He, L. Cheng, X. M. Zhang, Q. Xiao, W. Zhang and C. H. Lu, Carbohydr. Polym., 2015, 115, 485–493 CrossRef CAS PubMed.
  19. H. Jiang, Y. Hu, P. Zhao, Y. Li and K. Zhu, J. Biomed. Mater. Res., Part B, 2006, 79(1), 50–57 CrossRef PubMed.
  20. H. Jiang, Y. Hu, Y. Li, P. Zhao, K. Zhu and W. Chen, J. Controlled Release, 2005, 108(2–3), 237–243 CrossRef CAS PubMed.
  21. N. Bolgen, I. Vargel, P. Korkusuz, Y. Z. Menceloglu and E. Piskin, J. Biomed. Mater. Res., Part B, 2007, 81(2), 530–543 CrossRef CAS PubMed.
  22. J. Xie and C. H. Wang, Pharm. Res., 2006, 23(8), 1817–1826 CrossRef CAS PubMed.
  23. T. Potrč, S. Baumgartner, R. Roškar, O. Planinšek, Z. Lavrič, J. Kristl and P. Kocbek, Eur. J. Pharm. Sci., 2015, 75, 101–113 CrossRef PubMed.
  24. R. A. Thakura, C. A. Florekb, J. Kohnb and B. B. Michniaka, Int. J. Pharm., 2008, 36, 87–93 CrossRef PubMed.
  25. G. Kim and W. D. Kim, J. Biomed. Mater. Res., Part B, 2007, 81(1), 104–110 CrossRef PubMed.
  26. T. H. Zhu, C. Y. Yang, S. H. Chen, W. Y. Li, J. Z. Lou and J. H. Wang, Mater. Lett., 2015, 150, 52–54 CrossRef CAS PubMed.
  27. T. H. Zhu, S. H. Chen, W. Y. Li, J. Z. Lou and J. H. Wang, J. Appl. Polym. Sci., 2015, 132(22), 41982 Search PubMed.
  28. S. Kannan and C. S. Swamy, J. Mater. Sci., 1992, 11, 1585–1587 CAS.
  29. J. T. Kloprogge and R. L. Frost, J. Solid State Chem., 1999, 146, 506–515 CrossRef CAS.
  30. S. Aisawa, S. Takahashi, W. Oggasawara, Y. Umetsu and E. Narita, J. Solid State Chem., 2001, 162, 52–62 CrossRef CAS.
  31. R. L. Qi, X. Y. Cao, M. W. Shen, R. Guo, J. Y. Yu and X. Y. Shi, J. Biomater. Sci., Polym. Ed., 2012, 1, 299–313 CrossRef PubMed.
  32. F. J. Liu, R. Guo, M. W. Shen, X. Y. Cao, X. M. Mo and S. Y. Wang, Soft Mater., 2010, 8, 239–253 CrossRef CAS PubMed.
  33. F. J. Liu, R. Guo, M. W. Shen, S. G. Wang and X. Y. Shi, Macromol. Mater. Eng., 2009, 294, 666–672 CrossRef CAS PubMed.
  34. E. M. Seftel, E. Popovici, E. Beyers, M. Mertens, H. Y. Zhu, E. F. Vansant and P. Cool, J. Nanosci. Nanotechnol., 2010, 10, 1–7 CrossRef PubMed.
  35. K. Nasouri, H. Bahrambeygi, A. Rabbi, A. M. Shoushtari and A. Kaflou, J. Appl. Polym. Sci., 2012, 126(1), 127–135 CrossRef CAS PubMed.
  36. F. Fredenberg, M. Wahlgren, M. Reslow and A. Axelsson, Int. J. Pharm., 2011, 415(1–2), 34–52 CrossRef PubMed.

This journal is © The Royal Society of Chemistry 2015
Click here to see how this site uses Cookies. View our privacy policy here.