Catalytic decomposition action of hollow CuFe2O4 nanospheres on RDX and FOX-7
Yu Zhangab,
Taotao Weia,
Kangzhen Xu*a,
Zhaoyu Ren*a,
Libai Xiaoc,
Jirong Songa and
Fengqi Zhaoc
aSchool of Chemical Engineering, Institute of Photonics & Photon-Technology, Northwest University, Xi'an 710069, PR China. E-mail: xukz@nwu.edu.cn; rzy@nwu.edu.cn
bCollege of Chemistry and Chemical Engineering, Xinyang normal University, Xinyang, 464000, PR China
cXi'an Modern Chemistry Research Institute, Xi'an 710065, PR China
First published on 3rd September 2015
Abstract
Two hollow CuFe2O4 nanospheres (CuFe2O4-p and CuFe2O4-d) were successfully prepared using a hydrothermal method. CuFe2O4-p has a smaller size and higher BET specific surface area compared to CuFe2O4-d. The catalytic activity of nano-CuO, nano-Fe2O3, physically mixed CuO + Fe2O3, CuFe2O4-p, and CuFe2O4-d on the thermal decomposition of RDX and FOX-7 were comparatively investigated by differential scanning calorimetry (DSC) method. The results showed that CuFe2O4-p and CuFe2O4-d exhibited higher catalytic activity than the others, and the apparent activation energies of decomposition were reduced by 37.7 and 28.4 kJ mol−1 for RDX, 40.1 and 30.5 kJ mol−1 for FOX-7, respectively. The catalytic performance of CuFe2O4-p for the decomposition of RDX and FOX-7 was superior to that of CuFe2O4-d.
1. Introduction
Cyclotrimethylenetrinitramine (RDX) and 1,1-diamino-2,2-dinitroethylene (FOX-7), known as two common oxidizers, play key roles in composite solid propellants. Their thermal decomposition characteristics directly influence the combustion behavior of solid propellants: the lower thermal decomposition temperature and apparent activation energy, the shorter the ignition delay time and the higher burning rate of the propellant.1,2 It is widely acknowledged that catalysts can accelerate the oxidizer decomposition and enhance the burning rate of the propellant.3–6Nano metal oxides exhibit high catalytic activity because of their large surface area, the high mobility of their surface atoms, and varied lattice defects.7–11 In the past decades, the thermal decompositions of RDX and FOX-7 have been extensively investigated by taking advantage of the catalytic activities of a single metal oxide and two physically mixed components. The most commonly used catalysts are transition metal oxides, such as Fe2O3,12,13 CuO,14,15 MnO2,16 and V2O3.17 As previously demonstrated, binary mixed metal oxides have better catalytic effect than a single one, because the performance of two kinds of metal oxides would be complementary and have a “synergistic effect”.18–21
Nano metal composite oxides possess specific structure-properties and higher chemical stability (acid and alkali resistance), and two types of metals can generate a “synergistic effect”.22,23 Therefore, they have been extensively studied in recent years and used in many high and new fields, such as photoelectric materials, magnetic materials and photocatalysis.24–26 Among ferrites, CuFe2O4 has a cubic close-packed arrangement of oxygen ions with Cu2+ and Fe3+ ions at two different crystallographic sites.27,28 Owing to the unique electronic configuration of its valence shell (3d10 4s1), low price, environmental benignity, and the large abundance of Cu, CuFe2O4 has attracted extensive attention and is widely applied in sensors,29,30 batteries,31,32 and catalysts.33–35 In our work, we attempt to use CuFe2O4 as burning catalyst in the special field of solid propellant, instead of single metal oxides and their physical mixtures.
In this paper, we report the preparation of two hollow CuFe2O4 nanospheres and explore its catalytic decomposition action on RDX and FOX-7 in compared with other related metal oxides.
2. Experimental
2.1 Preparation
Hollow CuFe2O4 spheres were synthesized using a hydrothermal method. We dissolved 4 mmol CuCl2·2H2O, 8 mmol FeCl3·6H2O, and 12 mmol NaAc in 70 mL ethylene glycol, following which we added 1.0 g polyvinylpyrrolidone (PVP) (denoted as CuFe2O4-p) or dodecyl trimethyl ammonium bromide (DTAB) (denoted as CuFe2O4-d) as dispersants. The mixtures were stirred vigorously for 1 h, sealed in a 100 mL Teflon-lined stainless-steel autoclave, and heated at 180 °C in air for 12 h. The resulting black solid products were collected through centrifugation and washed with ethanol and deionized water several times. All the generated samples were dried at 60 °C. Finally, the CuFe2O4-p and CuFe2O4-d samples were prepared.For comparison, nano-CuO, nano-Fe2O3 were prepared according to the methods in ref. 12 and 14, respectively. Briefly, CuCl2·2H2O (15 mmol) were dissolved in 100 mL NaOH solution (3.2 M), 100 mL H2O2 (50 wt%) was then added drop wise under constant stirring. The precipitate products were washed and dried at 110 °C. After calcined at 350 °C for 2 h, CuO sample was synthesized. For nano-Fe2O3, FeCl3·6H2O (4 mmol), urea (15 mmol), glycine (6.5 mmol), and 30 mL distilled water were added into a Teflon-lined stainless-steel autoclave (50 mL) with magnetic stirring, and then maintained at 160 °C for 10 h. Subsequently, the products were washed and dried at 60 °C. The resulting powder was used as the Fe2O3 sample. Besides, physically mixed CuO and Fe2O3 (1![[thin space (1/6-em)]](https://www.rsc.org/images/entities/char_2009.gif) :
:![[thin space (1/6-em)]](https://www.rsc.org/images/entities/char_2009.gif) 1 mol mol−1, denoted as CuO + Fe2O3) was obtained through mixing and grinding with CuO and Fe2O3 in the molar ratio of 1
1 mol mol−1, denoted as CuO + Fe2O3) was obtained through mixing and grinding with CuO and Fe2O3 in the molar ratio of 1![[thin space (1/6-em)]](https://www.rsc.org/images/entities/char_2009.gif) :
:![[thin space (1/6-em)]](https://www.rsc.org/images/entities/char_2009.gif) 1.
1.
2.2 Equipments and conditions
X-ray diffraction (XRD) patterns were acquired using a Rigarku Mini Flex 600 X-ray diffractometer with Cu Kα radiation. X-ray photoelectron spectroscopy (XPS) measurements were performed using a Thermo Scientific ESCALAB 250Xi X-ray photoelectron spectrometer. Scanning electron microscopy (SEM) images were recorded using a Zeiss SIGMA scanning electron microscope. Transmission electron microscopy (TEM) images and high-resolution TEM (HRTEM) images were obtained using an FEI Tecnai G2 microscope operated at 200 kV, and energy dispersive spectrum (EDS) mappings were acquired using an Oxford 51-XMX. N2 adsorption–desorption isotherms at 77 K were measured using an Autosorb-iQ automated gas sorption system (Quantachrome Instrument). The specific surface area was calculated according to the Brunauer–Emmett–Teller (BET) method and the pore volume was calculated based on the Barrett–Joyner–Halenda (BJH) equation.The as-prepared CuO, Fe2O3, CuO + Fe2O3, CuFe2O4-p, and CuFe2O4-d were fully mixed with RDX and FOX-7 in the molar ratio of 1![[thin space (1/6-em)]](https://www.rsc.org/images/entities/char_2009.gif) :
:![[thin space (1/6-em)]](https://www.rsc.org/images/entities/char_2009.gif) 4, and the mixtures were used as samples for DSC tests, which were performed using a 200F3 differential scanning calorimeter (Netzsch, Germany) with the following conditions: nitrogen gas purity, 99.999%; N2 flow rate, 40 mL min−1; sample mass, approximately 0.5 mg; heating rate (β), 5.0, 10.0, 15.0, and 20.0 °C min−1.
4, and the mixtures were used as samples for DSC tests, which were performed using a 200F3 differential scanning calorimeter (Netzsch, Germany) with the following conditions: nitrogen gas purity, 99.999%; N2 flow rate, 40 mL min−1; sample mass, approximately 0.5 mg; heating rate (β), 5.0, 10.0, 15.0, and 20.0 °C min−1.
3. Results and discussion
3.1 Characterization
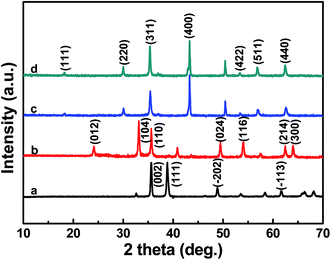
Fig. 1 shows the XRD diffraction patterns of the as-prepared samples. The patterns of Fig. 1a and b could be indexed to CuO (JCPDS file no. 45-0937) and Fe2O3 (JCPDS file no. 33-0664), respectively. It can be seen from Fig. 1c and d that almost all the diffraction peaks can be well assigned to CuFe2O4 with a cubic spinel structure (JCPDS file no. 77-0010, space group: Fd![[3 with combining macron]](https://www.rsc.org/images/entities/char_0033_0304.gif) m [227] with lattice parameters a = b = c = 8.37 Å). The diffraction peaks are at 2θ = 18.344°, 30.175°, 35.543°, 43.199°, 53.596°, 57.135° and 62.744°, which correspond to the crystal planes of (111), (220), (311), (400), (422), (511) and (440), respectively.
m [227] with lattice parameters a = b = c = 8.37 Å). The diffraction peaks are at 2θ = 18.344°, 30.175°, 35.543°, 43.199°, 53.596°, 57.135° and 62.744°, which correspond to the crystal planes of (111), (220), (311), (400), (422), (511) and (440), respectively.
The surface composition and chemical state of CuFe2O4 nanoparticle were further investigated by XPS. In the survey spectrum (Fig. 2a), the elements Cu, Fe and O can be observed clearly. The appearance of C1s peaks was mainly due to the adsorbed or bonded organic species. The O1s spectrum (Fig. 2b) can be deconvoluted into two peaks at 529.4 and 531.5 eV, which correspond to the O2− ions and –OH groups, respectively. From Fig. 2c, the main peaks at 710.9 eV and the shoulder peak at 724.6 eV can be assigned to Fe 2p3/2 and Fe 2p1/2, respectively. The accompanying satellite peaks at around 718.2 eV were indicative of the presence of Fe3+ cations. No Fe2+ peak was observed. Fig. 2d shows the binding energies of Cu 2p3/2 and Cu 2p1/2 at 933.5 and 954.2 eV respectively, with a typical satellite peak of Cu3+ at 943.3 eV. These results further confirm that CuFe2O4 has been synthesized successfully.
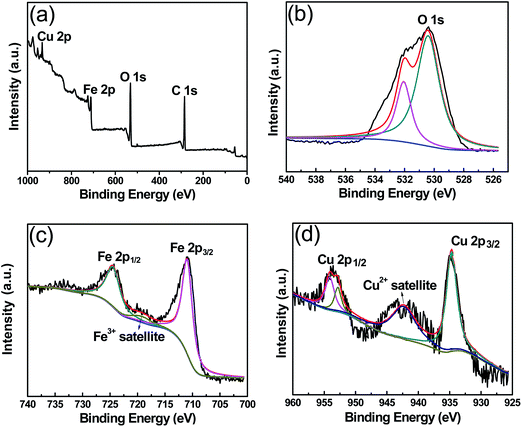 | ||
| Fig. 2 XPS characterization of CuFe2O4, (a) survey spectra, (b) O1s spectra, (c) Fe 2p spectra, and (d) Cu 2p spectra. | ||
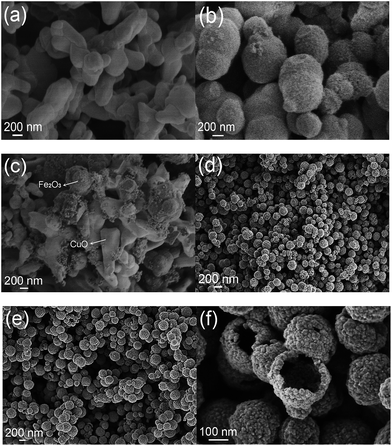
The morphology and structure of the as-prepared samples were characterized by SEM. It can be observed that the CuO sample consists of irregular blocks of sizes in the range of 400–500 nm (Fig. 3a). As shown in Fig. 3b, a large amount of Fe2O3 nanoparticles aggregate and form a well-defined spherical structure, the diameter of which is estimated as approximately 500 nm. From Fig. 3c, we can obviously found that Fe2O3 particles were dispersed on the surface of CuO samples. Owing to the limitation of physical blending, Fe2O3 and CuO were not well-mixed. Fig. 3d and e clearly show that CuFe2O4-p and CuFe2O4-d are composed of quasi-spherical particles with an average size of approximately 200 nm. The surfaces of the two CuFe2O4 spheres are rough, and the diameters are uniform. Obviously, the particle size of CuFe2O4-p is smaller than that of CuFe2O4-d. Thus, PVP is better than DTAB as the dispersant for the preparation of CuFe2O4 nanospheres. Fig. 3f displays the hollow structure of the CuFe2O4 nanosphere. The outer diameter of the hollow is approximately 200 nm and the inner diameter is about 150 nm on average. Such a hollow structure is very favourable to increase the specific surface areas and diffusion rate of reaction molecules.
The TEM images of CuFe2O4-p and CuFe2O4-d samples (Fig. 4a and b) further demonstrates their hollow nanospherical microstructure, which is consistent with the SEM results. In order to verify the crystalline structure of the CuFe2O4, we acquired the HRTEM image shown in Fig. 4c, which indicates that the CuFe2O4 nanoparticles show a well-defined lattice plane with a high degree of crystallinity. The lattice spacing of 0.248 nm corresponds to the (400) lattice planes and matches well with the value observed from the JCPDF file (no. 77-0010) of CuFe2O4. As shown in Fig. 4d, the corresponding selected-area electron diffraction (SAED) pattern indicates the polycrystalline feature of CuFe2O4 samples. EDS results (Fig. 4e) confirm the presence of Cu, Fe and O elements in CuFe2O4 nanoparticles. Atomic contents of Cu and Fe are 8.19% and 16.18% respectively, and the atomic ratio of the two elements is 1![[thin space (1/6-em)]](https://www.rsc.org/images/entities/char_2009.gif) :
:![[thin space (1/6-em)]](https://www.rsc.org/images/entities/char_2009.gif) 1.98, which is close to theoretical molar ratio of CuFe2O4.
1.98, which is close to theoretical molar ratio of CuFe2O4.
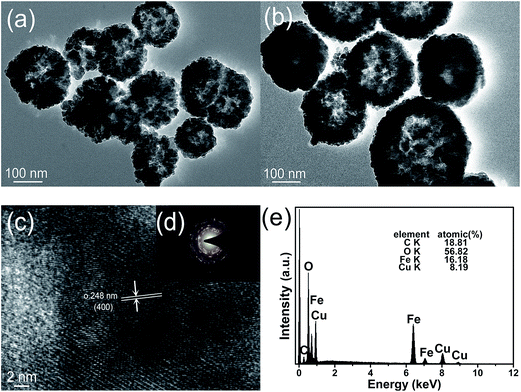 | ||
| Fig. 4 TEM images of (a) CuFe2O4-p, (b) CuFe2O4-d; HRTEM image of (c) CuFe2O4-p; SAD pattern of (d) CuFe2O4-p; EDS analysis results of (e)CuFe2O4. | ||
To evaluate the specific surface areas and porosity of the as-prepared samples, N2 adsorption–desorption isotherms were measured. The corresponding textural parameters are summarized in Table 1. The BET specific surface area of Fe2O3 is as large as that of CuFe2O4, whereas the surface areas of CuO and CuO + Fe2O3 are much lower than that of CuFe2O4. Note that the surface area of CuFe2O4-p (32.66 m2 g−1) is higher than that of CuFe2O4-d (28.97 m2 g−1). The larger specific surface area of the nanocomposite can offer more adsorption and reaction sites, leading to enhanced catalytic activity.
3.2 Influence on thermal decomposition of RDX
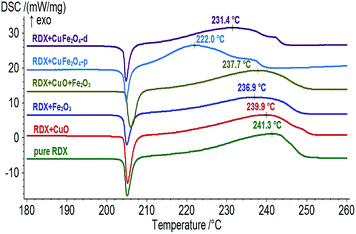
DSC results (Fig. 5) indicate that the peak temperatures of exothermic decomposition for pure RDX, RDX + CuO, RDX + Fe2O3, RDX + CuO + Fe2O3, RDX + CuFe2O4-p and RDX + CuFe2O4-d are 241.3, 239.9, 236.9, 237.7, 220.0 and 231.4 °C, respectively. Here, the effects of CuO, Fe2O3, and CuO + Fe2O3 are unconspicuous, but CuFe2O4-p and CuFe2O4-d significantly influence the decomposition of RDX. The peak shapes of RDX + CuFe2O4-p and RDX + CuFe2O4-d were also significantly different from those of other four curves. These results should be ascribed two major reasons: (1) the positive synergistic effect between Cu and Fe in CuFe2O4 nanoparticles led to higher catalytic activity than CuO and Fe2O3; (2) the hollow structure of CuFe2O4 increased its specific surface areas and improved the diffusion rate of the decomposed molecules. Furthermore, the decomposition heats of pure RDX, RDX + CuFe2O4-p and RDX + CuFe2O4-d are calculated to be about 776, 970, and 872 J g−1 respectively, indicating that CuFe2O4-p and CuFe2O4-d not only accelerated the thermal decomposition of RDX, but also increased the decomposition depth, which would be favourable to improve the burning rate of solid propellant. Obviously, CuFe2O4-p has superior catalytic performance compared to CuFe2O4-d because of its smaller particle size and larger specific surface area, which is consistent with the SEM and BET results.3.3 Influence on thermal decomposition of FOX-7
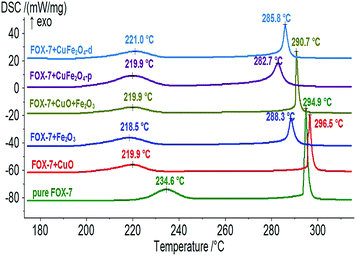
DSC results (Fig. 6) suggests that the first peak temperatures of exothermic decomposition for FOX-7 + CuO, FOX-7 + Fe2O3, FOX-7+CuO + Fe2O3, FOX-7 + CuFe2O4-p and FOX-7 + CuFe2O4-d are 219.9, 221.0, 219.9, 219.9 and 218.5 °C respectively, which are all less than that of pure FOX-7 (234.6 °C) by approximately 15 °C. However, the apparent decomposition heats for the above mixtures are 620, 632, 528, 643 and 679 J g−1 respectively, which are much larger than that of pure FOX-7 (489 J g−1). FOX-7 + CuFe2O4-p and FOX-7 + CuFe2O4-d released more heat than others. Fig. 6 shows that the second peak temperatures for FOX-7 + Fe2O3, FOX-7 + CuO + Fe2O3, FOX-7 + CuFe2O4-p, and FOX-7 + CuFe2O4-d are less than that of pure FOX-7 (294.9 °C) by 6.6, 4.2, 12.2, and 9.1 °C, respectively. However, this temperature is even higher with the addition of CuO. Therefore, CuFe2O4-p and CuFe2O4-d play better catalytic role than others on the thermal decomposition of FOX-7. The catalytic activity of CuFe2O4-p is still stronger than CuFe2O4-d on FOX-7 thermal decomposition. Between the two energetic materials, CuFe2O4-p and CuFe2O4-d show higher catalytic decomposition activity on RDX than on FOX-7.3.4 Apparent activation energy
The apparent activation energy (Ea) of the decomposition process was evaluated by Kissinger method with DSC data from different heating rates (5.0, 10.0, 15.0, and 20.0 °C min−1). The Ea values for four mixtures were obtained and listed in Table 2. We can see that the Ea values of the decomposition process for RDX + CuFe2O4-p and RDX + CuFe2O4-d are less than the literature value of pure RDX (172.6 kJ mol−1)36 by 37.7 and 28.4 kJ mol−1, respectively. The Ea values of the decomposition process for FOX-7+CuFe2O4-p and FOX-7+CuFe2O4-d are less than the literature value of pure FOX-7 (249.9 kJ mol−1)37 by 40.1 and 30.5 kJ mol−1, respectively. The reduction in the apparent activation energy is greater with CuFe2O4-p than with CuFe2O4-d, which is also ascribed to its smaller particle size and larger specific surface area. These results indicate that CuFe2O4-p and CuFe2O4-d can reduce the apparent activation energy of the decomposition process, increase the decomposition rate and show good catalytic decomposition activity.| Sample | Ea (kJ mol−1) | r |
|---|---|---|
| RDX | 172.6 | 0.982 |
| RDX + CuFe2O4-p | 134.9 | 0.998 |
| RDX + CuFe2O4-d | 144.2 | 0.991 |
| FOX-7 | 249.9 | 0.995 |
| FOX-7 + CuFe2O4-p | 209.8 | 0.984 |
| FOX-7 + CuFe2O4-d | 219.4 | 0.997 |
4. Conclusion
In summary, hollow CuFe2O4-p and CuFe2O4-d nanospheres were successfully prepared and were characterized by XRD, XPS, SEM, TEM, HRTEM, EDS and BET methods. CuFe2O4-p has smaller size and higher BET specific surface area compared to CuFe2O4-d. DSC results indicate that CuFe2O4-p and CuFe2O4-d can greatly reduce the decomposition temperature, increase the decomposition heat, and show higher catalytic decomposition activity on RDX and FOX-7 compared to CuO, Fe2O3 and CuO + Fe2O3. The Ea values of the decomposition process with the catalytic action of CuFe2O4-p and CuFe2O4-d decrease by 37.7 and 28.4 kJ mol−1 for RDX, 40.1 and 30.5 kJ mol−1 for FOX-7, respectively. The reason for the good catalytic decomposition activity of CuFe2O4 should be the active chemical nature and hollow structure. The catalytic performance of CuFe2O4-p is superior to that of CuFe2O4-d because of its smaller particle size and larger specific surface area.Acknowledgements
This investigation received financial assistance from the National Natural Science Foundation of China (21241003), Postdoctoral Science Foundation of China (2014M552480) and Postdoctoral Science Foundation of Shanxi Province.References
- R. A. Isbell and M. Q. Brewster, Propellants, Explos., Pyrotech., 1998, 23, 218–224 CrossRef CAS
.
- D. M. Badujar, M. B. Talawar, S. N. Asthana and P. P. Mahulikar, J. Hazard. Mater., 2008, 151, 289–305 CrossRef PubMed
.
- A. A. Said and R. A. Qasmi, Thermochim. Acta, 1996, 275, 83–91 CrossRef CAS
.
- D. V. Survase, M. Gupta and S. N. Asthana, Prog. Cryst. Growth Charact., 2002, 45, 161–165 CrossRef CAS
.
- W. F. Chen, F. S. Li, J. X. Liu, H. C. Song and J. Y. Yu, Chin. J. Catal., 2005, 26, 1073–1077 CAS
.
- Y. P. Tong, Y. P. Wang, Z. X. Yu, X. Wang, X. J. Yang and L. D. Lu, Mater. Lett., 2008, 62, 889–891 CrossRef CAS PubMed
.
- K. Faungnawakij, R. Kikuchi, T. Fukunaga and K. Eguchi, Appl. Catal., A, 2007, 333, 114–121 CrossRef CAS PubMed
.
- Z. Z. Pei and Y. Zhang, Mater. Lett., 2008, 62, 504–506 CrossRef CAS PubMed
.
- T. X. Liu, B. X. Li, Y. G. Hao and Z. Y. Yao, Chem. Eng. J., 2014, 244, 382–390 CrossRef CAS PubMed
.
- P. K. Seon, U. L. Dong and K. K. Eun, Curr. Appl. Phys., 2010, 10, S478–S480 CrossRef PubMed
.
- P. Ujwol, K. Henning, N. Rodrigo, A. Sahar, J. Vladislav, M. Philipp, A. Hasan, S. Alberto, S. Helmut and K. Dietmar, Nano Energy, 2014, 6, 167–172 CrossRef PubMed
.
- E. Alizadeh-Gheshlaghi, B. Shaabani, A. Khodayari, Y. Azizian-Kalandaragh and R. Rahimi, Powder Technol., 2012, 217, 330–339 CrossRef CAS PubMed
.
- Y. Yuan, J. Wei, Y. J. Wang, P. Shen, F. S. Li, P. Y. Li, F. Q. Zhao and H. X. Gao, Appl. Surf. Sci., 2014, 3039, 354–359 CrossRef PubMed
.
- N. N. Zhao, C. C. He, J. B. Liu, H. J. Gong, T. An, H. X. Xu, F. Q. Zhao, R. Z. Hu, H. X. Ma and J. Z. Zhang, J. Solid State Chem., 2014, 219, 67–73 CrossRef CAS PubMed
.
- X. D. Zheng, P. Li, S. L. Zheng and Y. Zhang, Powder Technol., 2014, 268, 446–451 CrossRef CAS PubMed
.
- I. P. S. Kapoor, P. Srivastava and G. Singh, Propellants, Explos., Pyrotech., 2009, 34, 351–356 CrossRef CAS PubMed
.
- Y. F. Zhang, N. N. Wang, Y. T. Huang, W. B. Wu, C. Huang and C. G. Meng, Ceram. Int., 2014, 40, 11393–11398 CrossRef CAS PubMed
.
- W. J. Zhang, P. Li, H. B. Xu, R. D. Sun, P. H. Qing and Y. Zhang, J. Hazard. Mater., 2014, 268, 273–280 CrossRef CAS PubMed
.
- L. L. Liu, F. S. Li, L. H. Tan, M. Li and Y. Yang, Propellants, Explos., Pyrotech., 2004, 29, 34–38 CrossRef CAS PubMed
.
- Y. P. Wang, X. J. Yang, L. D. Lu and X. Wang, Thermochim. Acta, 2006, 443, 234–239 Search PubMed
.
- T. Liu, L. S. Wang, P. Yang and B. Y. Hu, Mater. Lett., 2008, 62, 4056–4058 CrossRef CAS PubMed
.
- G. Singh, I. P. S. Kapoor and S. Dubey, J. Alloys Compd., 2009, 480, 270–274 CrossRef CAS PubMed
.
- Y. Sharma, N. Sharma, G. V. Subba Rao and B. V. R. Chowdari, Adv. Funct. Mater., 2007, 17, 2855–2861 CrossRef CAS PubMed
.
- R. Q. Wan, C. H. Jia and W. F. Zhang, J. Alloys. Compd., 2012, 544, 1–5 CrossRef CAS PubMed
.
- A. Singh, V. Singh and K. K. Bamzai, Mater. Chem. Phys., 2015, 155, 92–98 CrossRef CAS PubMed
.
- Y. M. Liu, Z. J. Li, H. Lv, H. B. Tang and X. Y. Xing, Mater. Lett., 2013, 108, 84–87 CrossRef CAS PubMed
.
- Z. T. Zhang, A. J. Rondinone, J. X. Ma, J. Shen and S. Dai, Adv. Mater., 2005, 17, 1415–1419 CrossRef CAS PubMed
.
- W. Ponhan and S. Maensiri, Solid State Sci., 2009, 11, 479–484 CrossRef CAS PubMed
.
- Z. P. Sun, L. Liu, D. Z. Jia and W. Y. Pan, Sens. Actuators, B, 2007, 125, 144–148 CrossRef CAS PubMed
.
- L. Su, W. J. Qin, H. G. Zhang, Z. U. Rahman, C. L. Ren, S. D. Ma and X. G. Chen, Biosens. Bioelectron., 2015, 63, 384–391 CrossRef CAS PubMed
.
- L. Luo, R. R. Cui, H. Qiao, K. Chen, Y. Q. Fei, D. W. Li, Z. Y. Pang, K. Liu and Q. F. Wei, Electrochim. Acta, 2014, 144, 85–91 CrossRef CAS PubMed
.
- X. H. Wu, W. W. Wu, Y. N. Li, F. Li and S. Liao, Mater. Lett., 2015, 138, 192–195 CrossRef CAS PubMed
.
- Y. B. Ding, L. H. Zhu, N. Wang and H. Q. Tang, Appl. Catal., B, 2013, 129, 153–162 CrossRef CAS PubMed
.
- N. Shimoda, H. Muroyama, T. Matsui, K. Faungnawakij, R. Kikuchi and K. Eguchi, Appl. Catal., A, 2011, 409–410, 91–98 CrossRef CAS PubMed
.
- A. Kezzima, N. Nasrallaha, A. Abdi and M. Trari, Energy Convers. Manage., 2011, 52, 2800–2806 CrossRef PubMed
.
- X. P. Fan, X. Wang, Z. R. Liu and H. M. Tan, Energ. Mater., 2005, 13, 284–287 CAS
, in Chinese.
- Q. B. Fu, Y. J. Shu, Y. G. Huang and J. H. Zhou, Journal of Sichuan Ordnance, 2009, 30, 15–17 Search PubMed
, in Chinese.
| This journal is © The Royal Society of Chemistry 2015 |

