
Systematic development of novel cationic self-nanoemulsifying drug delivery systems of candesartan cilexetil with enhanced biopharmaceutical performance†
Gajanand Sharmaa,
Sarwar Bega,
Kaushik Thankib,
O. P. Katarea,
Sanyog Jain*b,
Kanchan Kohlic and
Bhupinder Singh*ad
aUniversity Institute of Pharmaceutical Sciences, UGC Centre of Advanced Studies, Panjab University, Chandigarh, India 160 014. E-mail: bsbhoop@yahoo.com; bsbhoop@pu.ac.in; Fax: +91 172 2543101; Tel: +91 172 2534103
bCentre for Pharmaceutical Nanotechnology, National Institute of Pharmaceutical Education and Research (NIPER), Sector 67, S.A.S. Nagar, Mohali, Punjab, India 160 062. E-mail: sanyogjain@niper.ac.in; sanyogjain@rediffmail.com; Tel: +91 172 2214684
cDepartment of Pharmaceutics, Faculty of Pharmacy, Hamdard University, New Delhi, India 110 062
dUGC-Centre of Excellence in Nano Applications (Biomedical Sciences), Panjab University, Chandigarh, India 160 014
First published on 14th August 2015
Abstract
The current studies entail systematic development, optimization and evaluation of cationic self-nanoemulsifying drug delivery systems (C-SNEDDS) for enhancing the oral bioavailability of candesartan cilexetil. Preformulation studies including equilibrium solubility studies and phase titration studies facilitated the selection of Lauroglycol 90 (i.e., lipid), Tween 40 (i.e., emulgent) and Transcutol HP (i.e., cosolvent), while oleylamine was used as a cationic charge inducer. D-optimal mixture design was employed for systematic optimization of C-SNEDDS, evaluating them for globule size, zeta potential, in vitro drug release and dissolution efficiency. Mathematical modeling was carried out and optimized formulation was identified through numerical optimization desirability function. Evaluation of the cellular uptake and permeability in Caco-2 cells revealed 2.2-fold increase in apparent permeability (Papp) and 6.4-fold reduction in the P-gp efflux ratio of the candesartan cilexetil from C-SNEDDS vis-à-vis the free drug solution. Nearly 5 to 6-fold enhancement in oral bioavailability was observed with the optimized C-SNEDDS vis-à-vis the plain SNEDDS and free drug solution using in situ single pass intestinal perfusion and in vivo pharmacokinetic studies, both conducted in Wistar rats. Establishment of various levels of in vitro/in vivo correlations (IVIVC) for the developed C-SNEDDS corroborated excellent goodness of fit between the in vitro drug release data with the in vivo absorption parameters. Evaluation of the cytotoxicity of C-SNEDDS by histopathological examination of rat intestine and MTT assay revealed high safety and efficacy of the developed formulations. Overall, the present studies report the successful development of novel C-SNEDDS of candesartan cilexetil with distinctly improved biopharmaceutical performance.
1. Introduction
Candesartan cilexetil is popularly recommended for the treatment and management of hypertension.1,2 However, its therapeutic efficacy gets markedly reduced owing to low oral bioavailability as a function of poor solubility, extensive hepatic first-pass effect and high P-glycoprotein (P-gp) efflux.3,4 Several formulation strategies including solid dispersions,5 cosolvates,6 inclusion complexes7 and nanosuspensions8 have been undertaken to enhance the oral bioavailability of candesartan cilexetil. However, none of these formulations are found to be highly effective to address the low oral bioavailability issues, as these tend to deal with the poor solubility issue only. Lately, self-nanoemulsifying drug delivery systems (SNEDDS) have been extensively investigated for augmenting the oral absorption of highly lipophilic drugs owing to their inherent potential to improve drug solubility and permeability, and eventually its oral bioavailability.9,10Multiple factors tend to influence the oral bioavailability of drugs from SNEDDS, such as nature and type of lipids, surfactants and co-solvents, chain length of lipids and surfactants, surface charge, etc.10 Several innovations have been made for developing the specialized self-emulsifying formulations for improving the biopharmaceutical performance of drugs.11 Cationic SNEDDS (C-SNEDDS) in this context has been reported to possess remarkably superior bioavailability enhancement potential as compared to the plain SNEDDS, owing to the positively charged nature of the emulsion globules attributed by charge inducers like oleylamine or stearylamine.12 This facilitates permeability and absorption of drugs across the intestinal pathways leading to manifold augmentation in the bioavailability.12,13
The literature reports only one study on the use of conventional SNEDDS in improving its in vitro drug release performance, without documenting any results on the in vivo studies on potential oral bioavailability improvement.14 Attempts, therefore, have been made for systematic development of novel C-SNEDDS of candesartan cilexetil for enhancing its oral bioavailability, followed by comparison of the biopharmaceutical performance with conventional SNEDDS through in vitro, in situ and in vivo studies.
2. Materials and methods
2.1 Materials
Candesartan cilexetil was provided ex-gratis by Alembic Laboratories Ltd, Baroda, India. Various lipids like Lauroglycol™ 90, Lauroglycol™ FCC, Maisine™ 35-1 and Transcutol® HP were received as gift samples from Gattefosse, Saint-Priest, France. Capmul MCM®, Captex® 200 and Capmul® PG 8 were procured from Abitec Corp., Ohio, USA. Ethyl oleate, olive oil, sesame oil, palmitic acid, stearic acid, oleic acid and potassium dihydrogen phosphate were purchased from S.D. Fine Chem, Mumbai, India, while methanol and acetonitrile of HPLC grade were purchased from Merck and Co., Mumbai, India. The surfactants like Tween 20, Tween 40 and Tween 80 were purchased from Himedia, Mumbai, India. All other materials employed during the studies were of analytical grade and were used as such as obtained.2.2 Methods
![[thin space (1/6-em)]](https://www.rsc.org/images/entities/char_2009.gif) :1, 1:2, 2:1, 1:3 and 3:1 were prepared as per the HLB method to fulfill the requirement between 12 and 14 for formation of oil-in-water emulsion, and mixed with the lipid phase in the range of 1:9 and 9:1.16 The mixtures were titrated with water to delineate the boundaries of nanoemulsion region in the pseudoternary phase diagrams. The Smix ratio with optimal nanoemulsion region was selected for formulation development.
:1, 1:2, 2:1, 1:3 and 3:1 were prepared as per the HLB method to fulfill the requirement between 12 and 14 for formation of oil-in-water emulsion, and mixed with the lipid phase in the range of 1:9 and 9:1.16 The mixtures were titrated with water to delineate the boundaries of nanoemulsion region in the pseudoternary phase diagrams. The Smix ratio with optimal nanoemulsion region was selected for formulation development.2.2.4.1 Self-emulsification efficiency, globule size and zeta potential. Aliquots (1 g of each) of the C-SNEDDS were diluted in 250 mL of simulated gastric fluid (SGF, pH 1.2) under continuous stirring condition (50 rpm) in a USP XXXI Apparatus II (DS 8000, Labindia Instruments, Mumbai, India) at 37 ± 0.5 °C. The time required for complete dispersion of the C-SNEDDS was noted as self-emulsification time. Further, the samples obtained after dispersion were subjected for globule size analysis, zeta potential measurement by Zetasizer 2000 HS (Malvern Instruments, Worcestershire, UK), and visual observation under transmission electron microscope (JEM-2100 F, Jeol, Tokyo, Japan).
2.2.4.2 In vitro drug release. In vitro drug release studies were carried out by dialysis bag method on the C-SNEDDS employing 250 mL of SGF (pH 1.2) containing 0.5% sodium laurly sulfate at 50 rpm and 37 ± 0.5 °C for 2 h. Aliquots (2 mL) of the medium were withdrawn periodically at suitable time intervals and replenished with an equal volume of fresh dissolution medium. The samples were suitably diluted and analyzed by HPLC to calculate the percent drug release with respect to time.18,19 Analogously, the drug release studies were carried out for the plain SNEDDS, free drug solution and marketed formulation (Candesar®, Ranbaxy Lab Ltd, Gurgaon, India) for comparative evaluation of the drug release characteristics. The raw data obtained from dissolution studies were analyzed using in-house ZOREL software with in-built provision for applying the correction factor for volume and drug losses during sampling (eqn (1))
 | (1) |
Further, the dissolution efficiency was calculated for each type of formulation employing the formula given in eqn (2) as follows:
 | (2) |
 | (3) |
 | (4) |
2.2.5.1 Culture of Caco-2 cells. Caco-2 cells (ATCC, Manassas, VA, USA) were grown in the tissue culture flasks (75 cm2), and maintained under simulated atmospheric conditions, i.e., 5% CO2 at 37 °C. The growth medium comprised of Dulbecco's Modified Eagle's culture medium (DMEM), 20% fetal bovine serum (FBS), 100 IU mL−1 of penicillin and 100 μg mL−1 of streptomycin. The pH of media was maintained at 7.4 with 0.1 N NaOH with presence of phenol red as pH change indicator. Proper care and maintenance of the cells were up to 21 days until their full growth followed by regular measurement of transepithelial electrical resistance (TEER) with the help of Millicell-ERS device (M s−1 Millipore Corporation, Darmstadt, Germany) to check the cell death, if any. The growth medium was changed on every alternate day with the fresh medium for providing optimum nutrients to the cells. The culture cells were trypsinized employing 0.25% Trypsin-EDTA solution (M s−1 Sigma Aldrich, St. Louis, USA), once 90% confluent. The harvested cells were then used for the subsequent studies.
2.2.5.2 Cytotoxicity. The cytotoxicity studies were carried out by MTT assay on the Caco-2 cells as per the literature reports.20,21 The cells were seeded in a 96-well plate at a density of 5 × 10⁴ cells per well and incubated for 24 h. The positive control (Triton-X 100), and test formulations like free drug solution, SNEDDS and C-SNEDDS containing 1% w/w oleylamine were added to the culture plates containing cells in the concentration of 1, 2, 5 and 10 μg mL−1. After incubation for 3 h, the culture medium containing the formulations was aspirated and cells were washed with pH 7.4 phosphate buffer saline (PBS).17,22 Subsequently, 150 μL of MTT solution (500 mg mL−1 in PBS) was added to each well plate and incubated at 37 °C for additional 4 h. The supernatant was removed and 200 μL of dimethylsulfoxide was added to solubilize the formazan crystals and optical density of resulting solution was measured at 540 nm using ELISA microplate reader (M s−1 BioTek, Vermont, USA). Based on the results of optical density, the percent cell viability was calculated using eqn (5).
 | (5) |
Cellular toxicity was also evaluated by measuring the TEER values as a function of integrity of monolayer cells after treatment with various developed formulations for a period of 12 h. TEER was measured using a Millicell-ERS device (M s−1 Millipore Corporation, Darmstadt, Germany) and chopstick style electrodes. Initially, after 3 h of incubation with various treatment formulations and Triton X-100, the cells were washed with PBS except the control. The TEER was reported in % by calculating the net change with respect to the initial value.
2.2.5.3 Uptake. The qualitative uptake studies were carried out by seeding 100
000 cells per well in tissue culture well plates.23,24 The qualitative uptake was measured for free coumarin-6, SNEDDS and C-SNEDDS with 1 mg mL−1 concentration of candesartan cilexetil and 100 μg of coumarin-6. After 1 h incubation period, the cells were washed twice with PBS and observed under the Confocal Laser Scanning Microscope (CLSM) (Olympus FV1000, Philadelphia, USA). The qualitative uptake was reported as a function of the fluorescence intensity of the dye from the cells treated with both SNEDDS and CSNEDDS, respectively.
2.2.5.4 Permeability. The permeability and P-gp efflux inhibition potential of the SNEDDS and C-SNEDDS was assessed by performing bidirectional permeability studies.25 Transport studies from apical to basolateral (A → B) direction were initiated by adding 250 μg of the test formulation to the transport medium in apical side and blank transport medium (2.6 mL) to the basolateral side. The transport studies were also conducted in reverse direction, i.e., basolateral to apical (B → A) side to determine the P-gp inhibitory effect. Aliquot samples (200 μL) were withdrawn both from apical and basolateral side during each assay experiments at periodic time intervals, i.e., 0, 30, 45 and 60 minutes, and replaced with the blank transport medium each time. The samples collected at each time points were analyzed by HPLC and cumulative amount of drug permeated was plotted as a function of time for calculating the apparent permeability (Papp) as per the eqn (6).
 | (6) |
 | (7) |
The values of ER > 1 indicated high P-gp efflux activity of the drug, while ER < 1 was considered as the low P-gp efflux activity of the drug.
2.2.6.1 Procurement and maintenance of animals. All the studies involving animal experiments were carried out in accordance with the experimental protocols approved by Institutional Animal Ethics Committee of the Panjab University, Chandigarh, India. Wistar rats of either sex (200-250 g) were housed in polypropylene cages under standard laboratory conditions at 25 ± 2 °C and 55 ± 5% RH with free access to standard diet and water ad libitum.
2.2.6.2 Intestinal perfusion and toxicity. Intestinal perfusion studies were carried out in Wistar rats on the SNEDDS, C-SNEDDS and free drug solution, as per the protocol described in our previous literature reports.26–28 The animals were anesthetized using intraperitoneal injection of thiopental sodium in the dose of 50 mg kg−1. The abdomen was opened with a midline incision and the entire small intestine was taken out carefully. The intestinal segment was perfused with Kreb-Ringer buffer maintained at 37 ± 1 °C until the perfusate was clear. The intestine was then perfused with SNEDDS, C-SNEDDS and free drug solution containing 16 mg of candesartan cilexetil at a rate of 0.2–0.3 mL min−1.29,30 At specified time intervals, i.e., 5, 15, 30 and 45 minutes, the perfusates were collected and analyzed by HPLC for calculation of the permeability and absorption parameters like effective permeability (Peff), wall permeability (Pwall), fraction absorbed (F) and absorption number (An). At the end of perfusion experiment, the intestinal segments were subjected for histopathological studies for evaluating the integrity of epithelial cells and presence of inflammation, if any.
2.2.6.3 In vivo pharmacokinetics.
2.2.6.3.1 Study design. The animals were randomly distributed into three groups (i.e., Group A, B and C), with six rats in each group. The animals in Group A were orally administered with free drug solution, while Group B and C animals received optimized plain SNEDDS and C-SNEDDS containing candesartan cilexetil equivalent to 16 mg kg−1 body weight of rats. All the formulations were orally administered to each group of rats with the help of an oral cannula. The free drug solution was administered by suspending in 1 mL of 0.5% solution of sodium carboxymethylcellulose in distilled water, while the treatment formulations were administered directly without any dilutions. Following drug administration, rats were kept in cages with free access to water after 6 h, and were provided free access to food after 12 h. Serial blood samples (0.2 mL aliquots) were withdrawn from the retro orbital plexus at specific time points like, 0.5, 1, 2, 3, 6, 8, 12, 18, 24, 36, 48 and 60 h post-dosing and placed in tubes containing heparin solution. Plasma was separated by centrifugation at 10
000 rpm (5590 × g) for 15 min, and stored at −20 °C until analyzed. Before analysis, the plasma was thawed at room temperature and diethyl ether (1 mL) was added to all the tubes followed by vortex mixing for 30 s. The upper organic phase was transferred to another set of clean glass tubes and evaporated to dryness on a water bath maintained at 50 °C. The remaining dry residues of the analyte was reconstituted with 0.5 mL of methanol and injected into HPLC for analysis.
2.2.6.3.2 HPLC analysis of candesartan cilexetil. Analysis of candesartan cilexetil in plasma samples was carried out employing an in-house developed and validated reverse phase high performance liquid chromatography (RP-HPLC) method. The liquid chromatographic system consisted of main system (Waters® Alliance 2695, Waters, Massachusetts, USA) with PDA detector (model 2996), connected to a desktop consisting software (Empower™ Version 2.0). The chromatographic separation was accomplished on a reverse phase Thermo Hypersil-Keystone (Thermo Scientific, Massachusetts, USA) C18 column (250 mm × 4.6 mm × 5 μm), with 10 mM potassium dihydrogenphosphate
:methanol:acetonitrile in the ratio of 2:80:18 with pH 2.5 and column oven temperature at 30 °C. The flow rate was fixed at 1.0 mL min−1 and analysis was carried out at 254 nm. The developed method was suitably validated with respect to the analytical attributes like, linearity, accuracy, precision, selectivity, robustness, limit of detection (LOD) and limit of quantification (LOQ). For bioanalytical method development, the linear calibration plot of the drug was constructed by spiking the known concentration of the drug ranging between 10 and 500 ng mL−1 in rat plasma. Extraction of the drug was carried out from plasma by allowing precipitation of the plasma from acetonitrile followed by centrifugation at 10000 rpm. The organic fraction was allowed to evaporate followed by reconstitution of the drug in mobile phase and analyzed using the developed HPLC method.
2.2.6.3.3 Pharmacokinetic data analysis. Computer-based pharmacokinetic data analyses and modeling on plasma concentration-time data were carried out using Win-Nonlin Version 5.0 (Pharsight, California, USA) employing Model 3 for Wagner–Nelson method for one-compartment body model (1-CBM) with zero lag-time for peroral administration. Various pharmacokinetic parameters like the maximum observed plasma concentration during the study period (Cmax) and the corresponding time to reach the same (tmax), area under the curve (AUC), Cmax/AUC ratio and absorption rate constant (Ka) were computed using the selected model and their statistical validity was ratified on the basis of minimization of various model fitness parameters like Akaike information criterion (AIC), Schwartz criterion (SC), sum of squares of residuals (SSR) and maximization of Pearsonian correlation (R).
3. Results
3.1 Equilibrium solubility studies and construction of phase diagrams
Solubility studies showed maximum solubilized fraction of candesartan cilexetil in Lauroglycol 90 (56.9 mg mL−1), Tween 40 (109.5 mg mL−1) and Transcutol HP (210.4 mg mL−1). The detail data on equilibrium solubility of candesartan cilexetil is enlisted in ESI Fig. 1A and B.† Based on the excipients with higher solubility, the phase titration studies were carried out to construct the pseudoternary phase diagrams, which showed different nanoemulsion region at studied Smix ratios, i.e., 1:1, 1:2, 2:1 and 3:1, respectively (Fig. 1). Maximal region for nanoemulsion was observed at ratio 1:2. Further, increasing the amount of surfactant (i.e. Tween 40) in the ratios 2:1 and 3:1, a gradual decrease in nanoemulsion region was observed.27 However, increasing the amount of cosolvent (i.e., Transcutol HP in the ratio 1:2), increase in nanoemulsion region was observed. Thus, the ratio 1:2 was finally selected for formulation development studies.
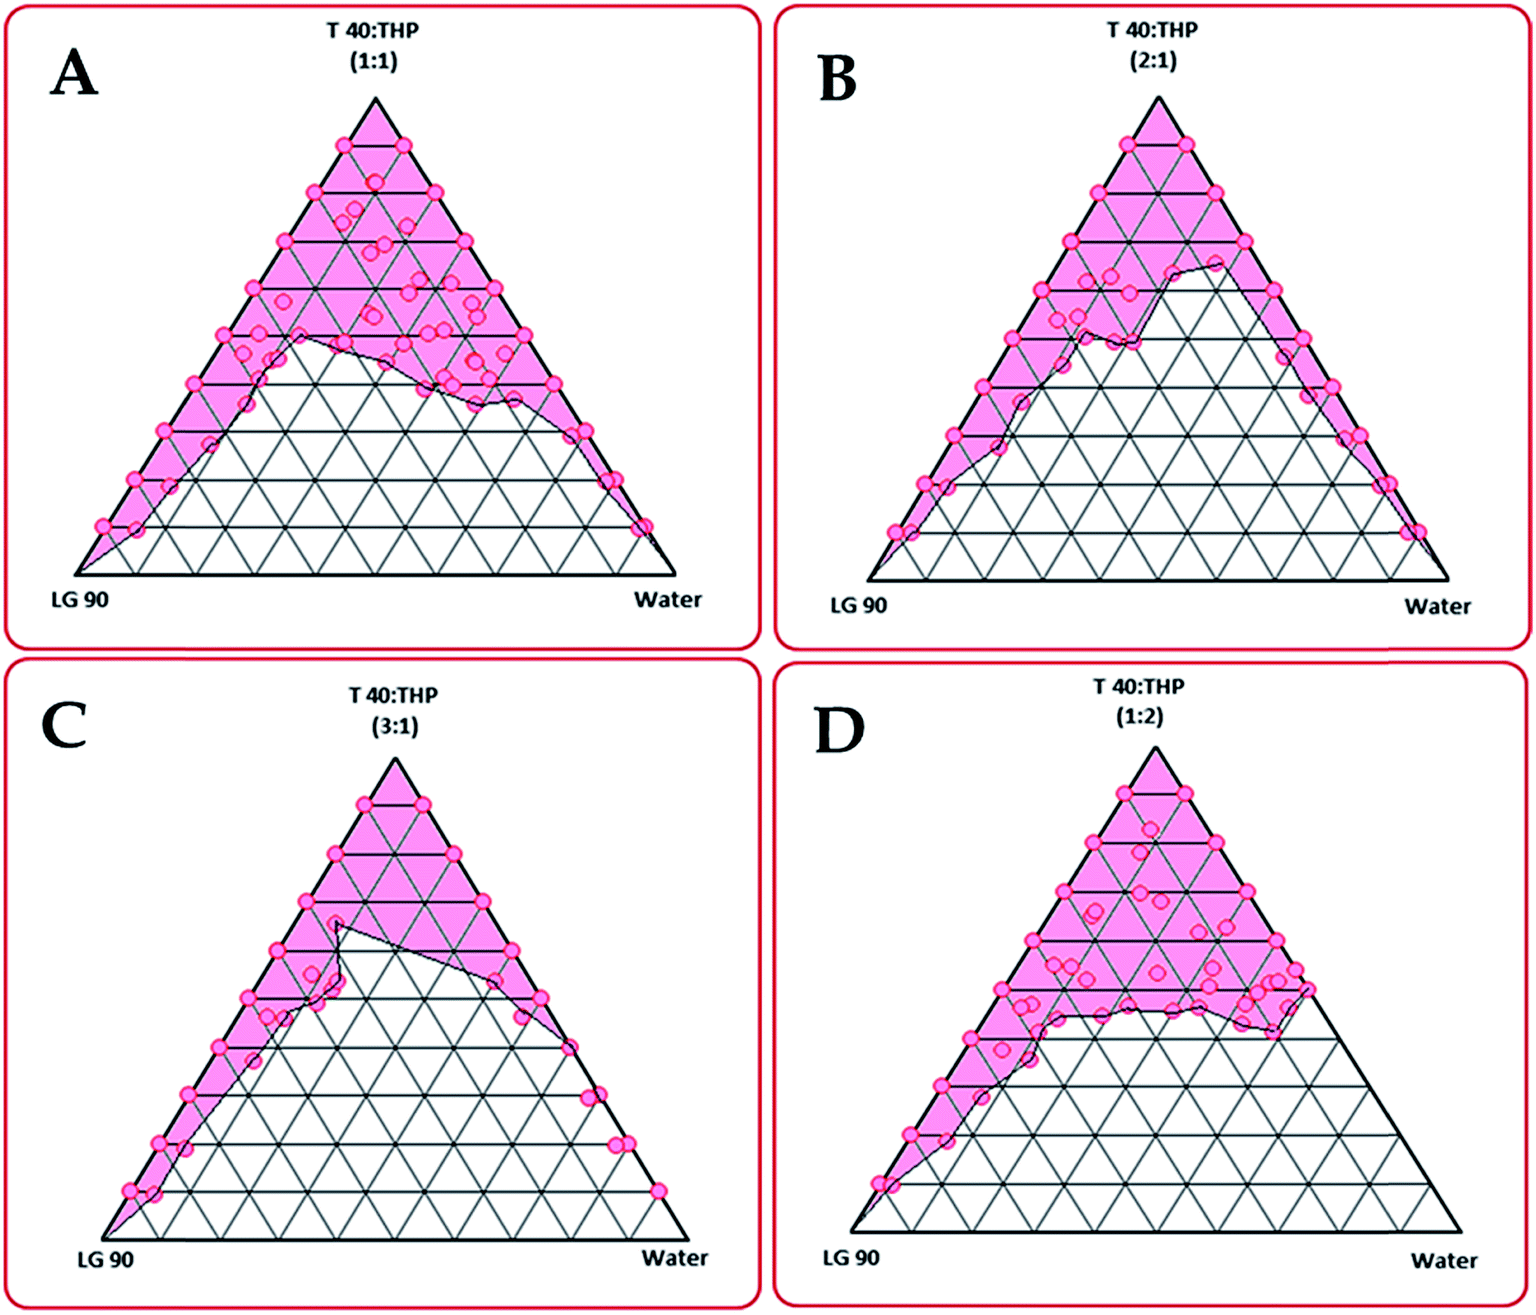 | ||
| Fig. 1 Phase behaviour of nanoemulsion/microemulsion formed from Lauroglycol 90, Tween40: Transcutol HP and water in the (A) 1:1, (B) 2:1, (C) 3:1, and (D) 1:2 ratios. | ||
3.2 Optimization of the C-SNEDDS
Optimization data analysis was carried out for development of second-order quadratic model by MLRA method. The coefficients of polynomial equations generated for the response variables showed excellent goodness of fit of the experimental data with the selected model, as observed from significant model p-value (<0.01), higher values of r2 (ranging between 0.955 and 0.998), insignificant lack of fit and lower values of PRESS. Fig. 2A portrays the 2D-contour plot for the globule size, which exhibit an increasing trend with increase in the levels of Lauroglycol 90, and a declining pattern with increase in the levels of Tween 40 and Transcutol HP, respectively. This signified the prominent influence of the levels of lipid and surfactant on the globule size. Likewise, the 2D-contour plot depicted in Fig. 2B revealed a linear escalation in the values of DE30min with increase in the levels of Tween 40 and Transcutol HP, respectively. On the contrary, a descending pattern was observed with Lauroglycol 90. Overall, the lowest globule size and higher values of DE30min was observed at low levels of Lauroglycol 90 and Transcutol HP, and intermediate levels of Tween 40, respectively. | ||
| Fig. 2 2D-contour plots showing the influence of Lauroglycol 90, Tween 40 and Transcutol HP on (A) globule size, (B) DE30min for C-SNEDDS, (C) design space overlay plot depicting the optimal region. | ||
3.3 Search for optimum formulation and validation studies
The search for optimum formulation was carried out by “trading-off” various responses through desirability function to attain the desired goals, i.e., minimization of globule size and maximization of DE30min, both indicative of faster solubilization and drug release characteristics. Fig. 2C portrays the design space depicting the optimized C-SNEDDS containing Lauroglycol 90 (126 mg), Tween 40 (468 mg) and Transcutol HP (406 mg), which correspond to the self-emulsification time less than 1 min, globule size 59 nm and DE30min > 80%, respectively. The globule size distribution profile (Fig. 3) and TEM images of the optimized C-SNEDDS and SNEDDS confirmed nanostructured nature of the formulation (Fig. 4). The zeta potential measurement showed optimized C-SNEDDS with highly positive value of 27.1 mV, while the plain SNEDDS showed zeta potential of −14.8 mV, thus confirming the cationic nature of the prepared formulation.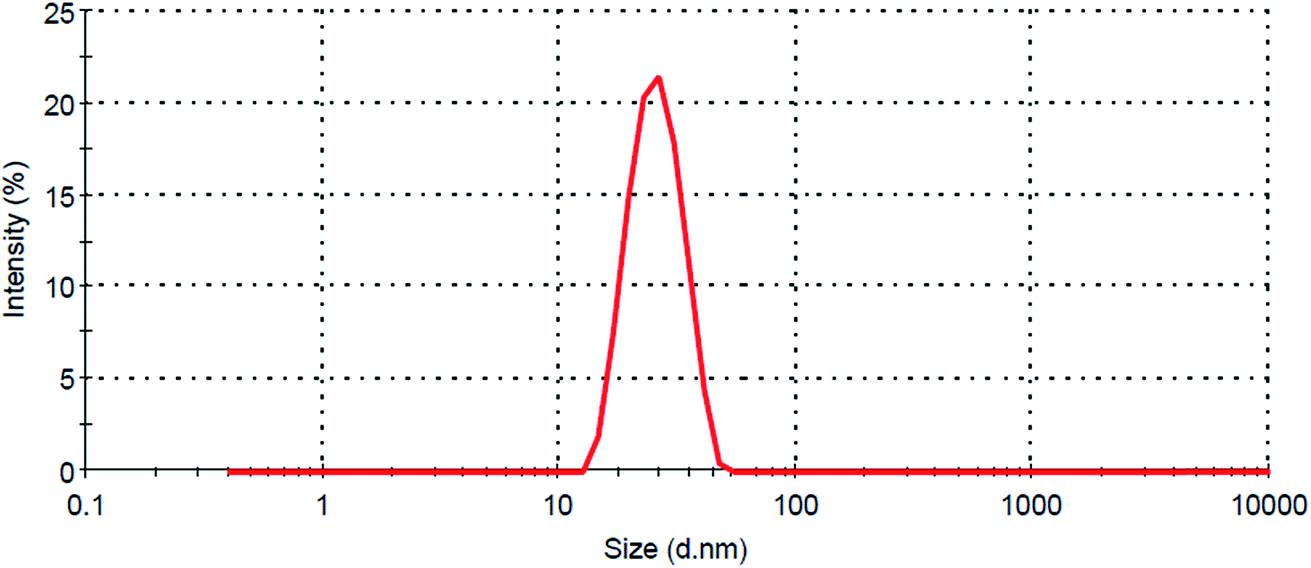 | ||
| Fig. 3 Cumulative drug release profile of candesartan from optimized C-SNEDDS, SNEDDS, free drug solution and marketed formulation. | ||
 | ||
| Fig. 4 Mean globule size distribution of the optimized C-SNEDDS formulation. | ||
In vitro evaluation of drug release indicated more than 85% release in 15 minutes followed by almost complete drug release within 30 min by C-SNEDDS (Fig. 5). The faster drug release characteristic of the C-SNEDDS was further confirmed from DE30min value more than 85%. Like C-SNEDDS, the plain SNEDDS also demonstrated an analogous drug release profile with 67% release in 15 min and more than 85% release in 30 min with DE30min value > 80%. However, the free drug solution and marketed formulation construed only 32% and 36% release in 15 min, followed by a maximum 42% and 56% drug release in 30 min, respectively. Nearly 1.8 to 2.2-fold improvement in the drug release rate was exhibited by SNEDDS and C-SNEDDS vis-à-vis the marketed formulation and free drug solution, thus indicating superior drug solubilization potential of the developed formulations. Further, comparative evaluation of the drug release profile by calculating dissimilarity factor (f1) revealed highly significant difference in the dissolution profiles for the SNEDDS (f1: 49.3) and C-SNEDDS (f1: 49.7) with respect to the marketed formulation. Analogously, calculation of similarity factor (f2) also construed lack of any similarity between the dissolution profiles of SNEDDS (f2: 32.3) and C-SNEDDS (f2: 31.4) with the dissolution profile of marketed formulation, respectively. Overall, both the f1 and f2 values showed presence of significant differences in the dissolution profiles of prepared SNEDDS and C-SNEDDS vis-à-vis the marketed formulation.
 | ||
| Fig. 5 TEM images of the optimized SNEDDS (A) and C-SNEDDS formulation (B). | ||
After characterization of the optimized formulation, validation studies of the optimization methodology carried out by preparing check-point formulations indicated high degree of prognostic ability and unambiguous accuracy of the selected experimental design for the purpose, as is evident from close proximity between the predicted and observed values of the responses with “r” ranging between 0.955 and 0.998.
3.4 Caco-2 cell culture experiments
 | ||
| Fig. 6 (A) CLSM image of Caco-2 cells incubated with (A) free dye, (B) SNEDDS and (C) C-SNEDDS formulations; (B) in vitro cytotoxicity studies; (C) directional permeation of various treatment formulations. | ||
For evaluating the P-gp efflux activity, ER was calculated from the bidirectional transport of drug from A → B and B → A. This revealed ER value > 1 in case of free drug solution at all the studied concentrations, thus confirming significant efflux of the drug plausibly owing to the presence of P-gp transporters. On the contrary, the values of ER < 1 for both the SNEDDS and C-SNEDDS showed reduced cellular permeability of the drug through cell monolayer ostensibly due to the significant reduction in the efflux mechanism. The comparison of ER values obtained after incubation of cells after 3 h with SNEDDS and C-SNEDDS revealed 2.4- and 6.4-fold reduction in the efflux of drug from B → A vis-à-vis the free drug solution. Besides, the C-SNEDDS was found to be superior over the SNEDDS and revealed nearly 2.7-fold reduction in the value of ER. The studies ratify the superior permeability and P-gp efflux inhibition potential of the developed formulations ostensibly owing to the presence of lipidic and emulsifying excipients, which was found to be in consonance with the literature reports.32,33
3.5 Intestinal perfusion and toxicity
Intestinal perfusion studies showed higher magnitudes of absorptivity and permeability parameters for C-SNEDDS, SNEDDS vis-à-vis the free drug solution. Fig. 7A depicts the percent increase in Peff and Pwall in case of optimized C-SNEDDS and SNEDDS. The C-SNEDDS showed nearly 180% and 568% increase in Peff and Pwall, while the SNEDDS showed 153% and 401% increase in Peff and Pwall vis-à-vis the free drug solution. Likewise, evaluation of the absorptivity parameters also substantiated remarkable augmentation in the absorption number (An) and fraction absorbed (F) by C-SNEDDS and SNEDDS vis-à-vis the free drug solution.34,35 A total of 571.6% and 404.8% increase in An and F was observed from C-SNEDDS and SNEDDS. The higher magnitudes of permeability and absorption parameters construed enhanced biopharmaceutical performance of the prepared formulations. After SPIP studies, the histopathological evaluation of rat intestinal segments revealed normal intestinal physiology without any marked changes in the structure of villi and lymph glands, along with no signs of inflammation (Fig. 7B). This confirmed the safer and biocompatible nature of the prepared formulations without any toxic effects.13 | ||
| Fig. 7 (A) Permeability and absorption parameters as per the intestinal perfusion studies, (B) histopathology of rat intestinal sections (A) control, (B) SNEDDS and (C) C-SNEDDS formulations. | ||
3.6 In vivo pharmacokinetics
Fig. 8A illustrates the mean plasma concentration versus time profile of candesartan cilexetil from the C-SNEDDS, SNEDDS and free drug solution. As per the chosen one compartment body model various pharmacokinetic parameters were computed, which revealed markedly superior drug absorption rate with distinct improvement in Cmax, Tmax and AUC for C-SNEDDS and SNEDDS vis-à-vis the free drug solution (Fig. 8B). Nearly 4.5 to 5.7-fold enhancement in Cmax and AUC was observed for SNEDDS and C-SNEDDS vis-à-vis the free drug solution. Besides, the Cmax/AUC ratio also exhibited 0.8 and 1.2-fold improvement for SNEDDS and C-SNEDDS over the free drug solution, indicating significant improvement in the magnitude of oral bioavailability. Likewise, a significant change in the absorption rate constant (Ka) was also observed with nearly 1.1 to 1.6-fold improvement from SNEDDS and C-SNEDDS as compared to the free drug solution (p < 0.001). The Tmax, however, showed a drastic reduction up to 2.3 to 3.4-fold for SNEDDS and C-SNEDDS as compared to the free drug solution (p < 0.001). Overall, the results ratified distinct improvement in both rate and extent of oral drug absorption from C-SNEDDS and SNEDDS over the free drug solution (p < 0.001). | ||
| Fig. 8 (A) Graph showing drug concentration in rat plasma at various time-points, (B) bar chart depicting percent alteration in the pharmacokinetic parameters relative to pure drug. | ||
3.7 In vitro/in vivo correlations (IVIVC)
Fig. 9A-C illustrates the Level A IVIVC for the SNEDDS, C-SNEDDS and free drug solution. High magnitudes of r2 for SNEDDS (i.e., 0.967), C-SNEDDS (i.e., 0.973) and free drug solution (i.e., 0.983) as per the linear model fitting between the in vitro drug release and in vivo drug absorbed confirmed the prevalence of level A IVIVC.36,37 The prepared formulations showed good correlation for in vitro drug release and in vivo drug absorption up to 45 minutes, while the free drug solution exhibited linear relationship between the in vitro and in vivo parameters from 30 minutes and 2 h. Moreover, the close proximity in the r2 values of the prepared formulations with the free drug solution did not reveal any significant difference in the net correlation between the dissolution and absorption behaviour. This testifies the predictive ability of dissolution apparatus, drug release medium, dissolution conditions, etc. selected for establishing the relationship. Since candesartan cilexetil is a poorly water-soluble drug exhibiting dissolution limited absorption, it is anticipated to show good point-to-point correlation between the parameters corresponding to the in vitro and in vivo performance (i.e., Level A). Consequently, establishment of IVIVC demonstrated that the in vitro dissolution performance correlated well with the in vivo absorption parameters for the prepared formulations and free drug solution too. Also establishment of level A IVIVC ratifies significant dependability of the in vivo drug absorption on in vitro drug release in the present work. Investigation of level B correlation between MDT and MRT, and level C correlation between T50% and Tmax also revealed higher values of r2 0.988 and 0.996 as per the linear model fitting, indicated close proximity of in vitro data with the in vivo data (Fig. 10). Overall, the establishment of level A IVIVC along with level B and C vouch the enhanced biopharmaceutical performance of the developed formulations. | ||
| Fig. 9 Level A IVIVC for (A) C-SNEDDS, (B) SNEDDS and (C) free drug solution. | ||
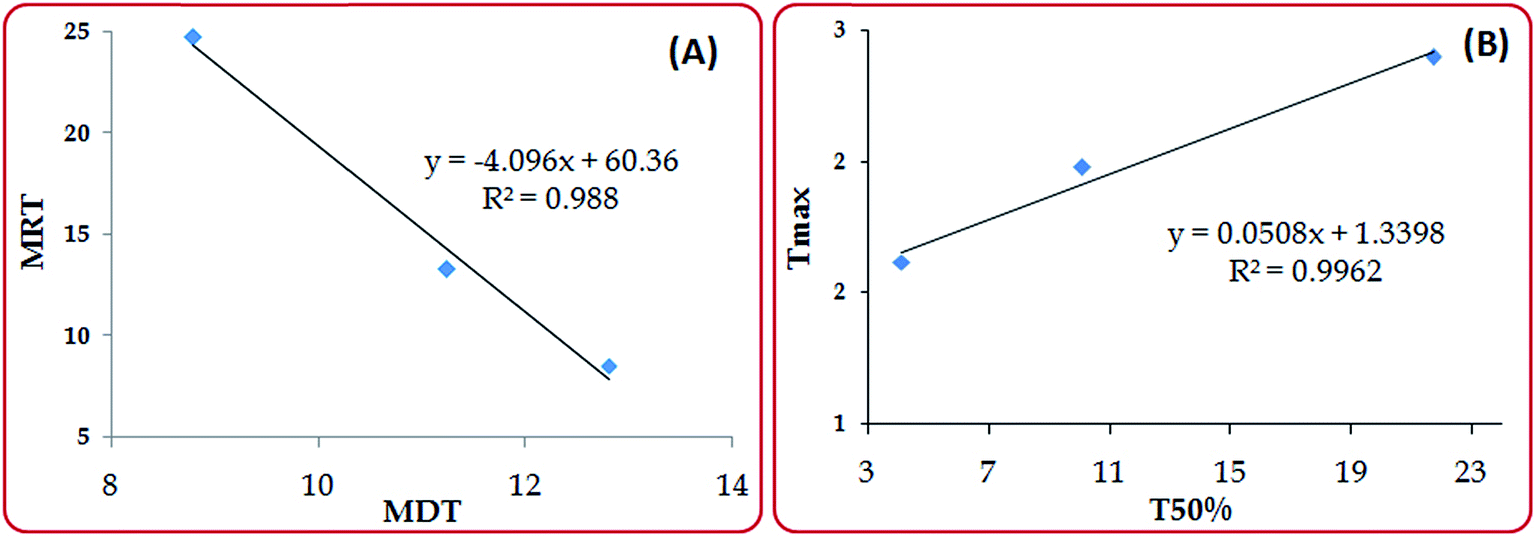 | ||
| Fig. 10 Level B and Level C for the C-SNEDDS, SNEDDS and free drug solution. | ||
4. Discussion
The present work aims for the systematic development and characterization of the optimized C-SNEDDS for enhancing the biopharmaceutical performance of candesartan cilexetil. As selection of suitable vehicles is highly crucial for formulation of C-SNEDDS owing to significant influence of them on drug solubilization, emulsification, absorption through intestinal lymphatic pathways, the extensive solubility and phase titration studies were conducted.21,38 Amongst the studied excipients, Lauroglycol 90, Tween 40 and Transcutol HP showed higher drug solubilization potential. Lauroglycol 90 contains propylene glycol monolaurate units (HLB 3), thus responsible for maximum solubility compared to other lipids due to ease of solubilization of the drug in the monoglyceride chains of the lauric acid and propylene glycol.39 Besides, the literature reports vouched optimal emulsification characteristics with wide range of synthetic and/or semi-synthetic surfactants like polysorbates and polyoxyethylene hydrogenated castor oil derivatives.40,41Among the surfactants investigated, Tween 40 showed highest solubility due to the presence of polyoxyethylene derivative of sorbitan monopalmitate, which helps in ease of entanglement of the drug in the surfactant chains.26 Besides, high solvent capacity of Tween 40 may also help in faster emulsification of the lipids at the oil–water interface to produce nanoemulsion and efficient stabilization of the emulsion globules through insertion of long chain fatty acids into the core of oil droplets.42 Presence of cosolvent acts as an adjuvant for the surfactant and helps in reducing the interfacial tension by adsorbing themselves at the oil–water interface.24 Transcutol HP explored as the cosolvent in the present studies exhibited enhanced solubilization of the drug with Lauroglycol 90 and Tween 40, owing to its polar and hydrophilic nature, which imparts ease of miscibility of the lipidic phase with aqueous phase.43 Combined use of Tween and Transcutol has been reported in diverse literature reports as an ideal combination for constructing ternary phase diagrams with lipids. Both the excipients, in this regard, tend to influence the solubility of the drugs by avoiding irreversible precipitation due to thermodynamic changes.16,44
To ensure the spontaneity of self-emulsification of C-SNEDDS to produce the nanoemulsion in the gastrointestinal (GI) conditions, phase titration studies were conducted for identifying the suitable nanoemulsion region. Optimal nanoemulsion region was observed for the pseudoternary phase diagrams constructed employing Lauroglycol 90 and Smix ratio of 1:2 for Tween 40 and Transcutol HP, over other combinations like 1:1, 2:1 and 3:1. This can be explained by complete interfacial solubilization of the lipidic phase by the Smix, leading to efficient self-emulsification process.45 Further, the optimal emulsification could be attributed to synergistic influence of ternary mixtures on each other. Higher degree of interaction of Smix combinations with the chosen lipidic phase tends to accelerate the emulsification process and produce higher nanoemulsion region.46 Literature reports suggests that polysorbates units and long-chain fatty alcohol Transcutol tend to entangle with the lipidic phase, thus assisting in the formation of self-assembled multilamellar structures.47 Among the studied Smix combinations, the selection of 1:2 ratio was justified with respect to the total HLB required for formation of oil-in-water emulsion (i.e., 12.7), indicating formation of stable nanoemulsions. On the contrary, the Smix ratios 1:1, 2:1 and 3:1 showed HLB values, i.e., 10.6, 14.5 and 15.0, beyond the ideal HLB required for formation of stable oil-in-water nanoemulsions, thus obviated from the further studies.48
Based on the solubility studies and pseudoternary phase diagrams, the amounts of lipid, surfactant and cosolvent required to form the optimized C-SNEDDS was selected employing the D-optimal mixture design. As C-SNEDDS are considered to be the isotropic systems, selection of mixture design helped in identifying the optimized formulation by multifactorial optimization.49 The optimization data analysis was conducted through quadratic polynomial model and contour plots, which revealed combined influence of all the factors on the studied responses. The faster self-emulsification efficiency was observed at lower levels of lipid and higher levels of surfactant, which helps in complete solubilization of the lipids in the aqueous phase to form an ultrafine dispersion.50 The amounts of lipid and surfactant also exhibited prominent influence on the globule size, with moderate influence of the cosolvent. Lower globule size of the C-SNEDDS was primarily observed at low of levels lipid and cosolvent, and high levels of surfactant, ostensibly owing to the complete solubilization of the lipid chains by the surfactant.42 Further, significantly positive values of the zeta potential for the C-SNEDDS could be ascribed to the presence of oleylamine, the molecules of which tend to align near the boundary layer between lipid–water interfaces eventually resulting in positive electrochemical potential.51 A sharp drift in the zeta potential values from highly negative values of plain SNEDDS to the positive values for CSNEDDS also construed selection of suitable concentration of oleylamine as charge inducer. Mechanistically, oleylamine tends to transport itself into the stagnant layer near the lipid–water interface and produces positive electrochemical potential, which has been reported to be highly influential for attaining thermodynamic stability of the nanoemulsion globules by preventing formation of coalescence.52,53 The positive values of zeta potential provide higher permeability of the emulsion globules plausibly by interacting with the GI epithelial cell lining.13 Further, the formation of nanostructured emulsion globules was confirmed with the help of electron microscopic examination. The nanosized nature of the globules is highly desirable for faster drug release and enhanced drug absorption through transcellular and paracellular pathways.54
After detail understanding of the physiochemical performance of the C-SNEDDS, the optimized formulation was identified by numerical optimization with overall criteria set for attaining smaller globule size (imperative for drug release and absorption of drug through GI tract) and higher dissolution efficiency (indicative of drug release rate and essential for predicting drug absorption rate).55 The C-SNEDDS with desirability function closer to 1 was selected as the optimized formulation for attaining superior biopharmaceutical performance.55,56 Significant improvement in the drug release rate was observed from the optimized C-SNEDDS and SNEDDS compared to the free drug solution, which was further ratified by comparison of the dissolution profile using f1 and f2 values. This corroborated enhanced solubility of the drug from the developed formulations over its free counterpart. The faster release rate of the drug from the developed formulations can be ascribed to the spontaneous emulsification and micellar solubilization of the lipidic and emulsifying agents, and responsible for attaining ease of drug solubility in the dissolution medium and faster drug absorption into the systemic circulation.16 Mechanistically, the lipid, surfactant and cosolvent, tend to swell upon contact with aqueous phase to form the ultrafine emulsion globules, thus facilitating faster drug solubilization.57
Evaluation of the cellular cytotoxicity revealed safe and biocompatible nature of the developed formulations and ratified apt selection of GRAS approved excipients.9 However, significant reduction in the percent cell viability was observed in an exponential order with the cells treated with Triton-X 100 as the negative control owing to disruption of the Caco-2 cell membrane.58 Further, measurement of TEER also confirmed no significant change in the confluency of cells treated with free drug solution, SNEDDS and CSNEDDS from the initial value. The CSNEDDS, however, showed mild reduction in the TEER may be owing to the presence of oleylamine in the formulation, which upon immediate exposure to the cells causes alternation in the membrane fluidity and electrical resistance. However, reversible reduction in TEER confirmed lack of any toxic effect on the cell viability.59,60
Multi-fold improvement in the quantitative uptake of the drug from apical to basolateral side of the cell monolayers through the C-SNEDDS over the free drug solution itself indicated enhanced cellular uptake and permeability characteristics of the developed formulations.17 Interestingly, the C-SNEDDS also showed higher cellular permeability over the plain SNEDDS across the cell monolayers. This can be explained by strong interaction of the charge bearing nanoemulsion globules with the cell membrane, leading eventually to faster permeation and transportation of drug through paracellular and transcellular pathways.12,17 This justified the addition of oleylamine as cationic charge inducer for preparing the C-SNEDDS.61 Besides, the presence of Lauroglycol 90 and Tween 40 helped in enhancing the permeability of the drug owing to their interactions with the cell membrane lipids, while Transcutol HP has been reported to augment membrane fluidity by disorganization of cellular lipids for ease of permeation of the emulsion globules.39 Further, the bidirectional permeation studies revealed significant reduction in drug transportation from basolateral to apical side and confirmed high degree of efficacy of C-SNEDDS and SNEDDS in surmounting the P-gp efflux activity of the drug from its free counterpart. As a substrate of P-gp, candesartan cilexetil, exhibit low oral bioavailability owing to efflux by intestinal epithelial cells.4,62 Several literature reports vouch the P-gp efflux inhibition activity of SNEDDS for augmenting the oral bioavailability of drugs.33,63,64 On mechanistic front, the P-gp efflux can be attributed to the presence of surfactants like polysorbates, poloxamers, Cremophor, etc., which tends to block the ATP-driven switch mechanism responsible for efflux of drug molecules, whereas excipients like long-chain fatty alcohols, i.e., PEG, Transcutol HP tend to alter the electrical resistance of the P-gp membrane for reducing the transport of the drug.65 The results observed from present work demonstrated enhanced permeability of the drug over other myriad drug delivery strategies like, self-microemulsifying systems, micellar solution and cyclodextrin complexes.33,66 This construed high degree of utility of SNEDDS in augmenting the permeability of drugs through paracellular pathways, which is considered to be one of the important approaches for enhancing the oral bioavailability.9,10
Intestinal perfusion studies showed appreciable increase in the values of Peff, Pwall, F and An, and construed supremacy of the C-SNEDDS over the plain SNEDDS and free drug solution owing to its enhanced permeability and absorption properties. This can be explained by the presence of cationic charge on nanoemulsion globules, which undergo strong interaction with anionic charge on intestinal epithelial cell lining for faster drug permeation.13 Besides, other vital mechanisms involve synergistic interplay of the lipidic and emulsifying excipients, leading eventually to facilitation of the intestinal permeability, circumnavigation of the hepatic first-pass effect, inhibition of P-gp efflux and potentiation of drug absorption via intestinal lymphatic pathways.67,68 Lauroglycol 90, primarily containing long-chain triglycerides, tends to improve the permeability of the drugs by modulating the structure of lipid bilayers, thereby facilitating drug absorption through paracellular transport and lymphatic pathways.69 Tween 40, on the other hand, is reported to improve permeation by interacting with the cell membrane lipids, while Transcutol HP helps in altering the membrane fluidity by disorganizing the structural confirmation in the lipids bilayer.39 Moreover, the safety studies performed on the intestinal segments through histopathological examinations revealed lack of any visible changes in cellular morphology, thus substantiated safer and biocompatible nature of the developed formulations inconsonance with cellular cytotoxicity studies.
The pharmacokinetic studies also revealed significant augmentation in the drug absorption from C-SNEDDS over the plain SNEDDS and the free drug solution. Manifold improvement in the values of Cmax and AUC, and reduction in the Tmax values confirmed improvement in the rate as well as extent of oral bioavailability by the C-SNEDDS owing to the faster permeation and absorption of the drug by the cationic charge inducer, while the naive SNEDDS exhibited only mild improvement. Moreover, the remarkable augmentation in the values of Ka also indicated the faster drug absorption tendency through intestine into the systemic circulation.15 Exploration of IVIVC helped in successful correlations among the in vitro drug release parameters and in vivo drug absorption parameters. High prevalence of IVIVC among CSNEDDS and SNEDDS at all the levels can be accomplished assigned to the rational selection of dissolution medium, conditions, etc. for predicting the in vivo performance from the in vitro drug release data.
In a nutshell, the findings observed from the current studies ratified the formulation of C-SNEDDS as an alternative formulation strategy over the conventional SNEDDS for enhancing the oral bioavailability of candesartan cilexetil.
5. Conclusions
The present studies successfully demonstrated the systematic development of optimized C-SNEDDS with enhanced bioavailability potential for candesartan cilexetil. The use of experimental designs helped in identifying “the best” possible formulation with detail understanding of the cause–effect relationship among the formulation factors and response variables. Overall, the C-SNEDDS were found to be remarkably superior over the conventional SNEDDS for demonstrating higher oral drug absorption owing to multi-fold improvement in the drug solubilization in the GI fluid and intestinal permeability, inhibition of drug efflux by P-gp transporters and enhanced drug absorption. The outstanding findings of the current studies, therefore, ratified the successful selection of C-SNEDDS as an effective and cost-effective drug delivery strategy over the erstwhile approaches for oral bioavailability enhancement of BCS class II and class IV drugs for the purpose.Declaration of interest
The authors declare no conflict(s) of interest in this work.Acknowledgements
Vital software support for data analysis using Design Expert® 9.0.1 from M/s Stat-Ease, Minneapolis, USA, is deeply acknowledged. The coauthor, Mr Sarwar Beg deeply acknowledge UGC for providing financial support as Research Fellow under RFMS scheme (F. No. 5-94/2007(BSR) dated 28/02/2013) to carry out the doctoral research. Also the coauthor, Mr Kaushik Thanki is grateful to Council of Scientific and Industrial Research (CSIR), Govt of India, New Delhi, for providing Research fellowships to pursue doctoral research for the purpose.References
- P. S. Sever, J. Hypertens. Suppl., 1997, 15, S9–S12 CrossRef CAS.
- K. J. McClellan and K. L. Goa, Drugs, 1998, 56, 847–869 CrossRef CAS.
- C. H. Gleiter and K. E. Morike, Clin. Pharmacokinet., 2002, 41, 7–17 CrossRef CAS PubMed.
- S. Gurunath, B. K. Nanjwade and P. A. Patila, Saudi Pharm. J., 2014, 22, 246–257 CrossRef CAS PubMed.
- V. Kamalakkannan, A. Puratchikody and L. Ramanathan, Res. Pharm. Sci., 2013, 8, 125–136 CAS.
- M. Sravya, D. Rajamanickam and B. Srinivasan, Int. Res. J. Pharm., 2012, 3, 238–240 Search PubMed.
- S. M. Shaikh and A. M. Avachat, Curr. Drug Delivery, 2011, 8, 346–353 CrossRef CAS.
- C. Detroja, S. Chavhan and K. Sawant, Sci. Pharm., 2011, 79, 635–651 CrossRef CAS PubMed.
- B. Singh, S. Bandopadhyay, R. Kapil, R. Singh and O. Katare, Crit. Rev. Ther. Drug Carrier Syst., 2009, 26, 427–521 CrossRef CAS.
- C. J. Porter, N. L. Trevaskis and W. N. Charman, Nat. Rev. Drug Discovery, 2007, 6, 231–248 CrossRef CAS PubMed.
- B. Singh, S. Beg, R. K. Khurana, P. J. S. Sandhu, R. Kaur and O. P. Katare, Crit. Rev. Ther. Drug Carrier Syst., 2014, 31, 121–185 CrossRef CAS.
- T. Gershanik and S. Benita, Pharm. Dev. Technol., 1996, 1, 147–157 CrossRef CAS PubMed.
- T. Gershanik, S. Benzeno and S. Benita, Pharm. Res., 1998, 15, 863–869 CrossRef CAS.
- V. Nekkanti, P. Karatgi, R. Prabhu and R. Pillai, AAPS PharmSciTech, 2009, 11, 9–17 CrossRef PubMed.
- B. Singh, R. Singh, S. Bandyopadhyay, R. Kapil and B. Garg, Colloids Surf., B, 2013, 101, 465–474 CrossRef CAS PubMed.
- S. Beg, S. S. Jena, C. N. Patra, M. Rizwan, S. Swain, J. Sruti, M. E. Rao and B. Singh, Colloids Surf., B, 2013, 101, 414–423 CrossRef CAS PubMed.
- T. Gershanik, E. Haltner, C. M. Lehr and S. Benita, Int. J. Pharm., 2000, 211, 29–36 CrossRef CAS.
- B. Singh and S. Singh, Indian J. Pharm. Sci., 1998, 60, 313–316 Search PubMed.
- Y. Zhang, M. Huo, J. Zhou, A. Zou, W. Li, C. Yao and S. Xie, AAPS J., 2010, 12, 263–271 CrossRef CAS PubMed.
- A. K. Jain, K. Thanki and S. Jain, Mol. Pharm., 2013, 10, 3459–3474 CrossRef CAS PubMed.
- A. K. Jain, K. Thanki and S. Jain, Pharm. Res., 2013b, 31, 923–945 Search PubMed.
- A. Palamakula and M. A. Khan, Int. J. Pharm., 2004, 273, 63–73 CrossRef CAS PubMed.
- A. K. Jain, K. Thanki and S. Jain, Pharm. Res., 2013, 31, 923–945 CrossRef PubMed.
- A. K. Jain, K. Thanki and S. Jain, Nanomedicine, 2014, 10, 959–969 CrossRef CAS PubMed.
- S. Berggren, J. Hoogstraate, U. Fagerholm and H. Lennernas, Eur. J. Pharm. Sci., 2004, 21, 553–560 CrossRef CAS PubMed.
- S. Bandyopadhyay, O. P. Katare and B. Singh, Colloids Surf., B, 2012, 100, 50–61 CrossRef CAS PubMed.
- B. Singh, L. Khurana, S. Bandyopadhyay, R. Kapil and O. P. Katare, Drug Delivery, 2011, 18, 599–612 CAS.
- B. Singh, K. Raza and S. Beg, Chem. Ind. Dig., 2013, 12, 1–7 Search PubMed.
- T. J. Cook and S. S. Shenoy, Toxicology, 2003, 184, 125–133 CrossRef CAS.
- J. Yao, Y. Lu and J. P. Zhou, J. Pharm. Pharm. Sci., 2008, 11, 22–29 CAS.
- Y. Liu, J. B. Schwartz, R. L. Schnaare and E. T. Sugita, Pharm. Dev. Technol., 2003, 8, 419–430 CrossRef CAS PubMed.
- L. Li, T. Yi and C. W. Lam, Int. J. Pharm., 2013, 447, 192–198 CrossRef CAS PubMed.
- S. Yang, R. N. Gursoy, G. Lambert and S. Benita, Pharm. Res., 2004, 21, 261–270 CrossRef CAS.
- Y. Chen, G. Li, X. Wu, Z. Chen, J. Hang, B. Qin, S. Chen and R. Wang, Biol. Pharm. Bull., 2008, 31, 118–125 CAS.
- U. Fagerholm, M. Johansson and H. Lennernas, Pharm. Res., 1996, 13, 1336–1342 CrossRef CAS.
- Y. Takekuma, T. Takenaka, M. Kiyokawa, K. Yamazaki, H. Okamoto, A. Kitabatake, H. Tsutsui and M. Sugawara, Biol. Pharm. Bull., 2007, 30, 537–542 CAS.
- J. E. Polli, G. S. Rekhi, L. L. Augsburger and V. P. Shah, J. Pharm. Sci., 1997, 86, 690–700 CrossRef CAS PubMed.
- R. N. Gursoy and S. Benita, Biomed. Pharmacother., 2004, 58, 173–182 CrossRef PubMed.
- F. Shakeel, N. Haq, F. K. Alanazi and I. A. Alsarra, Pharm. Dev. Technol., 2013, 19, 799–805 CrossRef PubMed.
- M. J. Qureshi, C. Mallikarjuna and W. G. Kiana, Asian J. Pharm. Sci., 2015, 10, 40–56 CrossRef PubMed.
- V. Wankhade, K. Tapar, S. Pande and N. Bobade, Pharm. Lett., 2010, 2, 132–143 CAS.
- S. Jain, A. K. Jain, M. Pohekar and K. Thanki, Free Radical Biol. Med., 2013, 65, 117–130 CrossRef CAS PubMed.
- P. Zhang, Y. Liu, N. Feng and J. Xu, Preparation and evaluation of self-microemulsifying drug delivery system of oridonin, Int. J. Pharm., 2008, 355, 269–276 CrossRef CAS PubMed.
- Y. Weerapol, S. Limmatvapirat, H. Takeuchi and P. Sriamornsak, Powder Technol., 2015, 271, 100–108 CrossRef CAS PubMed.
- B. Sjostrom, B. Kronberg and J. Carlfors, J. Pharm. Sci., 1993, 82, 579–583 CrossRef CAS PubMed.
- L. Djekic and M. Primorac, Int. J. Pharm., 2008, 352, 231–239 CrossRef CAS PubMed.
- R. S. Narkhede, K. N. Gujar and V. M. Gambhire, Asian J. Pharm., 2014, 8, 200–209 CrossRef CAS.
- K. Bouchemal, S. Briancon, E. Perrier and H. Fessi, Int. J. Pharm., 2004, 280, 241–251 CrossRef CAS PubMed.
- E. B. Basalious, N. Shawky and S. M. Badr-Eldin, Int. J. Pharm., 2010, 391, 203–211 CrossRef CAS PubMed.
- C. W. Pouton, Eur. J. Pharm. Sci., 2006, 29, 278–287 CrossRef CAS PubMed.
- S. Simovic, H. Hui, Y. Song, A. K. Davey, T. Rades and C. A. Prestidge, J. Controlled Release, 2010, 143, 367–373 CrossRef CAS PubMed.
- S. H. Klang, C. S. Siganos, S. Benita and J. Frucht-Pery, J. Controlled Release, 1999, 57, 19–27 CrossRef CAS.
- M. P. Piemi, D. Korner, S. Benita and J. Marty, J. Controlled Release, 1999, 58, 177–187 CrossRef CAS.
- B. Singh, R. Kumar and N. Ahuja, Crit. Rev. Ther. Drug Carrier Syst., 2005, 22, 27–105 CrossRef CAS.
- S. Beg, P. S. Sandhu, R. S. Batra, R. K. Khurana and B. Singh, Drug Delivery, 2014, 1–20, DOI:10.3109/10717544.2014.900154 , Epub ahead of print.
- M. Cruz-Monteagudo, F. Borges and M. N. Cordeiro, J. Comput. Chem., 2008, 29, 2445–2459 CrossRef CAS PubMed.
- P. Balakrishnan, B. J. Lee, D. H. Oh, J. O. Kim, M. J. Hong, J. P. Jee, J. A. Kim, B. K. Yoo, J. S. Woo, C. S. Yong and H. G. Choi, Eur. J. Pharm. Biopharm., 2009, 72, 539–545 CrossRef CAS PubMed.
- S. V. Verstraeten, G. K. Jaggers, C. G. Fraga and P. I. Oteiza, Biochim. Biophys. Acta, 2013, 1828, 2646–2653 CrossRef CAS PubMed.
- H. Wu, X. Long, F. Yuan, L. Chen, S. Pan, Y. Liu, Y. Stowell and X. Li, Acta Pharm. Sin. B, 2014, 4, 217–276 CrossRef PubMed.
- Z. Ujhelyi, F. Fenyvesi, J. Varadi, P. Feher, T. Kiss, S. Veszelka, M. Deli, M. Vecsernyes and I. Bacskay, Eur. J. Pharm. Sci., 2012, 47, 564–573 CrossRef CAS PubMed.
- N. Singh, S. M. Verma, S. K. Singh and P. R. P. Verma, Mater. Res. Express, 2014, 1, 025401 CrossRef.
- S. Gurunath, B. K. Nanjwade and P. A. Patil, Drug Dev. Ind. Pharm., 2015, 41, 170–176 CrossRef CAS PubMed.
- P. V. Patel, H. K. Patel, S. S. Panchal and T. A. Mehta, Int. J. Pharm. Invest., 2013, 3, 95–104 CrossRef CAS PubMed.
- L. Li, T. Yi and C. W. Lam, J. Pharm. Pharm. Sci., 2014, 17, 447–460 CAS.
- P. Zakeri-Milani and H. Valizadeh, Expert Opin. Drug Metab. Toxicol., 2014, 10, 859–871 CrossRef CAS PubMed.
- J. N. Yu, Y. Zhu, L. Wang, M. Peng, S. S. Tong, X. Cao, H. Qiu and X. M. Xu, Acta Pharmacol. Sin., 2010, 31, 759–764 CrossRef CAS PubMed.
- C. M. O'Driscoll, Eur. J. Pharm. Sci., 2002, 15, 405–415 CrossRef.
- C. J. Porter, N. L. Trevaskis and W. N. Charman, Nat. Rev. Drug Discovery, 2007, 6, 231–248 CrossRef CAS PubMed.
- N. S. Barakat, J. Pharm. Pharmacol., 2010, 62, 173–180 CrossRef CAS PubMed.
Footnote |
| † Electronic supplementary information (ESI) available. See DOI: 10.1039/c5ra11687b |
| This journal is © The Royal Society of Chemistry 2015 |