
 Open Access Article
 This Open Access Article is licensed under a
 Creative Commons Attribution 3.0 Unported Licence
BaGeO3 as sintering additive for BaTiO3–MgFe2O4 composite ceramics
R.
Köferstein
* and
S. G.
Ebbinghaus
Institute of Chemistry, Martin Luther University Halle-Wittenberg, Kurt-Mothes-Strasse 2, 06120 Halle, Germany. E-mail: roberto.koeferstein@chemie.uni-halle.de; Fax: +49-345-5527028; Tel: +49-345-5525630
First published on 12th August 2015
Abstract
BaTiO3–MgFe2O4 composites (30 wt% MgFe2O4) with a small addition of BaGeO3 as a sintering additive were synthesized by a one-pot Pechini-like sol–gel process. Nano-crystalline composite powders with a crystallite size of about 10 nm were obtained after reaction at 700 °C for 1 h. Magnetic investigations suggest that the nano-powder is in its superparamagnetic state at room temperature. The addition of BaGeO3 leads to an improved sintering behaviour. DTA measurements reveal the formation of a liquid phase at 1164(3) °C. Dense ceramic bodies (relative density ≥ 90%) were obtained after sintering for 1 h at 1150 °C. SEM investigations prove a 0–3 connectivity and show that the addition of BaGeO3 promotes the grain growth leading to particles up to 4 μm. In contrast, fine-grained composite ceramics with smaller particles up to 230 nm were obtained after a two-step sintering process. Magnetic measurements indicate a ferrimagnetic behaviour with coercivity values up to 70 Oe depending on the sintering procedure. Furthermore, addition of BaGeO3 results in an increase of the relative permittivity, whereas the dissipation factor slightly decreases.
1. Introduction
Multiferroic composite materials are of high interest because of their potential applications in advanced technology e.g. as sensors, memories and actuators.1–3 Composites consisting of both ferro/ferrimagnetic and ferroelectric phases can exhibit a magneto-electrical (ME) coupling effect.4 To produce BaTiO3–MFe2O4 composites (e.g. M = Co2+, Ni2+, Mg2+) various synthesis routes have been reported, e.g. mixed-oxide-, sol–gel- and hydrothermal processes.5–8 Reactions between the BaTiO3 and MFe2O4 phase often lead to the formation of BaFe12O19 and/or hexagonal BaTiO3.9,10 Therefore, the sintering temperature for composite ceramics is limited and depends on the synthesis route and particle size. For some ferrite components, the BaTiO3–MFe2O4 composites show an insufficient sintering behaviour.11–13 In particular BaTiO3–MgFe2O4 ceramic bodies exhibit low densities. Up to now this system has rarely been investigated.14–17 A magneto-electrical effect in BaTiO3–MgFe2O4 composites was found by Tan et al.14 and Tadi et al.15 As the ME coupling strongly depends on the quality of the oxide interface, dense ceramics with a close contact between the perovskite and spinel phase are advantageous for large ME coefficients. Sintering additives improve the densification, therefore the densities of the ceramic bodies increase and/or the sintering temperature can be reduced.18–20 Low sintering temperatures are of special interest as they enable to obtain fine-grained ceramics. Furthermore, fine-grained ceramics show improved mechanical properties.21 The influence of sintering additives on BaTiO3–MFe2O4 ceramics has barely been investigated to date. To our best knowledge, there are only reports on boron- and bismuth-containing fluxes as sintering additives leading to BaTiO3–MFe2O4 glass–ceramic composites.22–24 Li et al.25 used a Li2O–Bi2O3 flux for fabrication of Pb0.88La0.065Bi0.015Zr0.52Ti0.48O3–CoFe2O4 composites. The formation of a molten phase during sintering usually promotes grain growth and should therefore be avoided if small particle sizes are desired. Previous publications showed that the formation of a molten flux is not necessary to improve the densification of ceramic bodies when sintering additives on the basis of e.g. BaGeO3 and SiO2 are used.19–27The aim of this paper is to investigate the influence of BaGeO3 as sintering additive on BaTiO3–MgFe2O4 composite ceramics with a 0–3 connectivity. The samples were synthesized using a one-pot sol–gel method leading to nano-sized powders. Phase formation during the sintering process was monitored by XRD and thermal analysis. The sintering behaviour and microstructure of resulting compacts were determined by dilatometry and SEM. Magnetic measurements were carried out both on composite powders and ceramic bodies. Furthermore, the influence of BaGeO3 on the dielectric behaviour was studied.
2. Experimental
2.1. Material preparation
Composites with a weight fraction of 0.7× (BaTi0.95Ge0.05O3)–0.3× (MgFe2O4) (=33 mol% or 36 vol% MgFe2O4) were prepared using a modified Pechini-like sol–gel process as described elsewhere.17 This composition is abbreviated as BT0.95G0.05–MF–0.3 in the following. Additionally composites with the composition 0.7× (BaTi0.9Ge0.1O3)–0.3× (MgFe2O4) (donated as BT0.9G0.1–MF–0.3) and a Ti-excess composite 0.7× (BaTi1.0Ge0.05O3)–0.3× (MgFe2O4) (donated as BT1.0G0.05–MF–0.3) were synthesized.BT0.95G0.05–MF–0.3 composites were obtained by dissolving 0.01250 mol freshly distilled Ti(OiC3H7)4 (Aldrich), 0.00066 mol Ge(OC2H5)4 (Alfa Aesar), 0.01316 mol BaCO3 (Merck 1713, extra pure) and 0.127 mol anhydrous citric acid in 30 g 1,2-ethanediol at 70 °C leading to a clear solution. Stoichiometric proportions of 0.00661 mol Mg(NO3)3·6H2O (Alfa Aesar) and 0.01322 mol Fe(NO3)3·9H2O (Merck) were dissolved in 25 g 1,2-ethanediol and added to the above solution. The resulting mixture was continuously stirred at about 190–200 °C until it turned to a black-brown viscous gel. This gel was calcined in static air at 700 °C for 1 h (heating/cooling rate 5 K min−1).
The other compositions were prepared by the same procedure using corresponding stoichiometric quantities.
To obtain ceramic bodies, the calcined powders were uniaxially pressed at about 85 MPa into pellets (green density 2.0 g cm−3) without using any pressing aid or binder. These pellets were placed on a ZrO2 fibre mat. Two different sintering procedures were used; conventional sintering (heating up with 10 K min−1, soaking at this temperature, cooling down with 10 K min−1) and two-step sintering (heating up with 20 K min−1 to 1150 °C (T1), then fast cooled with 30 K min−1 to a lower temperature T2 and held at T2 for 20 h).
2.2. Characterization
X-ray powder diffraction patterns were collected at room temperature on a Bruker D8-Advance diffractometer, equipped with a one-dimensional silicon strip detector (LynxEye™) and operating with Cu-Kα radiation. Crystallite sizes were determined from the XRD line broadening using the Scherrer equation and the integral peak breadth (software suite WinXPOW28). Dilatometric investigations were performed in flowing synthetic air (50 ml min−1) in a Setaram TMA 92-16.18 dilatometer. Differential thermoanalytic (DTA) measurements in flowing synthetic air (20 ml min−1) were done using a Netzsch STA 449 system. Scanning electron microscope images were recorded with a Philips XL30 ESEM in the backscattered electron mode (BSE). For magnetic measurements a Quantum Design PPMS 9 was used. Hysteresis loops were obtained with magnetic field cycling between −90 and +90 kOe. In addition, the temperature dependent magnetic moments were measured in the temperature range of 5–300 K under field-cooled (FC) and zero-field-cooled (ZFC) conditions. An Impedance Analyzer 4192A (Hewlett Packard) was used for permittivity measurements up to 13 MHz. A eutectic Ga–In alloy was applied as electrical contact on both sides of the ceramic bodies.3. Results and discussion
3.1. Powder characterization
In a previous paper17 we reported on the preparation of (1 − x)BaTiO3–(x)MgFe2O4 composites (x = weight fraction) with 0–3 connectivity via a Pechini-like process. The BaTiO3–MgFe2O4 composite powders were found to have an insufficient sintering behaviour resulting in ceramic bodies with moderate densities of about 70% at 1200 °C. The maximum sintering temperature for BaTiO3–MFe2O4 systems is limited because of the formation of hexagonal BaTiO3 and/or BaFe12O19.9,17,29 As stated in ref. 30 and 31 the densification of BaTiO3 can be improved using BaGeO3 as sintering additive. Guha and Kolar32 found that a maximum of 1.8 mol% Ge4+ (related to the occupation of the Ti4+ site) can be incorporated into the BaTiO3 lattice. For our investigations a much higher content of ≥5 mol% BaGeO3 was used, resulting predominantly in a mixture of (Ge-doped) BaTiO3 and BaGeO3. For simplicity this composition is described by the formula BaTi0.95Ge0.05O3 in the following.The first step of the Pechini-like sol–gel process leads to highly-viscous homogeneous gels in which the metal ions are mixed on a molecular level. To obtain composite powders, these dark-brown gels were calcined at 700 °C for 1 h. The XRD pattern of the resulting powder shows mainly reflections of BaTiO3, MgFe2O4, and only small amounts of BaCO3 (ref. 33) (Fig. 1). After this first heat treatment no peaks related to Ge-containing phases could be detected. As an example, the powder 0.7× (BaTi0.95Ge0.05O3)–0.3× (MgFe2O4) (donated as BT0.95G0.05–MF–0.3) was examined by the BET method and was found to possess a specific surface area of 34.5 m2 g−1, corresponding to an equivalent particle size of 32 nm. The volume-weighted average crystallite sizes for both the MgFe2O4 and the BaTiO3 phase were calculated as 10 nm from XRD line broadening. The calculated crystallite size is roughly by the factor three smaller than the size of the primary particles obtained from the BET data. This is most likely because the decomposition of the gel leads to closely joined crystallites and in turn surface areas unavailable for nitrogen adsorption.34 An alternative explanation is that each primary particle may consist of several crystallite domains.
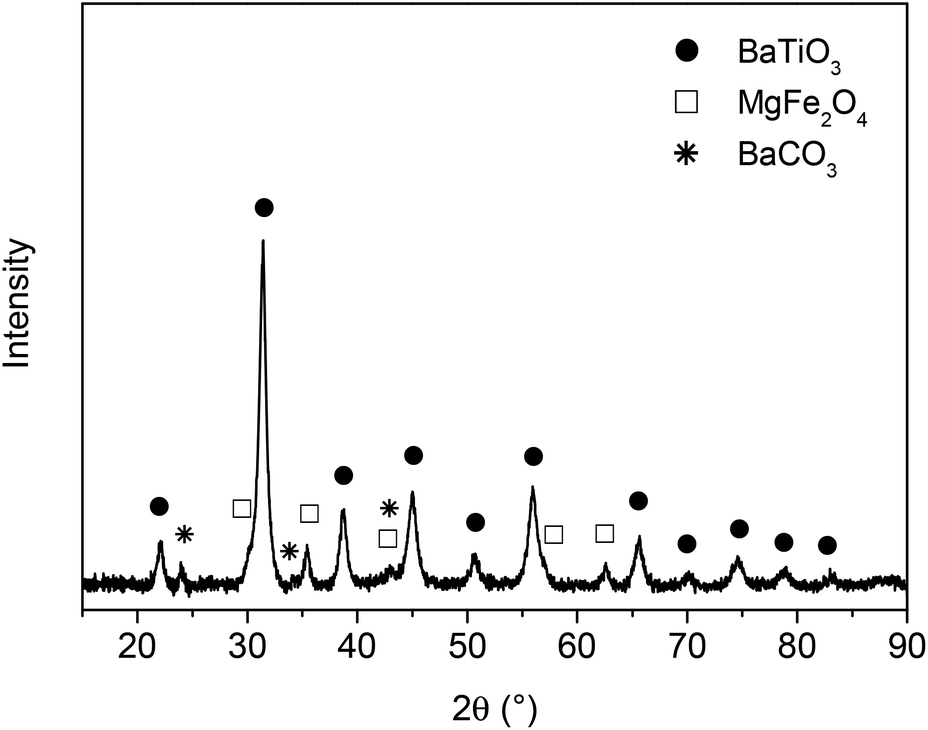 | ||
| Fig. 1 Room temperature XRD pattern of the powder BT0.95G0.05–MF–0.3 calcined at 700 °C for 1 h. | ||
Temperature-dependent magnetic investigations (H = 500 Oe) show a superparamagnetic behaviour for the BT0.95G0.05–MF–0.3 powder (Fig. 2A). The field-cooled (FC) curve increases continuously with decreasing temperature, while the zero-field-curve (ZFC) curve has a maximum at 20 K, the so called blocking temperature. The superparamagnetic behaviour is confirmed by field-dependent magnetic measurements. At 300 K the coercivity value is close to zero, whereas below the blocking temperature the hysteresis loop at 5 K shows a coercivity value of 146 Oe (Fig. 2B).
 | ||
| Fig. 2 (A) Temperature dependence (5–300 K) of the magnetization under zero-field cooled (ZFC) and field-cooled (FC) conditions for powder BT0.95G0.05–MF–0.3 calcined at 700 °C. (B) Magnetization (M) versus applied magnetic field (H) at 300 and 5 K for BT0.95G0.05–MF–0.3 powder. The inset shows M versus H in a small field range. | ||
3.2. Composite ceramics
DTA investigations (shown in Fig. 3) of BT0.95G0.05–MF–0.3 and BT0.9G0.1–MF–0.3 samples show the formation of a liquid phase (Graph 3a,b). The DTA signal increases with rising BaGeO3 content. The onset temperature of the melting peak was determined as 1164(3) °C. In contrast, the BT–MF–0.3 composite without BaGeO3 does not reveal any DTA signal up to 1200 °C (Graph 3c). | ||
| Fig. 3 DTA measurements in flowing air (heating rate 10 K min−1) of (a) BT0.95G0.05–MF–0.3, (b) BT0.9G0.1–MF–0.3, and (c) BT–MF–0.3. | ||
Fig. 4 shows the non-isothermal dilatometric measurement up to 1200 °C in flowing air of compacts from powder BT0.95G0.05–MF–0.3 and BT–MF–0.3 calcined at 700 °C for 1 h, respectively. The shrinkage process of BT0.95G0.05–MF–0.3 (Graph 4a) starts at about 800 °C and the shrinkage rate achieves a maximum at 1102 °C with a value of −1.68% min−1. Interestingly, this shrinkage maximum occurs below the liquid phase formation at 1164 °C. The shrinkage rate indicates that the densification is dominated by sliding processes (viscous flow). Diffusion as the dominant process causes only shrinkage rates of about 10−4 to 10−1% min−1.35–38 Investigations on the BaTiO3–BaGeO3 system confirm that the addition of BaGeO3 promotes sliding processes.39 The shrinkage has not yet been finished at the highest investigated temperature of 1200 °C. For comparison graph 4b shows the shrinkage behaviour of BT–MF–0.3 compacts without the addition of BaGeO3. A maximum of the shrinkage rate can be observed at 1185 °C (−0.80% min−1). Thus the addition of BaGeO3 leads to improved shrinkage behaviour at relatively low temperatures without involvement of a molten phase.
 | ||
| Fig. 4 Non-isothermal dilatometric measurements in flowing air for compacts of BT0.95G0.05–MF–0.3 and BT–MF–0.3 (calcined at 700 °C) with a heating rate of 10 K min−1. The inset shows the relative shrinkage rates (d(ΔLL0−1)dt−1). | ||
Fig. 5 shows the final bulk densities of ceramic bodies after isothermal conventional sintering at various temperatures in static air (heating up with 10 K min−1, soaking at this temperature for 1 h, cooling down with 10 K min−1). The absolute bulk densities of the sintered bodies were determined from their weight and geometric dimensions. The relative bulk densities of all ceramic bodies were calculated with respect to the theoretical density of 5.39 g cm−3 for BT–MF–0.3.17,31 It turned out that BT0.95G0.05–MF–0.3 ceramic bodies with relative densities of 70% can be obtained even at 1050 °C. By raising the sintering temperature to 1150 °C dense ceramics with 91% relative density can be achieved. After sintering at 1200 °C the relative density further increases to 95%. According to the DTA results sintering above 1150 °C is characterized by liquid-phase sintering processes. As seen in Fig. 5 the formation of a liquid-phase is not necessary to obtain dense ceramic bodies.
 | ||
| Fig. 5 Bulk densities of conventional (■□, soaking time 1 h) and two-step sintered (★, soaking time 20 h) ceramic bodies from BT0.95G0.05–MF–0.3 and BT–MF–0.3 powders calcined at 700 °C. The inset schematically shows the two-step sintering process. | ||
Longer sintering times have little influence on the density. For example, a soaking time of 10 h at 1100 °C results only in minor increase of the relative density from 76 to 79% for BT0.95G0.05–MF–0.3 composites. Furthermore, an increase of the BaGeO3 content to 10 mol% (BT0.9G0.1–MF–0.3) does not lead to rising densities. After sintering at 1100 °C for 1 h ceramic bodies of BT0.9G0.1–MF–0.3 with a relative density of 69% (3.71 g cm−3) were obtained. On the other hand, BaGeO3-free BT–MF–0.3 ceramics reach relative densities of only 50 and 70% after sintering at 1100 and 1200 °C for 1 h, respectively.
The SEM images of BT0.95G0.05–MF–0.3 ceramic bodies depicted in Fig. 6 show a 0–3 connectivity between the spinel and the perovskite phase. In the applied BSE mode the light grains correspond to BaTiO3 while the dark grains are MgFe2O4. Sintering at 1000 °C results in grain sizes between about 90 and 200 nm, which only slightly increase to 140–350 nm after sintering at 1100 °C (Fig. 6a). Up to this temperature there is no significant size difference between the BaTiO3 and MgFe2O4 grains. In contrast, sintering at 1150 °C for 1 h leads to a considerable grain growth with BaTiO3 grains in the range between 0.25–0.9 μm and MgFe2O4 grains between 0.25 and 3 μm as seen in Fig. 6b. Abnormal grain growth occurs during sintering at 1200 °C resulting in BaTiO3 grain sizes between 0.5 and 1.5 μm while the size of the ferrite grains ranges between 0.5 and 4 μm. The appearance of white rods with dimensions up to 23 × 4 μm after sintering at 1200 °C indicates the formation of hexagonal BaTiO3 (ref. 40) (Fig. 6c) in accordance with the XRD results discussed below.
 | ||
| Fig. 6 SEM-BSE images of ceramic bodies sintered at (a) 1100 °C, 1 h, (b) 1150 °C, 1 h, and (c) 1200 °C, 1 h. | ||
Using a two-step sintering procedure the densification at lower temperatures can be improved.30,41 In this approach, the compacts were first heated rapidly (20 K min−1) to 1150 °C (T1), then fast cooled (30 K min−1) to a lower temperature T2 and held at T2 for 20 h (see inset in Fig. 5). Two-step sintering with T2 = 900 °C leads to a relative bulk density of 78% (4.23 g cm−3), whereas upon rising T2 to 1000 °C the ceramic bodies achieve a relative density of 83% (4.46 g cm−3). In both cases the ceramic bodies consists of grain between about 90 and 230 nm. For comparison, conventional sintering at 1000 °C for 20 h leads only to a relative density of 68%.
XRD powder patterns of selected BT0.95G0.05–MF–0.3 ceramics are shown in Fig. 7. The pattern of ceramics sintered up to 1100 °C shows only reflections of BaTiO3 and MgFe2O4. At 2θ ≈ 45° no clear splitting of the BaTiO3 (002)/(200) peak could be detected indicating a reduced tetragonality, i.e. a considerable lower c/a ratio compared to coarse-grained ceramics with more than 1 μm particles. After sintering at 1150 °C very small traces of BaFe12O19 appear,33 whereas after 1200 °C about 19 mol% of BaTiO3 has been converted to the hexagonal modification. Sintering at 1250 °C leads to an increase of hexagonal BaTiO3 to 54 mol%. The formation of the hexagonal BaTiO3 modification at such comparably low temperatures is noteworthy since in pure BaTiO3 samples the transition to the hexagonal structure occurs above 1460 °C.42 The formation of hexagonal BaTiO3 at lower temperatures in the composites is probably caused by the incorporation of small amounts of iron- and magnesium-ions into the BaTiO3 lattice.43–47 Peaks corresponding to BaGeO3 were not found, most likely because of its small content. In contrast, BT0.9G0.1–MF–0.3 ceramic bodies with their larger BaGeO3 content clearly show the formation of monoclinic α-BaGeO3 (ref. 33) (Fig. 8A, Graph a).
 | ||
| Fig. 7 Room temperature XRD patterns of BT0.95G0.05–MF–0.3 ceramic bodies after sintering for 1 h (rate: 10 K min−1). (a) 1100 °C (b) 1150 °C, (c) 1200 °C, (d) 1250 °C. For clarity only a section of the measured range is shown. | ||
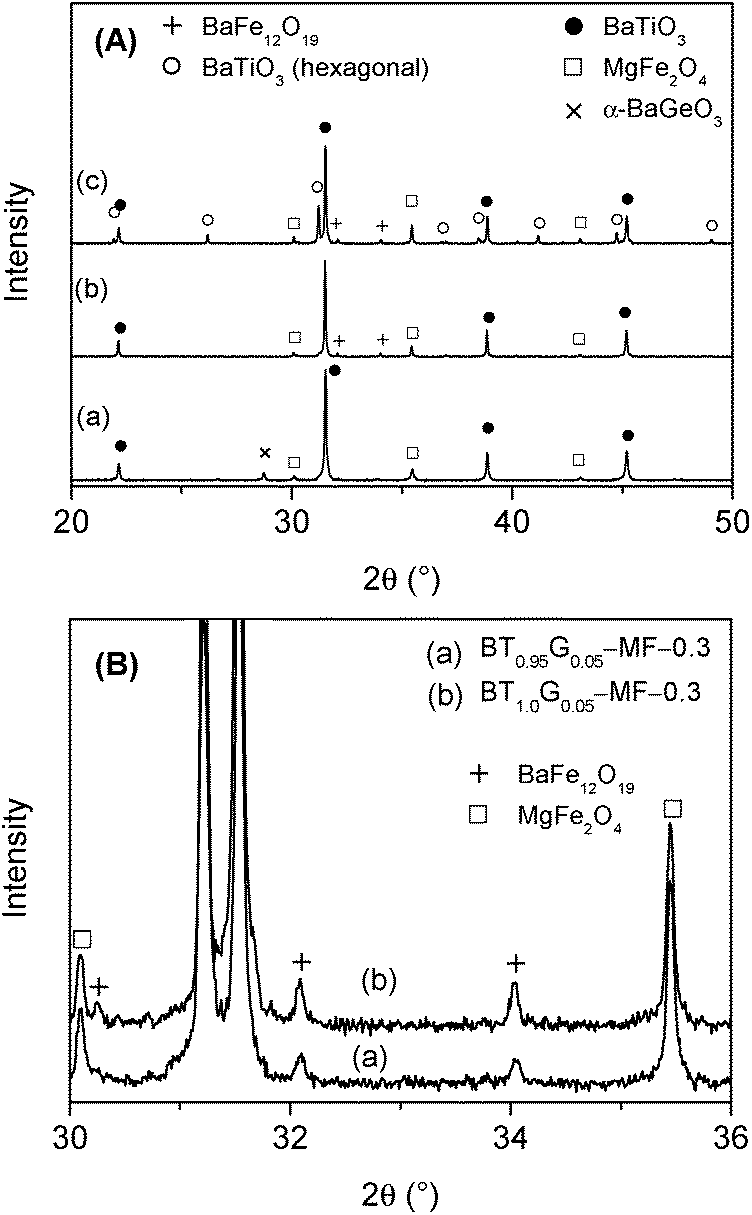 | ||
| Fig. 8 (A) Room temperature XRD patterns of ceramics after sintering of 1 h of (a) BT0.9G0.1–MF–0.3 sintered at 1100 °C, (b) BT1.0G0.05–MF–0.3 sintered at 1200 °C, and (c) BT1.0G0.05–MF–0.3 sintered at 1250 °C. For clarity only a section of the measured range is shown. (B) Detail of the XRD patterns in the range of 2θ = 30–36° of BT0.95G0.05–MF–0.3 and BT1.0G0.05–MF–0.3 sintered at 1250 °C. | ||
To suppress the formation of hexagonal BaTiO3 an excess of 5 mol% Ti, with respect to the Ba-content, was used in the BT1.0G0.05–MF–0.3 composite ceramics. As seen in Fig. 8A (Graph b) after sintering at 1200 °C no reflections of hexagonal BaTiO3 are detectable. Whereas, after sintering at 1250 °C of BT1.0G0.05–MF–0.3 the fraction of hexagonal BaTiO3 is not completely supressed but reduced from 54 mol% to 31 mol% (Fig. 8A, Graph c). Therefore, at higher sintering temperatures an excess of more than 5 mol% Ti is needed to completely avoid the formation of hexagonal BaTiO3. On the other hand, the titanium excess leads to an increase of BaFe12O19 as seen in Fig. 8B. This finding is in accordance with investigations by van den Boomgaard and Born10 on BaTiO3–Ni(Co,Mn)Fe2O4 composites that showed a continuous increase of BaFe12O19 with rising titanium excess, most likely cause by the partial replacement of Fe3+ ions in BaFe12O19 by Ti4+.48,49
3.3. Magnetic and dielectric measurements of ceramic bodies
Fig. 9A shows the M–H loops at 300 K of BT0.95G0.05–MF–0.3 ceramic bodies conventionally sintered between 1000 and 1200 °C for 1 h. Small coercivity values (Hc) up to 64 Oe and saturation magnetizations (Ms) of 7.9–9.1 emu g−1 were observed. Ms values were calculated by a linear extrapolation of the magnetization at highest field to H = 0, assuming the increase in magnetization at high-field is dominated by a paramagnetic contribution (see below). The values of Hc and Ms depend on the sintering temperature as seen in Fig. 9B. The coercivity values show a maximum at 1100 °C, whereas the Ms only slightly decreases for samples sintered between 1000 °C and 1100 °C. Sintering at higher temperatures leads to a stronger decrease of Ms. The reduction of Ms is probably due to the reaction between BaTiO3 and MgFe2O4. On the other hand cation redistribution between Mg2+ and Fe3+ and thus a change of the inversion parameter is also possible because a similar behaviour was observed in pure MgFe2O4 samples, too.50 | ||
| Fig. 9 (A) Magnetization (M) versus applied magnetic field (H) at 300 K for BT0.95G0.05–MF–0.3 ceramic bodies conventionally sintered at the indicated temperatures for 1 h. (B) Dependence of the saturation magnetization (Ms) and coercivity (Hc) on the sintering temperature (soaking time 1 h). | ||
Two-step sintering with T2 = 1000 °C and 900 °C leads to similar hysteresis loops at 300 K, which are characterized by Ms = 9.1 emu g−1 and Hc = 68 and 70 Oe, respectively (not shown).
Temperature-dependent magnetic measurements with an applied field of H = 60 kOe of a BT0.95G0.05–MF–0.3 ceramic sintered at 1000 °C show identical values under FC and ZFC conditions, therefore in Fig. 10 only the FC curve is presented. A slight increase at lowest temperatures was found in contrast to a pure MgFe2O4 ceramic sample indicating a minor paramagnetic contribution in the composites. This small paramagnetic moment is probably caused by diffusion of Fe-ions at the grain boundaries from the MgFe2O4 to the BaTiO3 phase.51–53
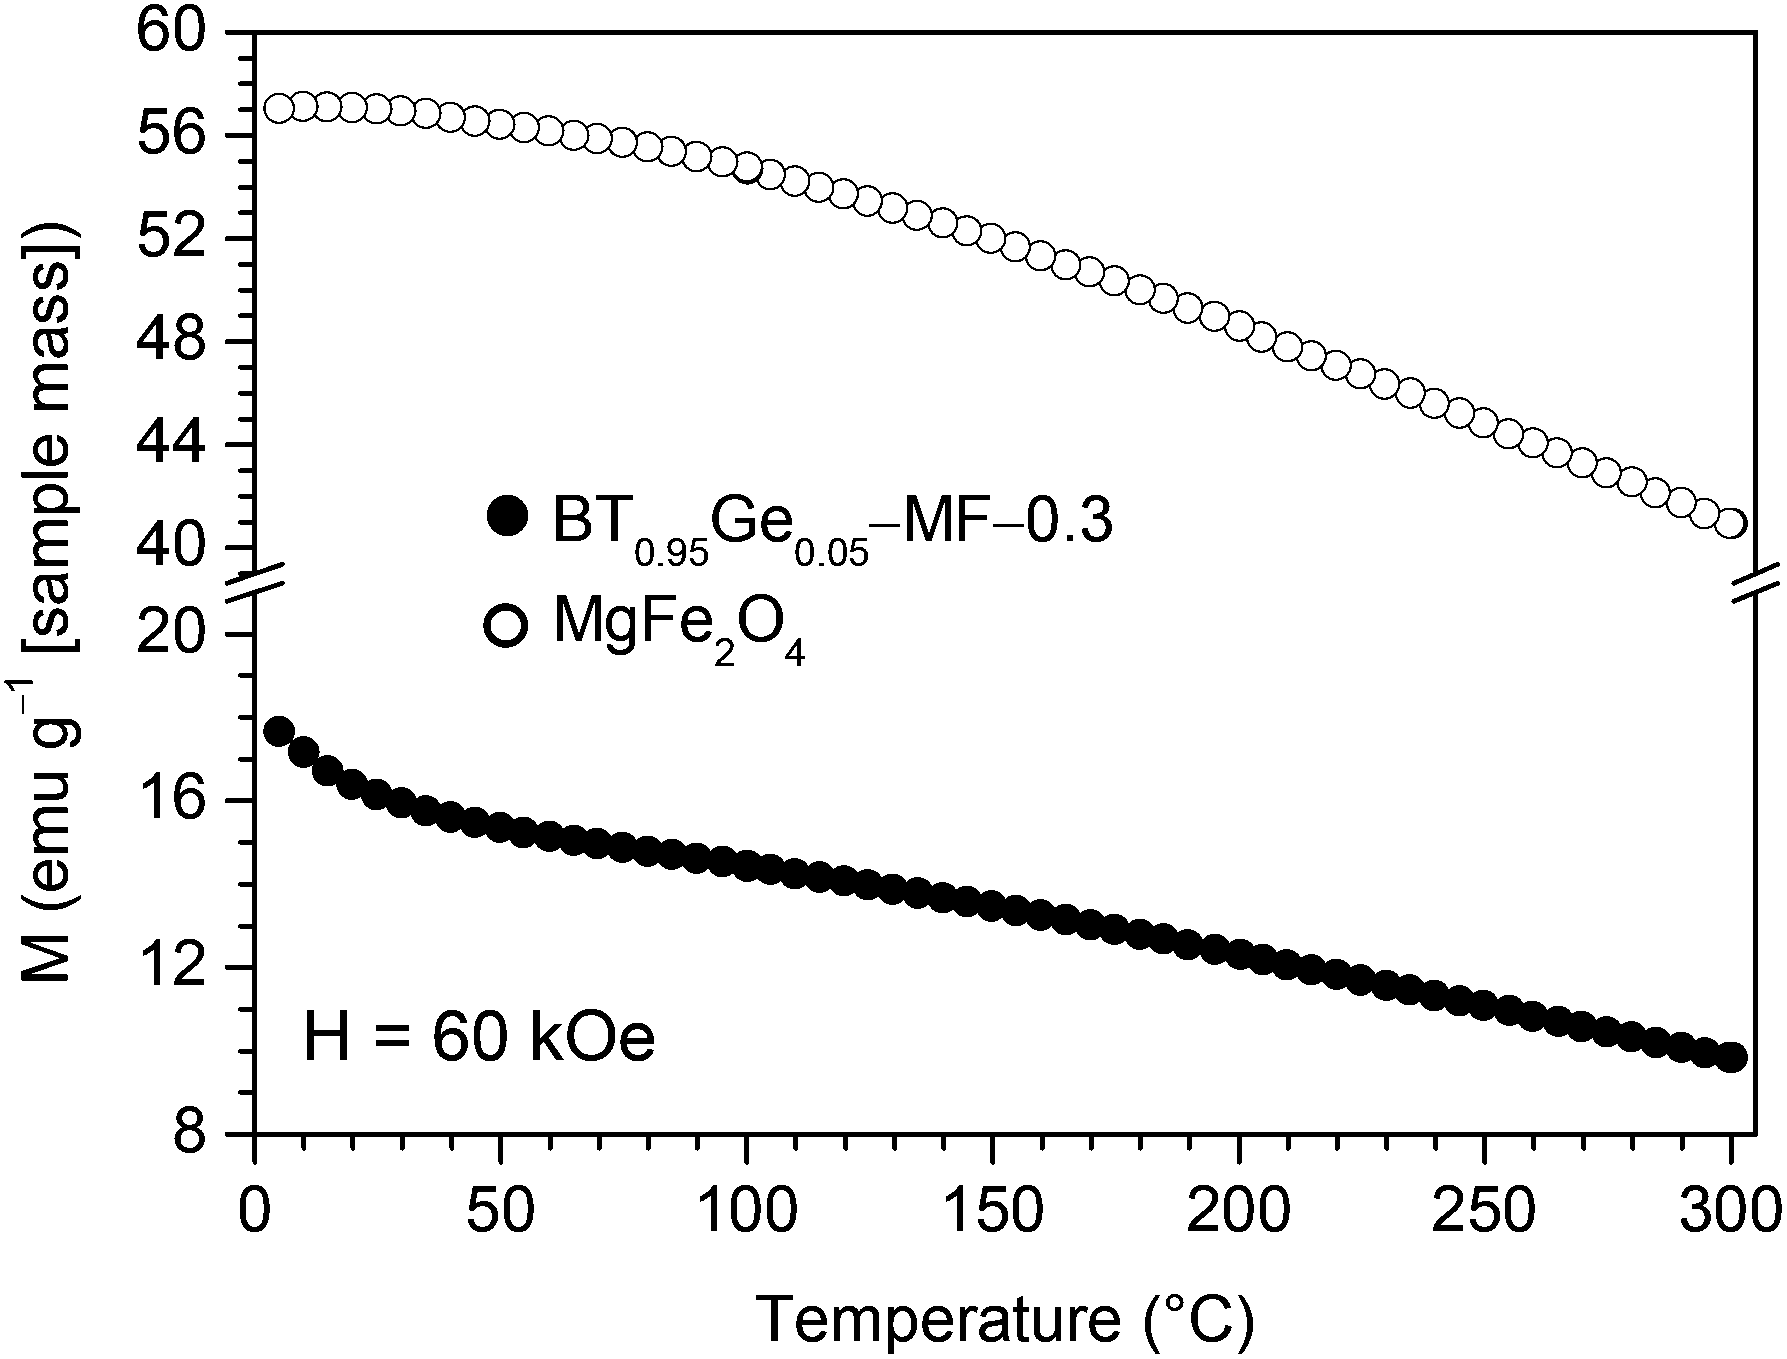 | ||
| Fig. 10 Temperature dependence (5–300 K) of the magnetization at H = 60 kOe under field-cooled (FC) conditions for BT0.95G0.05–MF–0.3 and pure MgFe2O4 ceramics both sintered at 1000 °C/1 h. | ||
Room-temperature dielectric measurements between 1 kHz and 13 MHz for BT0.95G0.05–MF–0.3 ceramics sintered under various conditions are shown in Fig. 11. All composite ceramics show slightly decreasing trends in the relative permittivity (εr) with increasing frequency (Fig. 11A) indicating dielectric dispersion due to the Maxwell–Wagner interface polarisation.54,55 The permittivities of conventionally sintered samples increase with rising sintering temperature because of increasing densities and grain-sizes of the ceramics. It is known that the permittivity depends on the porosity and thus on the density of ceramic bodies because of pore-charging effects.56,57 The dissipation factor (tan![[thin space (1/6-em)]](https://www.rsc.org/images/entities/char_2009.gif) δ) decreases for samples sintered at ≤1100 °C, whereas sintering at 1150 °C and 1200 °C leads to an increase of tanδ (Fig. 11B). The two-step sintered ceramic bodies show the lowest dissipation factors and the relative permittivities vary between 238–224 (T2 = 1000 °C) and 201–184 (T2 = 900 °C), respectively. The decrease of the dissipation factor and increase of εr of the two-step sintered ceramics, compared to the conventional sintered ones, is most likely due to the improved density and a decrease of lattice defects because of the long soaking time at low temperatures.58,59 Dielectric measurements on ceramic bodies of BT0.95G0.05–MF–0.3 and BT1.0G0.05–MF–0.3 sintered at 1200 °C (see insets in Fig. 11A and B) show that the titanium excess, needed for the suppression of hexagonal BaTiO3, only slightly influences the dielectric properties resulting in slightly higher εr and lower tanδ values.
δ) decreases for samples sintered at ≤1100 °C, whereas sintering at 1150 °C and 1200 °C leads to an increase of tanδ (Fig. 11B). The two-step sintered ceramic bodies show the lowest dissipation factors and the relative permittivities vary between 238–224 (T2 = 1000 °C) and 201–184 (T2 = 900 °C), respectively. The decrease of the dissipation factor and increase of εr of the two-step sintered ceramics, compared to the conventional sintered ones, is most likely due to the improved density and a decrease of lattice defects because of the long soaking time at low temperatures.58,59 Dielectric measurements on ceramic bodies of BT0.95G0.05–MF–0.3 and BT1.0G0.05–MF–0.3 sintered at 1200 °C (see insets in Fig. 11A and B) show that the titanium excess, needed for the suppression of hexagonal BaTiO3, only slightly influences the dielectric properties resulting in slightly higher εr and lower tanδ values.
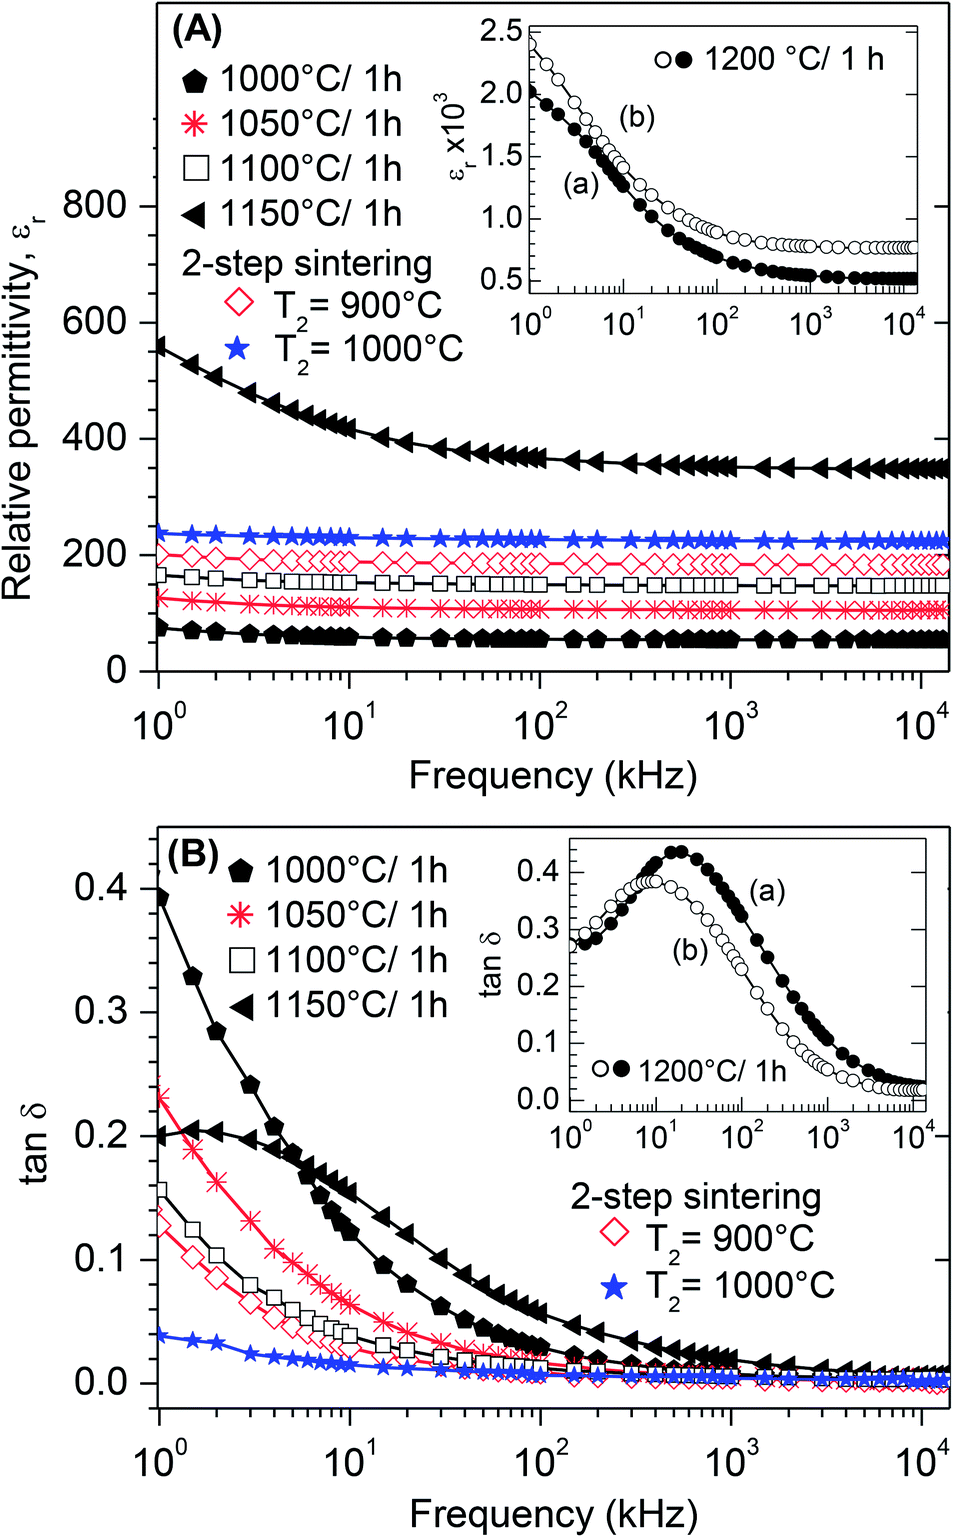 | ||
| Fig. 11 Frequency dependence of the room-temperature dielectric properties of composite ceramic bodies sintered at the indicated regimes. (A) Real part of the relative permittivity (εr) of BT0.95G0.05–MF–0.3 ceramics. The inset shows the permittivity of (a) BT0.95G0.05–MF–0.3 and (b) BT1.0G0.05–MF–0.3 ceramics. (B) Dissipation factor (tanδ) of composite ceramics. The inset shows tanδ of (a) BT0.95G0.05–MF–0.3 and (b) BT1.0G0.05–MF–0.3 ceramics. | ||
Fig. 12 demonstrates dielectric measurements of both BT0.95G0.05–MF–0.3 and BT–MF–0.3 (i.e. otherwise identical samples with and without BaGeO3 as sintering additive) composite ceramics after conventional sintering. Considerably higher permittivity values are obtained for BT0.95G0.05–MF–0.3 ceramics primarily due to their higher densities caused by the addition of BaGeO3.60 Up to a sintering temperature of 1150 °C the tanδ values of BT0.95G0.05–MF–0.3 are significantly lower than for the BT–MF–0.3 ceramics (inset in Fig. 12). The decrease of tanδ, resulting from the BaGeO3 addition, is probably related to the increase in grain boundary resistivity.61,62
 | ||
| Fig. 12 Frequency dependence of εr and tanδ at room temperature for BT0.95G0.05–MF–0.3 (solid symbols) and BT–MF–0.3 (open symbols) ceramic bodies conventionally sintered at the indicated temperatures. | ||
The development of the relative permittivity and the dissipation factor between −5 °C and 180 °C at a frequency of 1 kHz for selected BT0.95G0.05–MF–0.3 ceramics was additionally studied. Fig. 13A shows ceramics sintered up to 1100 °C, whereas samples sintered at 1150 and 1200 °C are represented in Fig. 13B. The relative permittivities of all samples considerably increase roughly above 50–70 °C and reach a maximum at about 170 °C. Similar temperature dependencies were found in various BaTiO3–ferrite ceramics.63–69 A clear ferroelectric/paraelectric phase transition of the BaTiO3 phase was not observed. The ceramic bodies consist of BaTiO3 grains less than 1.5 μm, which are known to lead to a reduction of the permittivity and to a flattening of the phase transition peak.70,71 Furthermore, reactions between BaTiO3 and MgFe2O4 at the grain boundaries lead to impurities and defects resulting in a lower tetragonality. Furthermore, it was shown elsewhere72 that the ferroelectric/paraelectric phase transition peak continuously decreases and disappears with increasing ferrite content. Investigations by Sakanas et al.55 and Gupta and Chatterjee73 revealed that the phase transition peaks of BaTiO3 are more visible at high frequencies because of the space charge polarisation in the composites. In fact our temperature depended dielectric measurements at a higher frequency of 1 MHz showed for a sample sintered at 1100 °C an anomaly between roughly 120 and 130 °C (inset in Fig. 13A) which can be assigned to a ferroelectric/paraelectric phase transition.73
 | ||
| Fig. 13 Temperature dependence of εr and tanδ at 1 kHz for BT0.95G0.05–MF–0.3 ceramic bodies. (A) Conventional sintering at 1000 and 1100 °C for 1 h and two-step-sintering at T2 = 1000 °C/20 h. The inset shows εr at 1 MHz after sintering at 1100 °C. (B) Conventional sintering at 1150 and 1200 °C for 1 h. | ||
4. Conclusions
The effect of the sintering additive BaGeO3 on MgFe2O4–BaTiO3 composites was investigated. Composite samples with a composition of 0.7× (BaTi0.95Ge0.5O3)–0.3× (MgFe2O4) were prepared by a one-pot Pechini-like synthesis. Calcination at 700 °C leads to a nano-sized powder showing a superparamagnetic behaviour. DTA investigations reveal the formation of a liquid phase with an onset temperature of 1164(3) °C. The addition of BaGeO3 clearly improved the densification process of compacted powders. Conventional sintering between 1000 and 1200 °C results in ceramic bodies with relative densities of 60–96%. A two-step sintering process at 1000 and 900 °C with a prolonged soaking time of 20 h results in relative bulk densities of 83 and 78% with grains between about 90 and 230 nm. Small traces of BaFe12O19 appear after sintering at 1150 °C and the partial formation of hexagonal BaTiO3 is observed at 1200 °C. Magnetic measurements reveal typical ferrimagnetic behaviour with coercivity values up to 70 Oe depending on the sintering procedure. Dielectric measurements show that the addition of BaGeO3 leads to an increase of the relative permittivity, whereas the dissipation factor slightly decreases. Additionally, it is shown that the sintering regime also influences the dielectric behaviour. Sintering at 1150 °C leads to dense and coarse-grained ceramic bodies possessing high εr and moderate tanδ values over a wide temperature range. On the other hand, fine-grained ceramic bodies with high densities can be obtained after a two-step sintering process showing relative permittivities up to 238 at room-temperature and the lowest tanδ values. The resulting composite ceramics are potential candidates for ME applications.
Acknowledgements
Financial support by the German Research Foundation within the Collaborative Research Centre (SFB 762) Functionality of Oxide Interfaces is gratefully acknowledged.Notes and references
- C.-W. Nan, M. I. Bichurin, S. Dong, D. Viehland and G. Srinivasan, J. Appl. Phys., 2008, 103, 031101 CrossRef.
- J. Ma, J. Hu, Z. Li and C.-W. Nan, Adv. Mater., 2011, 23, 1062–1087 CrossRef CAS PubMed.
- J. F. Scott, Nat. Mater., 2007, 6, 256–257 CrossRef CAS PubMed.
- J. Ryu, S. Priya, K. Uchino and H.-E. Kim, J. Electroceram., 2002, 8, 107–119 CrossRef CAS.
- R. S. Devan and B. K. Chougule, J. Appl. Phys., 2007, 101, 014109 CrossRef.
- P. Zhu, Q. Zheng, R. Sun, W. Zhang, J. Gao and C. Wong, J. Alloys Compd., 2014, 614, 289–296 CrossRef CAS.
- Y. Liu, Y. Wu, D. Li, Y. Zhang, J. Zhang and J. Yang, J. Mater. Sci.: Mater. Electron., 2014, 24, 1900–1904 CrossRef.
- R. Liu, Y. Thao, R. Huang, Y. Zhao and H. Zhou, J. Mater. Chem., 2010, 20, 10665–10670 RSC.
- L. V. Leonel, J. B. Silva, A. S. Albuquerque, J. D. Ardisson, W. A. A. Macedo and N. D. S. Mohallem, J. Phys. Chem. Solids, 2012, 73, 1362–1371 CrossRef CAS.
- J. van den Boomgaard and R. A. J. Born, J. Mater. Sci., 1978, 13, 1538–1548 CrossRef CAS.
- M. M. Sutar, A. N. Tarale, S. R. Jigajeni, S. B. Kulkarni, V. R. Reddy and P. B. Joshi, Solid State Sci., 2012, 14, 1064–1070 CrossRef CAS.
- R. Grigalaitis, M. M. Vijatović Petrović, J. D. Bobić, A. Dzunuzovic, R. Sobiestianskas, A. Brilingas, B. D. Stojanović and J. Banys, Ceram. Int., 2014, 40, 6165–6170 CrossRef CAS.
- L. M. Hrib and O. F. Caltun, J. Alloys Compd., 2011, 509, 6644–6648 CrossRef CAS.
- S. Y. Tan, S. R. Shannigrahi, S. H. Tan and F. E. H. Tay, J. Appl. Phys., 2008, 103, 094105 CrossRef.
- R. Tadi, Y.-I. Kim and K.-S. Ryu, J. Korean Phys. Soc., 2012, 61, 1545–1549 CrossRef CAS.
- R. Tadi, Y.-I. Kim, D. Sarkar, C. Kim and K.-S. Ryu, J. Magn. Magn. Mater., 2011, 323, 564–568 CrossRef CAS.
- R. Köferstein, T. Walther, D. Hesse and S. G. Ebbinghaus, J. Alloys Compd., 2015, 638, 141–147 CrossRef.
- J.-H. Lee, Y.-W. Heo, J.-A. Lee, Y.-D. Ryoo, J.-J. Kim and S.-H. Cho, Solid State Ionics, 1997, 101–103, 787–791 CrossRef CAS.
- D. Völtzke and H.-P. Abicht, Solid State Sci., 2000, 2, 149–159 CrossRef.
- R. Köferstein, L. Jäger and S. G. Ebbinghaus, J. Mater. Sci., 2010, 45, 6521–6527 CrossRef.
- L. Geske, V. Lorenz, T. Müller, L. Jäger, H. Beige, H.-P. Abicht and V. Mueller, J. Eur. Ceram. Soc., 2005, 25, 2537–2542 CrossRef CAS.
- W. Ling, H. Zhang, Y. Li, D. Chen, Q. Wen and J. Shen, J. Appl. Phys., 2010, 107, 09D911 CrossRef.
- A. Francis and W. Daoush, J. Mater. Process. Technol., 2007, 181, 213–216 CrossRef CAS.
- N. Kitahara, H. Kageyama, T. Kawasaki, K. Abe, H. Itoh and J. Takahashi, J. Ceram. Soc. Jpn., 2013, 121, 54–61 CrossRef CAS.
- K. Li, D.-L. Shi, Y. Zhu, Y. Wang, H. L. Chan and S. Peng, Mater. Chem. Phys., 2013, 143, 34–40 CrossRef CAS.
- R. Köferstein, L. Jäger, M. Zenkner, F. J. Garcia-Garcia and S. G. Ebbinghaus, J. Mater. Sci., 2010, 45, 3784–3790 CrossRef.
- Y.-C. Lee, W.-H. Lu, S.-H. Wang and C.-W. Lin, Int. J. Miner., Metall. Mater., 2009, 16, 124–127 CrossRef CAS.
- Program WinXPOW v2.11, Stoe & Cie GmbH, Darmstadt, 2004 Search PubMed.
- K. Kamishima, Y. Nagashima, K. Kakizaki, N. Hiratsuka, K. Watanabe, T. Mise, H. Naganuma and S. Okamura, J. Phys. Soc. Jpn., 2008, 77, 064801 CrossRef.
- R. Köferstein, L. Jäger, M. Zenkner and H.-P. Abicht, J. Mater. Sci., 2008, 43, 832–838 CrossRef.
- M. Zenkner, L. Jäger, R. Köferstein and H.-P. Abicht, Solid State Sci., 2008, 10, 1556–1562 CrossRef CAS.
- J. P. Guha and D. Kolar, J. Mater. Sci., 1972, 7, 1192–1196 CrossRef CAS.
- International Centre for Diffraction Data, PDF-2/Release 2008, BaTiO3 [00-81-2201]tetragonal, BaTiO3 [00-82-1175]hexagonal, MgFe2O4 [00-71-1232]cubic, BaFe12O19 [00-84-757]hexagonal, BaCO3 [00-5-378]orthorhombic, BaGeO3 [01-075-4952]monoclinic.
- V. D. Allred, S. R. Buxton and J. P. McBride, J. Phys. Chem., 1957, 61, 117–120 CrossRef CAS.
- W. Schatt, Sintervorgänge, VDI-Verlag, Düsseldorf, 1992, pp. 78–100 Search PubMed.
- W. Schatt, Z. Metalkde., 1989, 80, 809–816 CAS.
- W. Schatt and E. Friedrich, Key Eng. Mater., 1988, 29–31, 73–88 CrossRef.
- D. Völtzke and H.-P. Abicht, Solid State Sci., 2000, 2, 149–159 CrossRef.
- R. Köferstein, L. Jäger, M. Zenkner, T. Müller and H.-P. Abicht, Mater. Chem. Phys., 2008, 112, 531–535 CrossRef.
- A. Recnik and D. Kolar, J. Am. Ceram. Soc., 1996, 79, 1015–1018 CrossRef CAS.
- I.-W. Chen and X.-H. Wang, Nature, 2000, 404, 168–171 CrossRef CAS PubMed.
- S. Lee, C. A. Randall and Z.-K. Liu, J. Am. Ceram. Soc., 2007, 90, 2589–2594 CrossRef CAS.
- T. A. Vanderah, J. M. Loezos and R. S. Roth, J. Solid State Chem., 1996, 121, 38–50 CrossRef CAS.
- R. Böttcher, H. T. Langhammer, T. Müller and H.-P. Abicht, J. Phys.: Condens. Matter, 2008, 20, 505209 CrossRef.
- N. Maso, H. Beltran, E. Cordoncillo, P. Escribano and A. R. West, J. Mater. Chem., 2006, 16, 1626–1633 RSC.
- S. Jayanthi and T. R. N. Kutty, J. Mater. Sci.: Mater. Electron., 2008, 19, 615–626 CrossRef CAS.
- J. Jeong and Y. H. Han, Phys. Chem. Chem. Phys., 2003, 5, 2264–2267 RSC.
- V. A. M. Brabers, A. A. E. Stevens, J. H. J. Dalderop and Z. Simsa, J. Magn. Magn. Mater., 1999, 196–197, 312–314 CrossRef CAS.
- M. H. Shams, S. M. A. Salehi and A. Ghasemi, Mater. Lett., 2008, 62, 1732–1733 CrossRef.
- R. Köferstein, T. Walther, D. Hesse and S. G. Ebbinghaus, J. Mater. Sci., 2013, 48, 6509–6518 CrossRef.
- S. Ray, P. Mahadevan, S. Mandal, S. R. Krishnakumar, C. S. Kuroda, T. Sasaki, T. Taniyama and M. Itoh, Phys. Rev. B: Condens. Matter Mater. Phys., 2008, 77, 104416 CrossRef.
- X. K. Wei, Y. T. Su, Y. Sui, Q. H. Zhang, Y. Yao, C. Q. Jin and R. C. Yu, J. Appl. Phys., 2011, 110, 114112 CrossRef.
- S. Qiu, W. Li, Y. Liu, G. Liu, Y. Wu and N. Chen, Trans. Nonferrous Met. Soc. China, 2010, 20, 1911–1915 CrossRef CAS.
- K. W. Wagner, Arch. Elektrotech., 2014, 2, 371–387 CrossRef.
- A. Sakanas, R. Grigalaitis, J. Banys, L. Mitoseriu, V. Buscaglia and P. Nanni, J. Alloys Compd., 2014, 602, 241–247 CrossRef CAS.
- K. Okazaki and K. Nagata, J. Am. Ceram. Soc., 1973, 56, 82–86 CrossRef CAS.
- C.-C. Hsueh, M. L. Mecartney, W. B. Harrison, M. R. B. Hanson and B. G. Koepke, J. Mater. Sci. Lett., 1989, 8, 1209–1216 CrossRef CAS.
- J. S. Kim, S. Y. Lee, H. J. Lee, C. W. Ahn, I. W. Kim and M. S. Jang, J. Electroceram., 2008, 21, 633–636 CrossRef CAS.
- Y. Noguchi, I. Miwa, Y. Goshima and M. Miyayama, Jpn. J. Appl. Phys., 2000, 39, L1259–L1262 CrossRef CAS.
- R. W. Rice, Porosity of ceramics, M. Dekker Inc., New York, 1998, pp. 354–359 Search PubMed.
- P. Kantha, N. Pisitpipathsin, K. Pengpat, G. Rujijanagul, R. Guo and A. S. Bhalla, Ferroelectrics, 2011, 425, 27–38 CrossRef CAS.
- F. Amaral, L. C. Costa and M. A. Valente, J. Non-Cryst. Solids, 2011, 357, 775–781 CrossRef CAS.
- V. V. Shartsman, F. Alawneh, P. Borisov, D. Kozodaev and D. C. Lupascu, Smart Mater. Struct., 2011, 20, 075006 CrossRef.
- L. Curecheriu, P. Postolache, V. Buscaglia, N. Hochidan, M. Alexe and L. Mitoseriu, Phase Transform., 2013, 86, 670–680 CrossRef CAS.
- C. M. Kanamadi, J. S. Kim, H. K. Yang, B. K. Moon, B. C. Choi and J. H. Jeong, Appl. Phys. A, 2009, 97, 575–580 CrossRef CAS.
- X. Qi, J. Zhou, Z. Yue, Z. Gui, L. Li and S. Buddhudu, Adv. Funct. Mater., 2004, 14, 920–926 CrossRef CAS.
- L. P. Curecheriu, M. T. Buscaglia, V. Buscaglia, L. Mitoseriu, P. Postolache, A. Ianculescu and P. Nanni, J. Appl. Phys., 2010, 107, 104106 CrossRef.
- K. Raidongia, A. Nag, A. Sundaresan and C. N. R. Rao, Appl. Phys. Lett., 2010, 97, 062904 CrossRef.
- D. Hgosh, H. Han, J. C. Nino, G. Subhash and J. L. Jones, J. Am. Ceram. Soc., 2012, 95, 2504–2509 CrossRef.
- G. Arlt, D. Hennings and G. de With, J. Appl. Phys., 1985, 58, 1619–1625 CrossRef CAS.
- R. Köferstein, L. Jäger, M. Zenkner and S. G. Ebbinghaus, Mater. Chem. Phys., 2010, 119, 118–122 CrossRef.
- Z. Yu and C. Ang, J. Mater. Sci.: Mater. Electron., 2002, 13, 193–196 CrossRef CAS.
- A. Gupta and R. Chatterjee, J. Eur. Ceram. Soc., 2013, 33, 1017–1022 CrossRef CAS.
| This journal is © The Royal Society of Chemistry 2015 |