
Novel Mass Bio System (MBS) and its potential application in advanced treatment of coal gasification wastewater†
Salma Tabassum*a,
Yun Wangb,
Xiaojun Zhangb and
Zhenjia Zhang*a
aSchool of Environmental Science and Engineering, Shanghai Jiao Tong University, Shanghai 200240, China. E-mail: ustb456@sjtu.edu.cn; salmazenith@gmail.com; zjzhang@sjtu.edu.cn; Fax: +86 021 54740836; Tel: +86 15221195745
bState Key Laboratory of Microbial Metabolism, School of Life Sciences & Biotechnology, Shanghai Jiao Tong University, Shanghai 200240, China
First published on 13th October 2015
Abstract
In this study, a Novel Mass Bio System (MBS), a suspended biologically activated carbon granular carrier cubic particle with 2–5mm side length and 1.02–1.08 specific gravity was developed for advanced treatment of coal gasification wastewater. A laboratory scale anaerobic AnaEG (advanced anaerobic expanded granular sludge bed)–primary aerobic BioAX (a novel environmental biotechnological aerobic process with internal circulation)–MBS aerobic fluidized bed nitrification bioreactor–MBS expended bed denitrification bioreactor–secondary aerobic BioAX reactor system was operated over a period of 260 days. With an influent concentration of chemical oxygen demand (COD) 3000 mg L−1, total phenol (TP) 300 mg L−1, and ammonium nitrogen (NH4+-N) 149 mg L−1, the effluent COD, TP, NH4+-N, could be decreased to 159 mg L−1, 6 mg L−1 and 0.12 mg L−1, respectively. The maximum removal efficiencies of COD, TP, and NH4+-N were respectively 94.7%, 98%, and 99.9%. With hydraulic retention time (HRT) of 36 h, methane content was 60% and methane productivity was 0.11 L CH4/g COD. Pyrosequencing analysis showed the enrichment of ‘rare microbes’. Contrary to expectation, nitrifying bacteria, Ohtaekwangia (Bacteroidetes) was the most abundant rare bacteria with 37.1% of the microbial community entrapped in MBS.
1. Introduction
The most strenuous pollution control task for coal gasification plants is the treatment of coal gasification wastewater. Coal gasification wastewater (CGW) which is similar to coking wastewater is a complex and toxic industrial wastewater.1 The typical COD and TP concentration in CGW was as high as 20![[thin space (1/6-em)]](https://www.rsc.org/images/entities/char_2009.gif) 000 mg L−1 and 5000 mg L−1, respectively. The main contaminants in the wastewater are phenol, cyanide, thiocyanate, ammonium2 and so on, and most of them have been reported to be carcinogenic and mutative refractory organics.3,4
000 mg L−1 and 5000 mg L−1, respectively. The main contaminants in the wastewater are phenol, cyanide, thiocyanate, ammonium2 and so on, and most of them have been reported to be carcinogenic and mutative refractory organics.3,4
In order to meet the discharge standard, a series of physiochemical and biological processes are usually employed together, including ammonia stripping, solvent extraction, anaerobic, aerobic system followed by membrane and crystallization technologies.5,6 Although, this dual process is very effective, but still confronts with some issues, like complicated technology, large area is occupied, along with secondary pollution produced, such as extra sludge from biological process.7
It was reported that an anaerobic–aerobic combined process had superior performance in the degradation of high concentrations of organic matter. However, the traditional aerobic process is ineffective for wastewater containing high concentrations of ammonia nitrogen. Partly due to the presence of refractory and toxic compounds in wastewater, the growth of the nitrifying bacteria or other specially designed microbes in the aeration basin is restrained.8 Another explanation of the inadequate nitrification is that ammonia and nitrite oxidizing bacteria are difficult to remain alive in conventional activated sludge system, as they have lower proliferation rate and are very easily washed out from the aeration tank.9,10
Compared with conventional processes, the advantages of cell entrapment within polymeric gels, includes protection of cell washout, high cell concentration, high nitrification rates, long biomass retention time even under short hydraulic retention time (HRT), ease of solid liquid separation which can be obtained simply by a screen11 and protection from extreme conditions12 for example, temperature and variations in load and pollution levels.13
Various efforts had been done by our research group in the past.14–17 However, little effort has been made so far to evaluate the nitrification activity of gel carriers of microorganisms for coal gasification wastewater treatment. To solve this engineering challenge, the immobilisation technique is to be used in this study; immobilized nitrifying and denitrifying bacteria (MBS) are being considered for application in ammonia nitrogen and NO3−-N removal. MBS is an advanced biological water purification product. This cubic particle includes microbial liquid, bamboo powdered activated carbon and waterborne polyurethane gel mixed in a proper ratio.
A laboratory scale: anaerobic AnaEG (advanced anaerobic expanded granular sludge bed, A1)18 reactor–primary BioAX (a novel environmental biotechnological aerobic process with internal circulation, O1)19–MBS aerobic fluidized bed (nitrification bioreactor, M1)–MBS expended bed (denitrification bioreactor, M2)–secondary BioAX (aerobic reactor, O2) system A1–O1–M1–M2–O2 was developed, as shown in Fig. 1, to investigate the treatment ability of nitrifying and denitrifying bacteria entrapped in waterborne polyurethane gel, assessment of its treatment efficiency in advanced treatment of coal gasification wastewater in our laboratory that finally meets final effluent national standards20,21 in spite of great fluctuation of water quality and the presence of bio-refractory organic pollutants.
 | ||
| Fig. 1 Processing flow chart of the coal gasification wastewater treatment (A1–O1–M1–M2–O2) system (a) anaerobic sludge bed A1 (b) primary BioAX aerobic O1 (c) MBS fluidized bed nitrification bioreactor M1 (d) MBS expended bed denitrification bioreactor M2 (e) secondary BioAX aerobic reactor O2. | ||
2. Materials and methods
2.1. Preparation of MBS
The preparation of MBS takes place in 5 steps. The Step 1 was microbial concentrated solution was cultivated in our lab, and then this microbial concentrated solution was mixed with tap water to form a microbial liquid. The microbial liquid is measured with mixed liquor volatile suspended solids (MLVSS) concentration, and its value is 2000–30000 mg L−1;
Step 2 was to add the powdered activated carbon into the microbial liquid, concentration of the bamboo powdered activated carbon is measured with the mass percentage of the cubic particles, and its value is 3–8%; concentration of the waterborne polyurethane gel. It was mixed uniformly to get the microbial activated carbon composite particulate liquid; after that in Step 3 was to add the waterborne polyurethane gel into the microbial activated carbon composite particulate liquid, it was mixed uniformly to get microbial activated carbon composite liquid; in the Step 4 to initiate polymerization, initiator & catalyst were added into the microbial activated carbon composite liquid. The mixture was allowed to stand for 5–30 min at 25–35 °C. Eventually, immobilized nitrobacteria pellets MBS was obtained in the form of hydrosol solid with a shape resembling jelly bean; the last Step 5 was to cut the hydrosol solid mechanically and finally to get cubic particles with 2–5 mm side length.
2.2. Process illustration
A schematic description of A1–O1–M1–M2–O2 system is shown in Fig. 1. Effective volume of (A1) 13.6 L, (O1) 17.6 L, (M1) 17.6 L, (M2) 9.6 L and (O2) 17.6 L, respectively. Temperature of anaerobic reactor AnaEG (A1) was maintained at 35 ± 1 °C. All the other reactors were operated at 27 ± °C controlled by thermostats.After phenol extraction and ammonia stripping pre-treatment, the coal gasification wastewater enters A1 reactor to conduct hydrolytic acidification. Most phenol and a part of total phenols are removed in this unit also aiming of removing COD by a large margin, and refractory organic matters are decomposed to easily-degradable low molecular weight organic matters by hydrolytic acidification bacteria, thus improving the biodegradability of wastewater and making the water quality conducive to aerobic biological treatment (O1). The anaerobic effluent enters primary BioAX reactor, and through metabolism of aerobic heterotrophic bacteria, volatile phenols and most of the total phenols are removed in the wastewater along with further removal of COD.
The third reactor (M1) is designed for the removal of NH4+-N (to NOx) in which aerobic autotrophic bacteria plays an important role, and nitrifying bacteria are embedded in the form of MBS, through nitrification of nitrifying bacteria, most ammonia nitrogen are converted to nitrate nitrogen in the M1 reactor. Now the effluent enters the M2 reactor aimed to conduct denitrification. Under anaerobic conditions, heterotrophic facultative denitrifying bacteria embedded in the form of MBS, deoxidize NO3− and NO2− to nitrogen, and methyl alcohol was added as additional carbon source, remove nitrate nitrogen. Denitrifying effluent enters subsequent secondary BioAX (O2) aerobic reactor and through decomposition of aerobic heterotrophic bacteria, further removes excess carbon source. These five reactors are working synergistically, making the final effluent to meet efficiently national effluent standards.20,21
2.3. Coal gasification wastewater
The coal gasification wastewater used in this study was collected from the wastewater treatment plant at Coal Long Hua Harbin Coal Chemical Industry Co. Ltd, Harbin, China. The concentration of ammonia and phenol in wastewater was decreased by pre-treatment using ammonia stripping and phenol extraction. Despite that it contained many toxic and refractory compounds. The typical composition of Harbin CGW after physicochemical pre-treatment are listed in Table 1. In three batches wastewater was collected. The batch I was normal effluent of physicochemical process having the concentration of COD was 1500 mg L−1, TP 230 mg L−1, ammonia nitrogen 130 mg L−1, approximately from (1–134 days). The second batch was also from the effluent of physicochemical pre-treatment process during shutdown phase having the COD (2000–3300 mg L−1) and TP (300 mg L−1) from 135–215 days, third batch COD (3300–3400 mg L−1) and TP 350 mg L−1 from 216–260 days much higher than that in batch I.| Parameters | I batcha | II and III batchb |
|---|---|---|
| a Normal effluent of physicochemical process.b Effluent during shutdown. | ||
| TCOD (mg L−1) | 1500 | 2200–4700 |
| SCOD (mg L−1) | 1500 | 2200–4700 |
| Total phenols (mg L−1) | 230 | 270–350 |
| Volatile phenol (mg L−1) | 130 | 150 |
| Total nitrogen (mg L−1) | 150 | 188 |
| Ammonia (mg L−1) | 130 | 160 |
| Nitrate (mg L−1) | 20 | 27.5 |
| Nitrite nitrogen (mg L−1) | Undetected | Undetected |
| Total phosphorus (mg L−1) | 2.2 | 3.4 |
| Suspended solids (SS) (mg L−1) | 8 | 20 |
| pH | 7.6–8.0 | 7.0–7.6 |
| Alkalinity (mg L−1) CaCO3 calculated | 320 | 260 |
| Turbidity (NTU) | 25 | 42 |
| Chromaticity (times) | 30, dark brown | 50, brownish red |
2.4. Operating conditions
At the initial stage of start-up period A1 and O1 reactor were started. Gradually the load was increased and HRT was shortened, the optimum HRT of each reactor were determined as shown in Fig. 2a and Table S1.† After 80 days, M1 bioreactor was initiated to remove ammonia nitrogen. Methyl alcohol was added as carbon source in M2 to remove NO3−-N. Aerobic O2 reactor was further used to remove excess carbon source.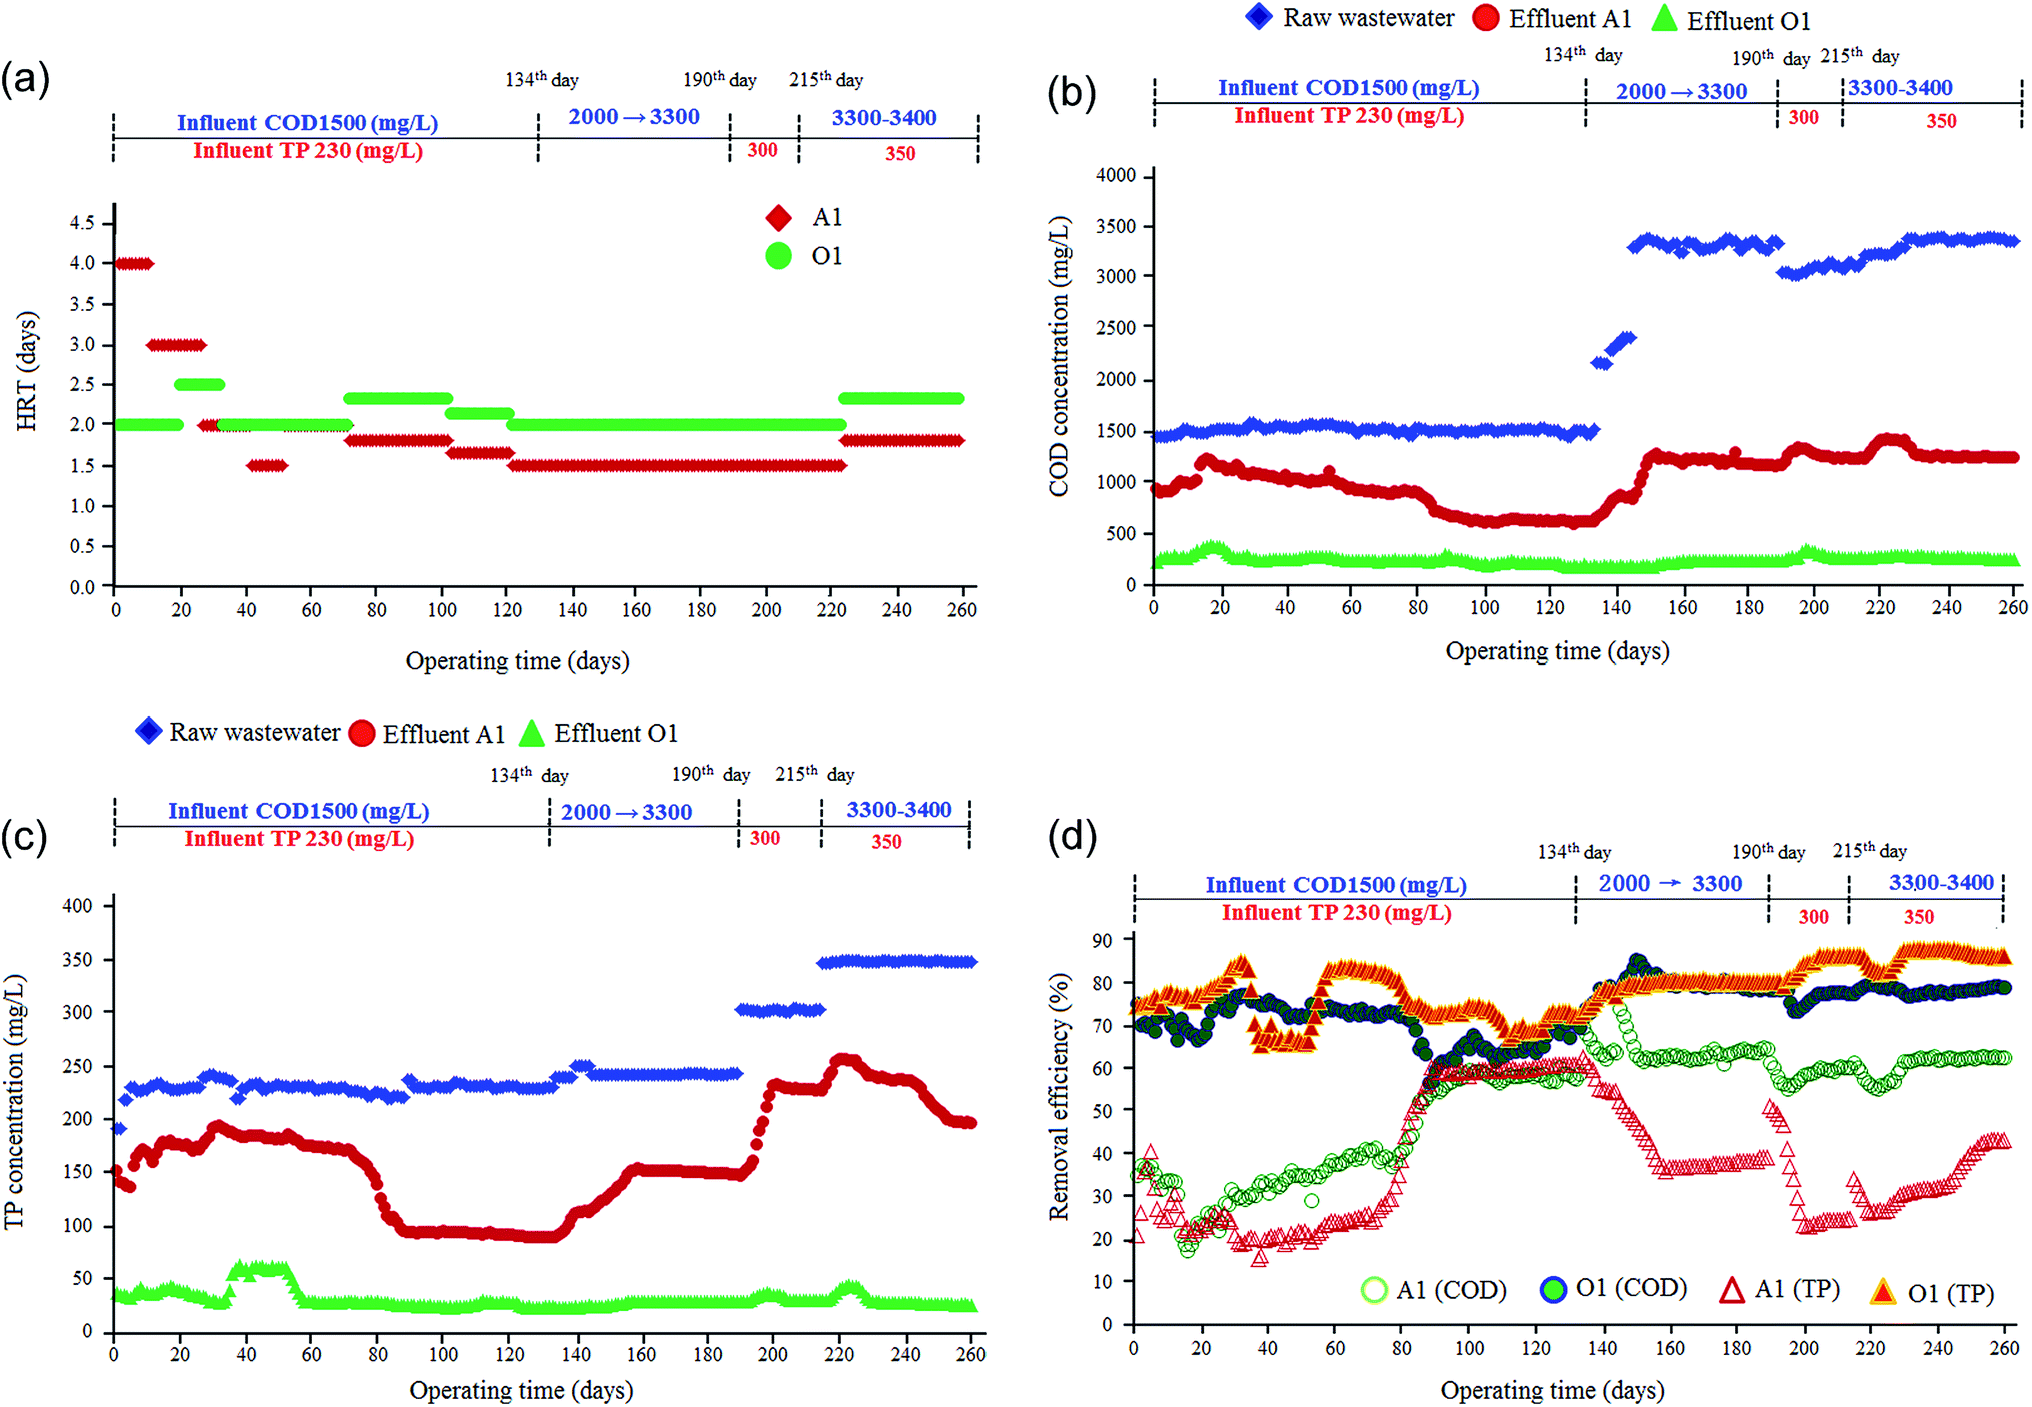 | ||
| Fig. 2 Variation in (a) HRT (b) COD (c) total phenol (d) removal efficiency of COD and total phenols in anaerobic A1–aerobic section O1 of (A1–O1–M1–M2–O2) system. | ||
2.5. Inoculated sludge
The anaerobic sludge bed reactor (A1) inoculated sludge was obtained from the digested sludge in Lu Village, Wuxi China wastewater treatment plant. The inoculated content was 40% of anaerobic reactor effective volume. The inoculated sludge O1 and O2 was collected from activated sludge aeration tank in the second wastewater treatment plant in Suzhou Industrial Park having mixed liquor suspended solids (MLSS) around 3000 mg L−1. M1 was inoculated with the immobilized nitrobacteria pellets 15–20%, M2 bioreactor was inoculated with the immobilized nitrobacteria pellets 60–70% as listed in Table S1.†2.6. Analytical methods
Wastewater quality analysis such as COD (Fast Airtight Catalysis and Digestion Method), TP and volatile phenols were measured by the bromide volumetric method and predistillation-bromide volumetric method,22 NH4+-N (salicylate spectrophotometric method), NO3−-N (UV spectrophotometry), NO2−-N determined by N-(1-naphthyl)-ethylenediamine spectrophotometry method. Biogas production was measured volumetrically using a wet gas flow meter and biogas composition analysis was analysed by gas chromatographs (GC): SHIMADZU GC-14B; gas chromatography mass spectrometer (GC-MS): Agilent 7890-5975 GC-MS. The pH measurements were performed with an electrode (Crison Instruments, S.A., 52-03) equipped with an automatic compensatory temperature device (Crison Instruments, S.A., 21-910-01) and connected to a measure instrument (pH mV−1). Microorganism in the biomass were observed using a scan electron microscope (Digital SEM Leica 440 at 20 kV) controlled with a computer system.2.7. DNA sequencing and sequence analysis
The target region of V1–V3 region of the 16S rRNA gene was amplified with primers PF (5′-CGTATCGCCTCCCTCGCGCCATCAGACGAGTGCGTAGAGTTTGATYM-TGGCTCAG-3′) and PR (5′-CTATGCGCCTTGCCAGCCCGCTCAG![[N with combining low line]](https://www.rsc.org/images/entities/char_004e_0332.gif)
![[- with combining low line]](https://www.rsc.org/images/entities/char_002d002d_0332.gif) ATTACCGCGGCTGCTGG-3′).
ATTACCGCGGCTGCTGG-3′).
A unique DNA barcode of eight nucleotides, which was shown as underlined 8 N in the PR primer, was used to differentiate the sequences that were amplified from different samples.23 The 25 μL reaction mixture and PCR conditions were described in a previous study.24 After the amplicon length and concentration were estimated, an equimolar mixture of all the amplicon products was purified with a Gel/PCR DNA Fragments Extraction Kit (Geneaid, UKAS). Pyrosequencing was performed using the FLX Titanium system.25
2.8. Analysis of 16S rRNA sequences using the QIIME pipeline
16S rRNA sequence data was processed by the quantitative insights into microbial ecology (QIIME) pipeline.26 Briefly, sequences that were less than 300 bp or greater than 700 bp in length, contained incorrect primer sequences, or contained more than 1 ambiguous base were discarded. The remaining sequences were assigned sample aliquots based on their unique nucleotide barcodes, including error-correction.27 Chimeric sequences were removed using Chimera Slayer.28 Sequences were clustered into Operational Taxonomic Units (OTUs) based on their sequence similarity at 97% sequence similarity using UCLUST.29 A representative sequence for each OTU was chosen for downstream analysis based on the most abundant sequence from each OTU. PyNAST was used to align sequences with a minimum length of 150 bp and a minimum percent identity of 75%.30 OTUs were assigned to a taxonomy using the Ribosomal Database Project (RDP) Naive Bayes classifier (training set 10) with the confidence level set at 0.8 (http://rdp.cme.msu.edu).31 β-Diversity (diversity between groups of samples) was used to generate principal coordinate plots for each sample using un-weighted and weighted UniFrac distances.32–342.9. Nucleotide sequence accession number
The sequence information that was obtained in this study was deposited in the GenBank NCBI's Sequence Read Archive (SRP061400) database.3. Results and discussion
3.1. Degradation performance under different HRT
The initial concentration of COD and TP in the influent of reactor A1 was maintained around 1500 mg L−1 and 230 mg L−1. With the continual proceeding of the test, COD and TP in the effluent of anaerobic exhibit an obvious downward trend. When HRT of reactor A1 was shortened to 36 h, COD was between 630–600 mg L−1 and TP was lower than 90 mg L−1 after 70 days in the effluent of reactor A1 (Fig. 2b and c).As can be seen from Fig. 2d, the average removal efficiencies of COD and TP of reactor A1 gradually increases. Although HRT was shortened continually, the removal efficiencies were still increasing. At HRT 36 h, the removal efficiency of COD was close to 60%, and TP, was over 60%. Daily gas production was stable (methane was over 60%).After stable operation of reactor O1, effluent COD remains lower than 300 mg L−1. When HRT was 48 h, COD of the effluent was lower than 200 mg L−1 (Fig. 2b). Influenced by the continual decrease of COD in reactor A1, removal efficiency of reactor O1 slightly exhibits a downward trend (Fig. 2d). After 100 days of operation, COD, TP and ammonia nitrogen in the effluent of reactor O1 were about 220 mg L−1, 28 mg L−1 (Fig. 2), 20–30 mg L−1 (Fig. 3a), respectively. The better performance of reactor O1 could be possibly attributed to the presence of aerobic bacteria on the surface of the bio-filler. The specially designed plastic packing in O1 reactor which contains high concentration of high-efficiency microbial species which are capable of degrading organic compounds.1,19
 | ||
| Fig. 3 Variation in (a) ammonia nitrogen concentration (b) NO3−-N concentration (c) gas production (d) pH changes of (A1–O1–M1–M2–O2) system. | ||
After 73 days of running, reactor O2 was initiated and after 80 days of running. Reactor M1 was initiated. When (A1–O1–M1–M2–O2) system was adopted, at later stage (after 100 days), COD, TP and NH4-N of the final effluent of the system are 80 mg L−1, 9 mg L−1, 0.4–0.6 mg L−1, respectively. The results indicates that, after adding the reactor M1, the concentration of ammonia nitrogen of the biochemical system decreases significantly and was lower than 1 mg L−1 in the final effluent (Fig. S1(a)).† Meanwhile, COD and TP are further reduced as well Fig. S1(b and c).†
The effective volumes of reactor M1 and M2 are 17.6 L and 9.6 L, respectively. Due to large volume of the reactor, it is rather difficult to shorten the HRT in successive operational experiments. To discuss the optimum HRT subsequent, intermittent experiment of MBS ammonia nitrogen removal and MBS denitrification were performed (S1 and S2).
3.2. Performance of reactor M1 and M2 in continuous operation of (A1–O1–M1–M2–O2) system
In this stage, the reactor M1 with controlled HRT 4 h was initiated with the effluent from reactor O1 to check the changes in the concentration of ammonia nitrogen (145th day to 210th day, Fig. 3a). Most NH4+-N was converted into NO3−-N and its concentration sharply decreased under the nitrification of nitrobacteria in reactor O1 from 90 to 133 day, the NH4+-N conc. of reactor O1 effluent was 20–35 mg L−1, but from 145 to 210th day, the effluent NH4+-N was less than 3.5 mg L−1 (Fig. 3a). It was obvious that nitrification of reactor O1 was significantly improved. The reactor O1 effluent enters M1 reactor (HRT 4 h), NH4+-N conc. of reactor M1 effluent was lower than 0.2 mg L−1 with average removal efficiency of NH4+-N 90%. The results indicate that MBS fluidized bed can efficiently remove NH4+-N when HRT was 4 h. To investigate the removal of NO3−-N, the effluent of reactor M1 enters reactor M2 (with dosage of methyl alcohol; 0.8 mL methyl alcohol/L H2O) HRT 6 h.Fig. 3b shows the NO3−-N concentration changes of the system from 145 to 210th day. Under the effect of nitrobacteria, in reactor M1 NH4+-N was converted into NO3−-N. Therefore, NO3−-N conc. in reactor M1 was higher than that of reactor O1 effluent. After denitrification, NO3−-N rapidly decreases from 160–165 mg L−1 to 2 mg L−1. The removal efficiency of NO3−-N reaches up to 98%. NO3−-N of O2 effluent was 0.2 mg L−1 lower than that of reactor M2 (denitrification). The results indicated that reactor M2 can maintain good denitrification effect when HRT was 6 h. After 133 days of continuous running, HRT and water quality analysis of each section are summarized in Table 2. As seen in Table 2 ammonia nitrogen conc. in A1 effluent was slightly higher than that in influent. The main reason for this is that anaerobic bacteria decompose nitrogenous heterocyclic compounds and release NH4+-N.8,35
| Raw wastewater | Anaerobic sludge bed (A1) | Primary BioAX aerobic (O1) | MBS aerobic fluidized bed nitrification bioreactor aerobic (M1) | MBS expended bed denitrification bioreactor (M2) | Secondary BioAX aerobic reactor (O2) | |
|---|---|---|---|---|---|---|
| Operating days (200) | ||||||
| HRT | 1.5 d | 2 d | 4 h | 6 h | 4 h | |
| COD (mg L−1) | 3000 | 1200 | 300 | 250 | NM | 159 |
| TP (mg L−1) | 300 | 230 | 30 | 26 | 18 | 6 |
| NH4-N (mg L−1) | 149 | 152 | <1.0 | 0.12–0.2 | — | |
|
||||||
| Operating days (90) | ||||||
| HRT | 1.7 d | 2.1 d | 8 h | 16 h | 2.1 d | |
| COD (mg L−1) | 1500 | 600 | 220 | 170 | NM | 80 |
| TP (mg L−1) | 230 | 100 | 26 | 22 | 15 | 9 |
| NH4-N (mg L−1) | 130 | 140 | <30 | 5 | 4 | 0.4–0.6 |
3.3. COD concentration impact assessment (134 to 189 day)
In practical coal gasification wastewater treatment systems, in order to prevent accidents, it is necessary to investigate the effect of influent COD concentration on the performance of the biochemical treatment system. The purpose of this section is to investigate the influence of the COD impact load on (A1–O1–M1–M2–O2) system. In this stage, the system feed with wastewater of batch II and batch III from 134 to 189 days. With influent (COD 2200–4700 mg L−1, TP 270 mg L−1, NH4+-N 160 mg L−1), COD conc. in the influent rises from 1500 mg L−1 to 3300 mg L−1.Fig. 2b and d show that, from day 134, COD of influent gradually rises from 1500 mg L−1 to 3300 mg L−1. COD of reactor A1 effluent rises from 620 mg L−1 to 1200 mg L−1, and TP rises from 90 mg L−1 to 150 mg L−1 removal efficiency of COD was basically stable, and for TP, it declines from 60% to 40%. That is to say, when HRT of reactor A1 and O1 are 36 h and 48 h, respectively, increasing COD load of the influent mainly influences the reactor A1 effluent, and basically reactor O1 effluent was not affected.
Fig. 3c shows the influences of increasing COD load on gas production. From Fig. 3d, increasing COD load basically does not have an influence on the pH of anaerobic and aerobic section. Still in normal pH ranges, the activity of anaerobic and aerobic bacteria is not affected. Daily gas production of anaerobic section rises from 1.7 L to 3.1 L, and increases with the increase of COD load. Methane production maintains 0.11 L CH4/g COD. Although COD load was increased, methanogens are still in normal pH ranges and their activity was not affected. So, methane production remains unchanged.
From Fig. 3a, after 140th day, NH4+-N concentration of aerobic section further decreases and nitrification performance continually improves due to the continual domestication of nitrifying bacteria of aerobic section and the maintenance of pH lead to the continual increase of the activity of nitrifying bacteria and improve the proceeding of the conversion from NH4+-N to NO3−-N of aerobic section.1
The results of the test indicate that, this system can bear coal gasification wastewater with COD 3300 mg L−1, and does not affect the final effluent and gas production. After 250 days of continuous running, 5.3% of COD in coal gasification wastewater cannot be removed by biochemical treatment methods. These components are related to the characteristics of extraction agents in phenol ammonia recycling, types of coal and gasifier, which need further study.
3.4. Total phenol concentration impact assessment from 190–242 days
From 190th day, batch II and III wastewater (COD 2200–4700 mg L−1, TP 270 mg L−1, NH4+-N 160 mg L−1), total phenols of the influent rises from 240 mg L−1 to 350 mg L−1 was feed in the system. Fig. 2d shows the removal efficiencies of COD and TP. Although the removal efficiency of TP of anaerobic section declines, reactor O1 was hardly affected (Fig. 2c).Fig. 3 shows the changes of gas production, pH and NH4+-N concentration after increasing TP load of the influent. Increasing TP load basically does not influence the pH and NH4+-N of anaerobic and aerobic section. Still in normal pH ranges, the activity of anaerobic and aerobic bacteria was not affected. When TP concentration of the influent rises from 240 mg L−1 to 300 mg L−1, daily gas production of anaerobic section rises from 1.7 L to 3.1 L, and increases with the increase of COD load. When TP conc. of influent further increased from 300 mg L−1 to 350 mg L−1, gas production of anaerobic section significantly declines. Although methanogens are still in normal pH ranges, their activity were inhibited due to the influences of TP conc. this leads to reduction in gas production.
In order to attempt to restore the activity of methanogens, from 225th day, HRT of reactor A1 was increased from 36 h to 43.2 h, and for reactor O1, HRT from 48 h to 55.2 h. Up to 242th day, gas production does not restore to the original level.
3.5. Three-dimensional (3D) mesh structure of MBS
The molecular chain of the polymer is three dimensional (3D) mesh structure; its mesh size is nanoscale as shown in Fig. 4a. Meanwhile, biological activated particles constitute a primary battery. The negative electrode is the microorganisms on the surface layer and the positive electrode is the central activated carbon granules. The microorganisms on the negative electrode get H+ through the positive electrode and reduce NO3−-N to N2, achieving denitrification effect as shown in Fig. 4a. The suspended biological activated carbon granular carriers are made from NH4+-N nitrobacteria. After desiccation, the scanning electron microscope (SEM) photos of the granular carriers and NH4+-N nitrobacteria are showed in Fig. 4b, respectively.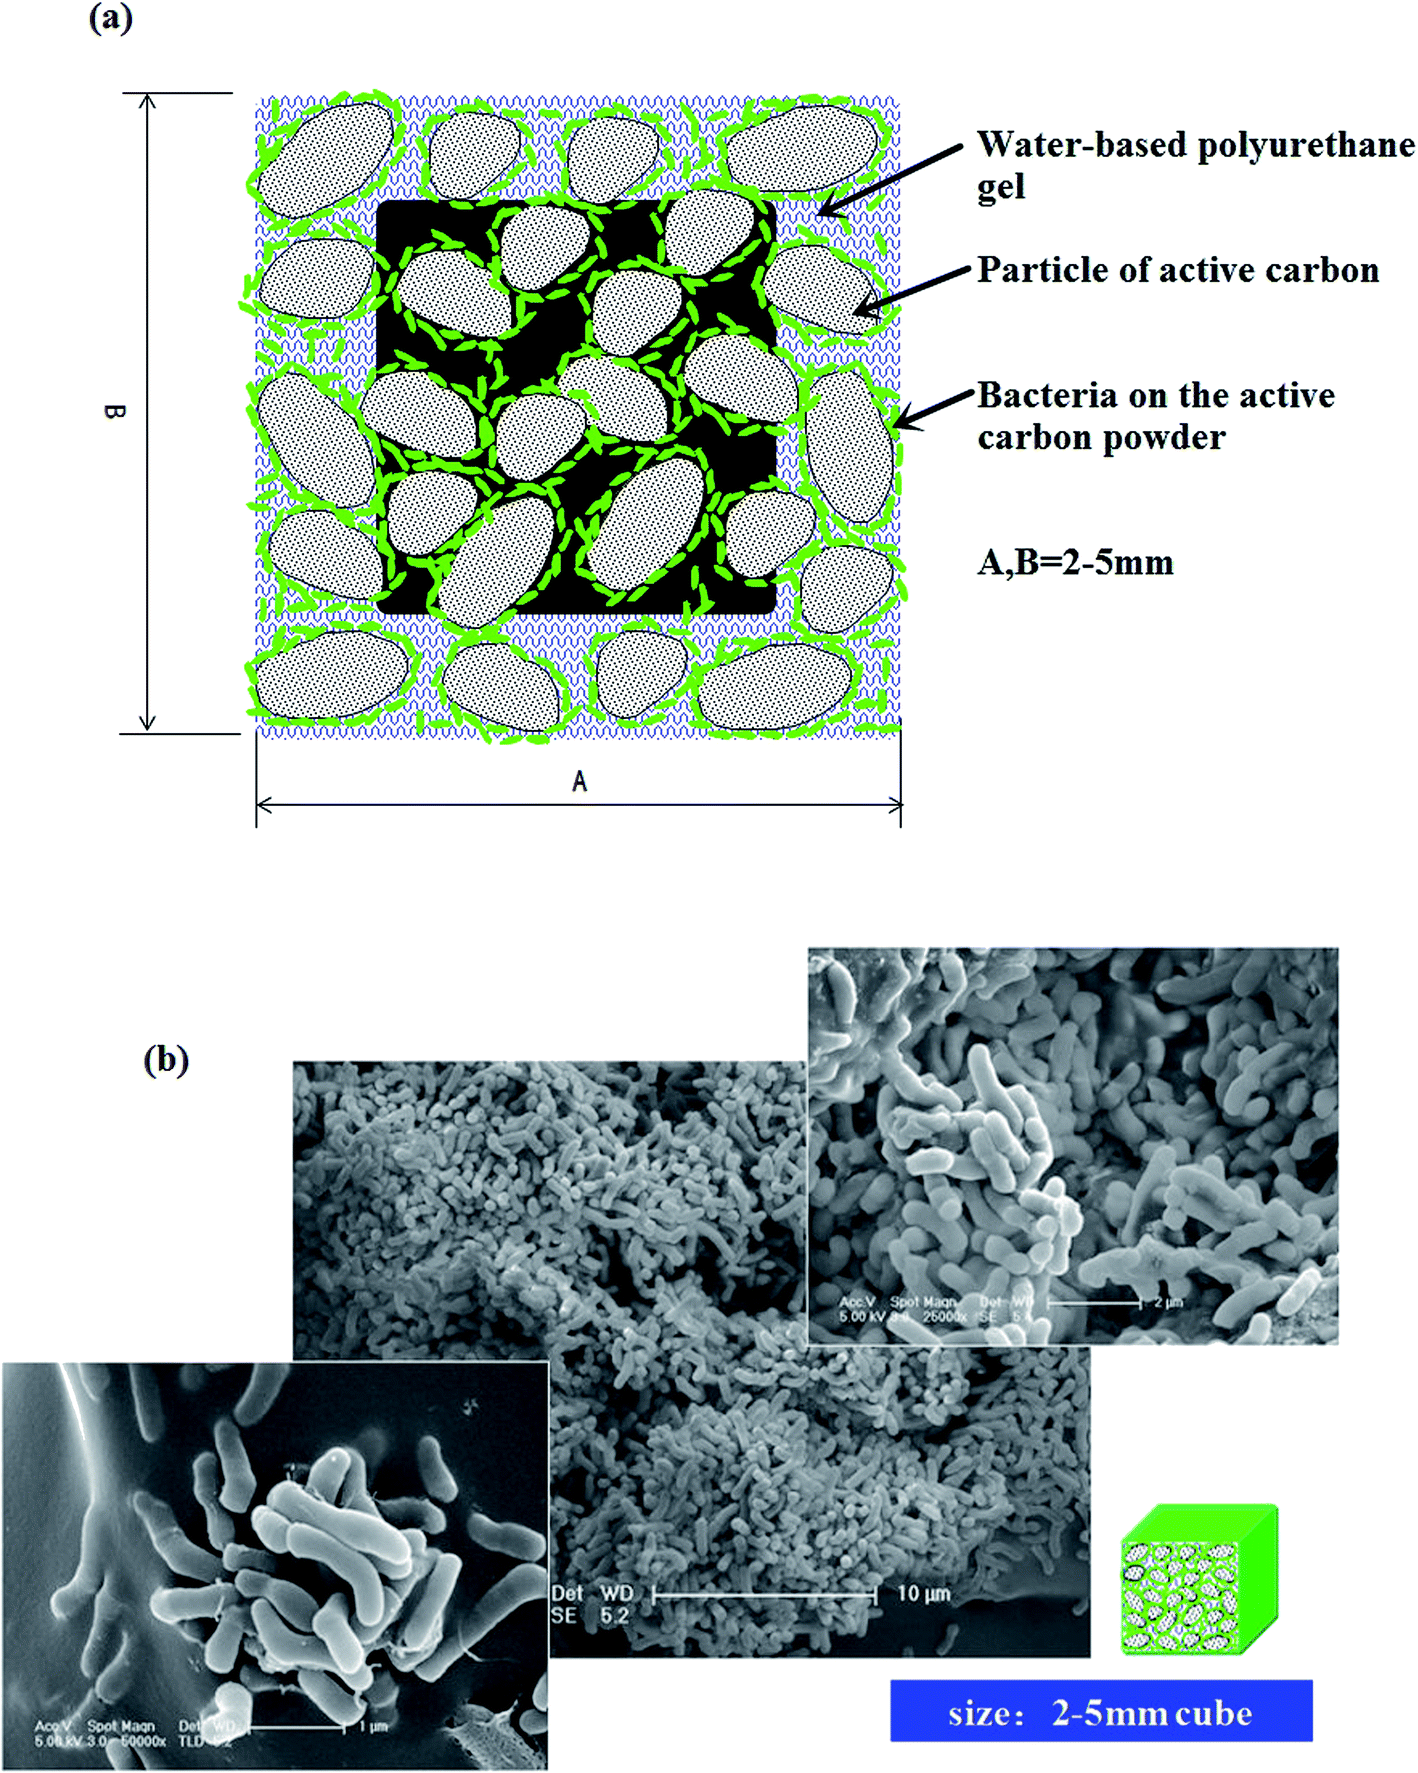 | ||
| Fig. 4 (a) Structure of Novel Mass Bio System (MBS) immobilized bacteria biological active carbon suspended pellets, and (b) MBS Scanning Electron Micrograph (reproduce with permission from Ronser Bio-Tech Sdn Bhd, Malaysia). | ||
3.6. Diversity of the microbial community
Fig. 5 illustrates the morphology of the bacteria in each reactor; it exhibit high diversity. However, further PCR method revealed that each reactor especially MBS has more diversity of bacteria than that implied by the SEM images. Fig. 6a shows the predominant bacterial phyla are Proteobacteria, Bacteroidetes, Chloroflexi, Firmicutes and so on. As shown in Fig. 6b In the A1 reactor, the high abundance of Syntrophorhabdus (17.9%), Bellilinea (11.76%) and longilinea (12.6%) belonging to phylum Chloroflexi populations suggesting that they likely played an important role in the methanogenic communities associated with phenol degradation agreed with the previous findings.36–38 Syntrophorhabdus are filamentous microorganism and bamboo shaped cells38 while Bellilinea are beautifully line-shaped organism that grow strictly under anaerobic conditions39 (Fig. 5b and c). | ||
| Fig. 5 (a) Appearance of MBS pellets; SEM images of bacteria in (b) & (c) anaerobic sludge bed A1; (d) primary BioAX aerobic O1 (e) & (f) MBS pellets in fluidized bed nitrification bioreactor M1; (g) & (h) MBS pellets in expended bed denitrification bioreactor M2; (i) secondary BioAX aerobic reactor O2. | ||
 | ||
| Fig. 6 (a) Predominant bacterial groups in samples at phyla level (b) heat map of genera occurring at >1% abundance in at least one sample. Scale bar on the left shows the variation of the normalized abundance of the genera in the (A1–O1–M1–M2–O2) system. | ||
In the O1 reactor, the bacteria from Mesorhizobium was as high as 10.2% in abundance in the sequence analysis result, which may be represented by the rods like bacteria in the SEM, Fig. 5d. Their role as carbon source utilization and phenol degradation in the activated sludge of the industrial wastewater has been described previously.40,41
In the M1 reactor in MBS pellets, as based on the wastewater composition, Proteobacteria would be expected to be predominant in this reactor. Yet, the nitrifying bacteria Ohtaekwangia (Bacteroidetes) was the most abundant bacteria (37.1%) but it was absent in other reactor. The reason for this is that the dead and lysed cells of the autotrophs were likely the carbon source for the heterotrophic bacteria.42 Based on the reports of Song et al.43 We hypothesize that the Ohtaekwangia might be nitrifier and degrader in the reactor. They are strictly aerobic, long and displayed swarming edges44 as can be seen in the Fig. 5e and f.
In the M2 reactor in MBS pellets, Thauera (10.5%) was present which was predominantly catalyzed in anaerobic nitrogen removal by denitrification in the wastewater treatment systems24,45 other bacteria that were present were Methylotenera (9.5%) and so on (Fig. 5g and h).
In the O2 reactor, the bacteria from Fibrisoma dominated the bacterial community (22.8% in abundance). Fibrisoma was described as a filamentous heterotrophic bacteria belonging to the phylum Bacteroidetes, (Fig. 5i) they play an important role in removing the excess carbon source46 other bacteria that were present were Bacillus (10.4%).
3.7. Estimation of energy consumption
Energy consumption during anaerobic sludge bed-primary BioAX aerobic-MBS fluidized bed-MBS denitrification-secondary BioAX aerobic reactor (A1–O1–M1–M2–O2) system treatment (excluding nitrification reactor) was done. If water flow rate 150 m3 h−1, than anaerobic reactor A1 influent pump power consumption, if pump selection P 202A/B/C, power: 15 kW, 1 unit power consumption will be 360 kW h then Electricity cost: 0.10 $ per kW h × 360 kW h per day = 36 $ per day.For reactor O1 (blower energy consumption) flow 37.5 m3 min−1, power: 55 kW, 1 units power consumption will be 1320 kW h, then Electricity cost: 0.10 $ per kW h × 1320 kW h per day = 132 $ per day.
For reactor M2 influent pump power consumption, if pump selection P 307A/B, power: 0.25 kW, 1 unit power consumption will be 6 kW h then Electricity cost: 0.10 $ per kW h × 6 kW h per day = 0.6 $ per day.
For reactor O2 (blower energy consumption), flow 37 m3 min−1, power: 37 kW, 1 units power consumption will be 888 kW h, then
| Electricity cost: 0.10 $ per kW h × 888 kW h per day = 88.8 $ per day. |
4. Conclusion
This study presents a laboratory attempt to explore the possibility of applying MBS as a sustainable technology for wastewater treatment and to guide its future application on industrial scale. The MBS has moderate specific gravity, an acceptable combination of activated carbon and microorganism, and a stable treatment effect. Beside, the preparation method is simple and practicable. The system possesses higher ability to resist COD and TP impact load, effluent was more stable. Although the removal of ammonia along with the other pollutants from coal gasification wastewater is a complicated process this system treated it efficiently, effectively and simultaneously with excellent removal efficiency of COD, TP, NH4+-N, 94.7%, 98%, 99.9%, respectively. There is no obvious changes in the amount of sludge in each reactor of the whole set of device after one-year of continuous running, which means that there is no need to discharge excess sludge that is also an added advantage of the process and will possess competitiveness in future industrial application. Nonetheless, coal wastewater treatment process we used does have the potential to become a sustainable process.Acknowledgements
The authors express their gratitude to the School of Environmental Science and Engineering and also School College of Life Science and Biotechnology, Shanghai Jiao Tong University for providing the research facilities. This study was financially supported by the National Natural Science Foundation of China (NSFC 21177086) and by China National Offshore Oil Corporation: CNOOC group (Research project on coal gasification wastewater treatment technology 2010–2014). The authors would also like to express their gratitude to Ronser Bio-Tech Sdn Bhd, Malaysia for providing Permission to reproduce images that appear on the website http://www.ronserbio.com/v2/2014/10/14/mass-bio-system-mbs/# and the authors would like to extend their special thanks to Dr Pua Eng Teck, CEO, Ronser Bio-Tech Sdn Bhd, Malaysia for valuable cooperation in contributing to the success of this study.References
- Z. Wang, X. Xu, Z. Gong and F. Yang, J. Hazard. Mater., 2012, 235–236, 78–84 CrossRef CAS PubMed.
- D. Bamelis, Rev. Metall., 1992, 132–145 Search PubMed.
- Q. Ji, S. Tabassum, C. Chu, C. Li and Z. Zhang, Adv. Mater. Res., 2014, 1049–1050, 39–43 CrossRef.
- Z. J. Yu, Y. Chen, D. C. Feng and Y. Qian, Ind. Eng. Chem. Res., 2010, 49, 2874–2881 CrossRef CAS.
- M. K. Ghose, Water Res., 2002, 36, 1127–1134 CrossRef CAS PubMed.
- A. Sánchez Sánchez, J. M. Garrido and R. Méndez, Desalination, 2010, 250, 810–814 CrossRef.
- Y. Wang, S. Wang, Y. Guo, D. Xu, Y. Gong, X. Tang and J. Zhang, Environ. Prog. Sustainable Energy, 2014, 33, 1258–1265 CAS.
- Z. Wang, X. Xu, J. Chen and F. Yang, J. Environ. Chem. Eng., 2013, 1, 899–905 CrossRef CAS.
- L. Amor, M. Eiroa, C. Kennes and M. C. Veiga, Water Res., 2005, 39, 2915–2920 CrossRef CAS PubMed.
- Y.-Q. Liu, J.-H. Tay, V. Ivanov, B. Y.-P. Moy, L. Yu and S. T.-L. Tay, Process Biochem., 2005, 40, 3285–3289 CrossRef CAS.
- H. Asano, H. Myoga, M. Asano and M. Toyao, Water Sci. Technol., 1992, 26, 1037–1046 CAS.
- M. Morita, N. Kudo, H. Uemoto, A. Watanabe and H. Shinozaki, Eng. Life Sci., 2007, 7, 587–592 CrossRef CAS.
- T. Sumino, H. Nakamura, N. Mori, Y. Kawaguchi and M. Tada, Appl. Microbiol. Biotechnol., 1992, 36, 556–560 CrossRef CAS.
- Y. Dong, Z. Zhang, Y. Jin, Z. Li and J. Lu, J. Environ. Sci., 2011, 23, 366–371 CrossRef CAS.
- Z. Li, Z. Zhang, J. Li and Z. Zhang, Biodegradation, 2009, 20, 859–865 CrossRef CAS PubMed.
- Y. Dong, Z. Zhang, Y. Jin, J. Lu, X. Cheng, J. Li, Y.-y. Deng, Y.-N. Feng and D. Chen, J. Environ. Sci., 2012, 24, 999–1005 CrossRef CAS.
- Z. Li, Z. Zhang and Z. Zhang, J. Environ. Biol., 2014, 35, 759–763 Search PubMed.
- C. Li, S. Tabassum and Z. Zhang, RSC Adv., 2014, 4, 57580–57586 RSC.
- C. Li, S. Tabassum and Z. Zhang, RSC Adv., 2014, 4, 35156–35162 RSC.
- in Pollutants discharge plant in China, State Environmental Protection Administration of China, GB 18918–2002.
- in Standard of Water Pollutants for Iron and Steel Industry ed. China, China, GB13456–92.
- APHA, Standard Methods for the examination of water and wastewater, ed. AWWA, APHA, Washington DC, 20 edn, 1999 Search PubMed.
- C. Zhang, M. Zhang, S. Wang, R. Han, Y. Cao, W. Hua, Y. Mao, X. Zhang, X. Pang and C. Wei, ISME J., 2009, 4, 232–241 CrossRef PubMed.
- X. Zhang, S. Yue, H. Zhong, W. Hua, R. Chen, Y. Cao and L. Zhao, Appl. Microbiol. Biotechnol., 2011, 91, 425–434 CrossRef CAS PubMed.
- M. Margulies, M. Egholm, W. E. Altman, S. Attiya, J. S. Bader, L. A. Bemben, J. Berka, M. S. Braverman, Y. J. Chen, Z. Chen, S. B. Dewell, L. Du, J. M. Fierro, X. V. Gomes, B. C. Godwin, W. He, S. Helgesen, C. H. Ho, G. P. Irzyk, S. C. Jando, M. L. Alenquer, T. P. Jarvie, K. B. Jirage, J. B. Kim, J. R. Knight, J. R. Lanza, J. H. Leamon, S. M. Lefkowitz, M. Lei, J. Li, K. L. Lohman, H. Lu, V. B. Makhijani, K. E. McDade, M. P. McKenna, E. W. Myers, E. Nickerson, J. R. Nobile, R. Plant, B. P. Puc, M. T. Ronan, G. T. Roth, G. J. Sarkis, J. F. Simons, J. W. Simpson, M. Srinivasan, K. R. Tartaro, A. Tomasz, K. A. Vogt, G. A. Volkmer, S. H. Wang, Y. Wang, M. P. Weiner, P. Yu, R. F. Begley and J. M. Rothberg, Nature, 2005, 437, 376–380 CrossRef CAS PubMed.
- J. G. Caporaso, J. Kuczynski, J. Stombaugh, K. Bittinger, F. D. Bushman, E. K. Costello, N. Fierer, A. G. Peña, J. K. Goodrich, J. I. Gordon, G. A. Huttley, S. T. Kelley, D. Knights, J. E. Koenig, R. E. Ley, C. A. Lozupone, D. McDonald, B. D. Muegge, M. Pirrung, J. Reeder, J. R. Sevinsky, P. J. Turnbaugh, W. A. Walters, J. Widmann, T. Yatsunenko, J. Zaneveld and R. Knight, Nat. Methods, 2010, 7, 335–336 CrossRef CAS PubMed.
- M. Hamady, J. J. Walker, J. K. Harris, N. J. Gold and R. Knight, Nat. Methods, 2008, 5, 235–237 CrossRef CAS PubMed.
- B. J. Haas, D. Gevers, A. M. Earl, M. Feldgarden, D. V. Ward, G. Giannoukos, D. Ciulla, D. Tabbaa, S. K. Highlander, E. Sodergren, B. Methé, T. Z. DeSantis, J. F. Petrosino, R. Knight and B. W. Birren, Genome Res., 2011, 21, 494–504 CrossRef CAS PubMed.
- R. C. Edgar, Bioinformatics, 2010, 26, 2460–2461 CrossRef CAS PubMed.
- J. G. Caporaso, K. Bittinger, F. D. Bushman, T. Z. DeSantis, G. L. Andersen and R. Knight, Bioinformatics, 2010, 26, 266–267 CrossRef CAS PubMed.
- Q. Wang, G. M. Garrity, J. M. Tiedje and J. R. Cole, Appl. Environ. Microbiol., 2007, 73, 5261–5267 CrossRef CAS PubMed.
- C. Lozupone, M. E. Lladser, D. Knights, J. Stombaugh and R. Knight, ISME J., 2011, 5, 169–172 CrossRef PubMed.
- C. A. Lozupone, M. Hamady, S. T. Kelley and R. Knight, Appl. Environ. Microbiol., 2007, 73, 1576–1585 CrossRef CAS PubMed.
- C. Lozupone and R. Knight, Appl. Environ. Microbiol., 2005, 71, 8228–8235 CrossRef CAS PubMed.
- Y. M. Li, J. F. Zhao and G. W. Gu, Shanghai Environ. Sci., 2003, 22, 86–88 Search PubMed.
- H. H. P. Fang, Y. Liu, S. Z. Ke and T. Zhang, Water Sci. Technol., 2004, 49, 95–102 CAS.
- T. Zhang, S. Z. Ke, Y. Liu and H. P. Fang, Water Sci. Technol., 2005, 52, 73–78 CAS.
- C. L. Chen, J. H. Wu, I. C. Tseng, T. M. Liang and W. T. Liu, Microbes Environ., 2009, 24, 144–153 CrossRef PubMed.
- T. Yamada, H. Imachi, A. Ohashi, H. Harada, S. Hanada, Y. Kamagata and Y. Sekigu, Int. J. Syst. Evol. Microbiol., 2007, 57, 2299–2306 CrossRef CAS PubMed.
- K. Fritsche, G. Auling, J. R. Andreesen and U. Lechner, Syst. Appl. Microbiol., 1999, 22, 197–204 CrossRef CAS PubMed.
- W. Reeve, K. Nandasena, R. Yates, R. Tiwari, G. O'Hara, M. Ninawi, O. Chertkov, L. Goodwin, D. Bruce, C. Detter, R. Tapia, S. Han, T. Woyke, S. Pitluck, M. Nolan, M. Land, A. Copeland, K. Liolios, A. Pati, K. Mavromatis, V. Markowitz, N. Kyrpides, N. Ivanova, L. Goodwin, U. Meenakshi and J. Howieson, Stand. Genomic Sci., 2013, 9, 294–303 CrossRef CAS PubMed.
- A. Koenig, T. Zhang, L.-H. Liu and H. H. P. Fang, Chemosphere, 2005, 58, 1041–1047 CrossRef CAS PubMed.
- N. Song, X. He, D. Li, P. Gao and Y. Tao, Chin. J. Appl. Environ. Biol., 2013, 19, 1035–1039 CrossRef CAS.
- J.-H. Yoon, S.-J. Kang, S.-Y. Lee, J.-S. Lee and S. Park, Int. J. Syst. Evol. Microbiol., 2011, 61, 1066–1072 CrossRef CAS PubMed.
- M. Hesselsoe, S. Füreder, M. Schloter, L. Bodrossy, N. Iversen, P. Roslev, P. H. Nielsen, M. Wagner and A. Loy, ISME J., 2009, 3, 1349–1364 CrossRef CAS PubMed.
- M. Filippini, C. Ortelli, M. Svercel and H. C. Bagheri, J. Photochem. Photobiol., B, 2011, 103, 234–242 CrossRef CAS PubMed.
Footnote |
| † Electronic supplementary information (ESI) available. See DOI: 10.1039/c5ra11506j |
| This journal is © The Royal Society of Chemistry 2015 |