DOI:
10.1039/C5RA11192G
(Paper)
RSC Adv., 2015,
5, 69522-69533
Largely improved fracture toughness of an immiscible poly(L-lactide)/ethylene-co-vinyl acetate blend achieved by adding carbon nanotubes
Received
12th June 2015
, Accepted 10th August 2015
First published on 10th August 2015
Abstract
In this work, different contents of CNTs were introduced into an immiscible poly(L-lactide)/ethylene-co-vinyl acetate (PLLA/EVA) blend that exhibited a sea-island structure to further demonstrate the toughening probability of CNTs on the immiscible polymer blends. The fracture toughness was evaluated through impact measurements. The impact-fractured surface morphologies as well as the morphological changes of the blend induced by adding CNTs were characterized using scanning electron microscope. Furthermore, rheological properties and glass transition behaviors of samples were comparatively investigated to better understand the toughening mechanisms. The results demonstrated that although the presence of CNTs resulted in the formation of EVA particles with irregular shape and simultaneously increased diameters and matrix ligament thickness, which were usually thought to be unfavorable for the improvement of fracture toughness according to the Wu's toughening mechanism, the blend composites still exhibited largely enhanced fracture toughness compared with the binary blend, and the impact strength increased gradually with increasing content of CNTs. The plastic deformation ability of PLLA matrix during the fracture process was greatly enhanced, especially when CNTs formed the physical network structure. Further results demonstrated that the glass transition behavior of EVA particles was greatly influenced by CNTs. Then, the toughening mechanism was proposed on the basis of the morphological changes of EVA particles, the formation of CNT physical network structure and the glass transition behavior of EVA. The other mechanical properties were also measured and analyzed. This work further demonstrated the toughening effect of CNTs on the immiscible polymer blends, and the methodology can be widely adopted in industry application.
1. Introduction
Elastomers toughening has already been proved an efficient strategy to improve the fracture toughness of quasi-ductile polymers including polyamide (PA6),1–3 polypropylene (PP)4–6 and poly(ethylene terephthalate) (PET),7–9 etc., and brittle polymers including polystyrene (PS),10,11 poly(methyl methacrylate) (PMMA),12,13 etc. The toughening efficiency of elastomers is determined by many factors, including the interfacial interaction between matrix and elastomers, the content of elastomers, the size of elastomer particles as well as the matrix ligament thickness (τ) between elastomer particles,14–19 etc. Based on the analysis of the fractured surface morphology and the variation of elastomer particles during the fracture process, several toughening mechanisms have been proposed, such as multiple crazing mechanism,18–22 rubber cavitation mechanism,16–19,23,24 shear yielding,18,19,24 etc. Among these mechanisms, Wu's toughening mechanism is the one that has been widely accepted.16 It suggests that the toughening effect of elastomers on brittle polymers is mainly related to τ, and there is a critical τ (τc). When τ is smaller than τc, the toughened blends exhibit excellent fracture toughness.
Since it has been synthesized, poly(L-lactide) (PLLA) has attracted much attention of researchers in both the academic and industry fields due to its excellent comprehensive properties. PLLA exhibits excellent strength and modulus on one hand. On the other hand, it exhibits biodegradable and/or hydrolytic degradation ability and consequently, it can be completely recycled. Specifically, PLLA can be prepared from completely renewable resources ranging from corn, starch, and sucrose, etc. Therefore, PLLA is thought as a promising alternative to petroleum-based plastics25–27 and the wide application of PLLA-based materials satisfies the requirement of sustainable development. However, it is also well known to all that PLLA is very brittle, especially at relatively low temperatures and with the presence of notch. This greatly restricts the further application of PLLA-based articles in the fields that experience environment stress and the other impact load.28–30 Obviously, improving the fracture toughness of the PLLA becomes very important, and great attention should be paid to. So far, many strategies have been developed to toughen PLLA, including introducing another monomer into the main chain of PLLA to reduce the rigidity of molecular chains through chemical synthesis31 or introducing another ductile polymer or plasticizer into PLLA matrix through physical blending.32,33 In addition, some researches also demonstrate that adding rigid particles can also improve the fracture toughness of PLLA.34,35
Considering the excellent toughening efficiency of elastomers on the other brittle and/or quasi-ductile polymers, many researches have been carried out to toughen PLLA through adding elastomers. To date, elastomers that have been used to toughen PLLA include natural rubber (NR),36 silicone rubber,37 ethylene-propylene copolymer, ethylene-acrylic rubber, acrylonitrile-butadiene rubber (NBR) and isoprene rubber (IR),38 thermoplastic polyurethane (TPU),39 acrylonitrile-butadiene-styrene (ABS),40 and ethylene-co-vinyl acetate (EVA),41 etc. However, due to the relatively poor interfacial interaction between PLLA and the almost common elastomers, the toughening efficiency of common elastomers is rather low and generally, high content of elastomers must be added to achieve the relatively high fracture toughness. Obviously, high content of elastomers not only leads to the increase of product cost but also results in more difficulty for the sample processing.
Many strategies have been developed to further enhance the fracture toughness of PLLA/elastomer blends. Among these strategies, reactive blending is the one that is widely used.40,42 During the melt blending processing, an initiator is introduced into the blend and the block (or graft) copolymer composed of the chain segments of PLLA and elastomers is formed. The copolymer then acts as the compatibilizer to improve the interfacial interaction between PLLA and elastomers and consequently, the compatibilized PLLA/elastomer blends exhibit excellent fracture toughness. However, it should be noticed that the presence of the initiator possibly promotes the thermal degradation of PLLA matrix, which possibly results in the deterioration of strength and stiffness of articles. Recently, another strategy that is related to the introduction of poly(D-lactide) (PDLA) has been developed to toughen PLLA/elastomers.43,44 For example, Sun Y. et al.43 synthesized a core–shell particles composed of poly(ε-caprolactone-co-lactide) (PCLLA) (core) and PDLA (shell). With the presence of PDLA, the strong interaction between core–shell particles and PLLA matrix via formation of stereocomplex was then achieved. Consequently, the toughened blends exhibited largely enhanced tensile ductility without deterioration of other mechanical properties such as strength and modulus.
However, from simplifying processing procedures point of view, only introducing another component through physical blending to achieve the goal of toughening PLLA/elastomer blends is the most exciting strategy and it can be really and widely applied in industry. Some researchers then investigated the effects of nanofillers, including clay and calcium carbonate, on fracture toughness of PLLA/elastomers. However, the toughening efficiency was still relatively low.45
In our previous work,46 we introduced carbon nanotubes (CNTs) into PLLA/TPU blends and found that the PLLA/TPU/CNT blend composites exhibited excellent fracture toughness. Specifically, the notched Izod impact strength gradually increased with increasing content of CNTs. The toughening mechanism was suggested to be related to the more apparent cavitation of the TPU phase and the intensified local plastic deformation of the PLLA matrix. However, when CNTs was introduced into PLLA/EVA blend, in which the content of vinyl acetate was 40 wt% and the blend exhibited a co-continuous structure, the selectively located CNTs at the blend interface only improved the tensile ductility while the notched Izod impact strength was not enhanced.47 We then believe that the different toughening efficiencies of CNTs in PLLA/TPU/CNT and PLLA/EVA/CNT is possibly related to the several factors, including the interfacial interaction between PLLA and elastomers, the morphology of the blend, and the microstructure of CNTs in the blend composites. To clarify these problems and further demonstrate the toughening probability of CNTs in PLLA/elastomer blends, in this work, another type of EVA that has vinyl acetate of 50 wt% was used and a sea-island morphology of the blend was controlled. It was interesting to observe that the notched Izod impact strength of the blend composites was greatly enhanced, especially at relatively higher content of CNTs.
2. Experimental part
2.1. Materials
All the materials used in this work are commercially available. PLLA (trade name of 2003D, with a D-isomer content of 4.3%, a melt flow rate (MFR) of 4–8 g/10 min (190 °C/2.16 kg) and a density of 1.24 g cm−3) was purchased from NatureWorks®, USA. EVA (trade name of Levapren®, with a VA content of 50 ± 1.5 wt%, and the density of 1.00 g cm−3) was purchased from LANXESS Chemical Co., Ltd, China. Multiwalled carbon nanotubes (CNTs, trade name of TNIMC4, containing 1.55 wt% carboxyl groups) were purchased from Chengdu Institute of Organic Chemistry, Chinese Academy of Science (Chengdu, China). The outer diameters of the CNTs were 10–30 nm, and the length of a single CNT was about 10–30 μm.
2.2. Sample preparation
Samples were prepared through melt extrusion and injection molding processing. Before sample preparation, all the pristine materials were dried at 50 °C for 12 h to erase the effect of moisture on possible thermal degradation of PLLA and/or EVA. After that, a master batch of PLLA/CNT containing 10 wt% CNTs was firstly prepared using a twin-screw extruder SHJ-30 (Nanjing Ruiya, China) at a screw speed of 150 rpm and the melt temperatures of 150–160–170–180–185–185–180 °C from hopper to die. Subsequently, the PLLA/CNT master batch was diluted by simultaneously blending with PLLA and EVA to obtain the corresponding compositions. Here, the weight ratio between PLLA and EVA was maintained at 80/20 while the content of CNTs was varied from 0.5 to 5 wt%. The sample notation was defined as L8A2Cx, where x represented the content of CNTs. After being granulated, the pellets were injection-molded to obtain the standard dumbbell specimens with a thickness of 4 mm and a width of 10 mm. The injection molding was conducted on an injection-molding machine EM80-V (Chen Hsong Machinery, China) at melt temperatures of 190–195–190 °C from hopper to nozzle and a mould temperature of 23 °C. For making a comparison, the binary PLLA/EVA blend, which named as L8A2, was also prepared through the completely same processing procedures.
2.3. Mechanical properties measurement
Notched Izod impact strength was measured using a XC-22Z impact tester (Chengde Jinjian, China) according to ASTM D 256-04. A rectangular sample that was cut from the previous dumbbell specimen was used. Before measurement, a V-shaped notch with a depth of 2 mm and a tip radius of 0.25 mm was prefabricated. Tensile measurement was conducted on a universal tensile machine AGS-J (SHIMADZU, Japan) according to ASTM: D638 at room temperature (23 °C). A dumb-bell specimen that had a width and a thickness of 10 and 4.2 mm, respectively, was used. A cross-head speed of 50 mm min−1 was used. For each sample, the average value of mechanical properties reported was derived from the data of more than 5 specimens. All the mechanical properties measurements were carried out at room temperature (23 °C).
2.4. Scanning electron microscopy (SEM)
The impact-fractured surface morphologies, the phase morphologies of the samples and the dispersion states of CNTs in the blend composites were investigated using a scanning electron microscope (SEM) FEI Inspect (FEI, the Netherlands) with an accelerating voltage of 5.0 kV. Before SEM characterization, all the samples were coated with a thin layer of gold. To characterize the impact-fractured surface morphologies, the impact-fractured surfaces were directly observed by SEM. To characterize the phase morphology and the dispersion states of CNTs, the sample was firstly cryogenically fractured in liquid nitrogen, and then the cryogenically fractured surface was immersed into cyclohexane at 50 °C for different time (2 and 4 h) to remove EVA phase to different degrees. After that, the treated surface was carefully washed with fresh cyclohexane and alcohol with the aid of sonication, successively. The weight average diameter (
w) and diameter distribution (σ) of EVA particles were calculated according to the following relations, respectively: |
 | (1) |
|
 | (2) |
where di represents the diameter of EVA particle, ni represents the number of EVA particles with diameter of di.
2.5. Rheological measurement
The rheological measurement was conducted on a stress-controlled rheometer DHR-1 (TA Instrument, USA). The sample disk was prepared by a compression-molding method, which was carried out at a melt temperature of 185 °C and a pressure of 5 MPa through using the pellets that was prepared through melt extrusion. The sample disk had a thickness of 1.0 mm and a diameter of 20 mm. During the rheological measurement, the frequency sweep from 0.03 to 100 rad s−1 was performed at 170 °C under dry nitrogen atmosphere. The strain amplitude was maintained at 1% and the initial torque was 10 μN m. For all the measurements, the samples were tested within the linear viscoelastic strain range, which could be estimated by an initial survey through a dynamic strain sweep experiment at strains ranging from 0.01 to 100%.
2.6. Dynamic mechanical analysis (DMA)
The dynamic mechanical properties were measured using a dynamic mechanical analysis (DMA) Q800 (TA Instrument, USA). The single cantilever mode was selected, and the measurement was carried out on a rectangular sample from −50 to 110 °C at a heating rate of 3 °C min−1 and a frequency of 1 Hz. The length, width and thickness of the rectangular sample, which was directly cut from an injection-molded bar, was 35, 10 and 4.2 mm, respectively.
3. Results and discussion
3.1. Fracture toughness measurement
The notched Izod impact strength of specimens was firstly measured. As shown in Fig. 1, the binary L8A2 specimen exhibits an impact strength of 7.5 kJ m−2, which demonstrates that the toughening efficiency of EVA on PLLA is very low. Although the value is already much higher than that of the pure PLLA (about 2–3 kJ m−2), it is still very low and can not satisfy the requirement for excellent fracture toughness. Factually, in our previous work,48 different kinds of EVA with different VA contents ranging from 7.5 to 40 wt% were introduced into PLLA with the same composition of 70/30 (wt/wt), the results demonstrated that the impact strength was varied from 5.5 to 11.8 kJ m−2. Here, although the content of VA is further increased up to 50 wt%, the content of EVA in the blend is reduced to 20 wt% and consequently, the binary blend still exhibits poor impact strength. Interestingly, adding a small amount of CNTs induces the apparent enhancement of impact strength. For example, the L8A2C0.5 specimen exhibits the impact strength of 12.1 kJ m−2. Further increasing the content of CNTs results in the further enhancement of impact strength. The L8A2C5 specimen exhibits the impact strength of 29.5 kJ m−2, which is nearly 4 times higher compared to the binary L8A2 specimen, and even 10 times higher compared to the pure PLLA. The variation of impact strength with increasing CNT content indicates at least two possibilities. The first possibility is that CNTs exhibit excellent toughening effect on the PLLA/EVA blend, and the second one is that the toughening effect of EVA on PLLA matrix is amplified with the assistance of CNTs.
 |
| Fig. 1 Variation of notched Izod impact strength of PLLA/EVA/CNT blend composites versus CNT content. | |
To better understand the role of CNTs in the blend composites, the impact-fractured surface morphologies were characterized using SEM. Fig. 2 exhibits the impact-fractured surface morphologies of different specimens obtained at smaller magnifications. It can be seen that the L8A2 specimen (Fig. 2a) exhibits smooth surface, which indicates that the fracture process occurs at relatively high speed. Furthermore, the specimen is completely fractured. Obviously, the L8A2 specimen exhibits the brittle fracture mode. This is consistent with its relatively low impact strength of 7.5 kJ m−2. However, the PLLA/EVA/CNT blend composites exhibit coarser surface compared with the L8A2 specimen. The more the CNTs in the blend composites are, the coarser the fractured surface is. Specifically, one can see that the specimens with high content of CNTs were not fractured completely (as shown by dash rectangles). Similarly, high content of CNTs results in more un-fractured part in the impact-fractured specimen.
 |
| Fig. 2 SEM images showing the impact-fractured surface morphologies of different samples obtained at lower magnifications. (a) L8A2, (b) L8A2C0.5, (c) L8A2C1, (d) L8A2C2, and (e) L8A2C5. | |
Generally, the fracture process of specimen under the load condition can be classified at least two stages, i.e. crack initiation and crack propagation stages, and consequently, the impact-fractured surface can be divided several zones, i.e. crack initiation zone and crack propagation zone. Investigating the surface morphologies at the different zones facilitates to better understand the fracture behavior of the specimens. In this work, the impact-fractured surface is divided into three zones as shown in Fig. 2a, relating to the crack initiation (Zone 1), the early stage of crack propagation (Zone 2) and the later stage of the crack propagation (Zone 3), respectively. More apparent differences in surface morphologies among different specimens can be clearly differentiated from SEM images obtained at higher magnifications as shown in Fig. 3. For the L8A2 specimen (Fig. 3a1–a3), there are at least two characteristics that need to be noticed. First, either in the crack initiation zone or in the crack propagation zone, the specimen exhibits very smooth surface and no apparent plastic deformation zone can be differentiated. Second, there are many tiny holes on the fractured surface, which is possibly related to the debonding of the EVA particles from the PLLA matrix during the impact process. Although the L8A2C0.5 specimen exhibits the similar surface morphology in the crack initiation zone (Fig. 3b1) to that of the L8A2 specimen, apparently changed surface morphologies are observed in the crack propagation zone (Fig. 3b2 and b3). EVA particles with slightly increased diameters are observed on one hand. On the other hand, the PLLA matrix exhibits weak plastic deformation behavior. Increasing CNT content leads to more apparent plastic deformation behavior in both crack initiation zone and crack propagation zone, especially at relatively high CNT content (Fig. 3e1–e3). Specifically, one can observe many dark holes in the crack propagation zones (Fig. 3c3, d3 and e3), which are apparently different from the tiny holes observed in the L8A2 specimen. This is mainly related to the occurrence of the second crack and/or the cavitation of the EVA component. Obviously, either for the intensified plastic deformation or for the occurrence of the second crack and/or cavitation, it facilitates the energy absorption during the impact measurement, mainly contributing to the largely enhanced impact strength. Furthermore, it should be stressed that from the impact-fractured surface, one can not differentiate EVA particles from the PLLA matrix. This is possibly attributed to the intensified interfacial adhesion between EVA particles and PLLA matrix that prevents the debonding of EVA particles from the PLLA matrix during the impact fracture process. The similar fracture characteristics of the immiscible polymer blend induced by CNTs have been reported elsewhere.46
 |
| Fig. 3 SEM images showing the impact-fractured surface morphologies of different samples obtained at relatively higher magnifications. Images were taken from different zones as indicated in Fig. 2. (a1–a3) L8A2, (b1–b3) L8A2C0.5, (c1–c3) L8A2C1, (d1–d3) L8A2C2, and (e1–e3) L8A2C5. | |
3.2. Morphology
As described above, the toughening efficiency of elastomers on brittle polymers is determined by many factors. For the semicrystalline polymers, the variations of the degree of crystallinity, the crystal form and the crystallite size also induce the change of fracture toughness of samples. In this work, although PLLA is a semicrystalline polymer, the crystallization ability is rather low and generally, PLLA is still in the amorphous state during the common injection-molding process even if CNTs are present in the matrix due to the fact that the cooling rate is relatively higher and there is not enough time for the crystallization of PLLA matrix.49 Therefore, the possible variations of crystalline structure of PLLA in different samples were not considered.
Here, to better understand why the presence of CNTs enhances the fracture toughness of the PLLA/EVA blend, the effect of CNTs on phase morphology of PLLA/EVA was investigated using SEM. Fig. 4 exhibits the phase morphologies of all the samples investigated in this work. The black holes represent the EVA particles which were previously removed by cyclohexane. The corresponding particle parameters are statistically analyzed and shown in Table 1. From Fig. 4a one can see that the L8A2 specimen exhibits the typical sea-island morphology, namely, PLLA is the matrix while EVA is the dispersed particles. Furthermore, one can see that EVA exhibits homogeneous dispersion in the PLLA matrix and the average diameter is about 0.42 μm. Adding a small amount of CNTs leads to the apparent change of EVA morphology and especially, the more the CNTs in the blend composites, the more apparent the change of EVA morphology. For example, the L8A2C0.5 sample exhibits
w of about 0.61 μm while the L8A2C5 sample exhibits
w of 1.75 μm. Furthermore, one can see that σ also increases with increasing CNT content. Specifically, from Fig. 4 one can also see that the irregular EVA particles are induced, and the interface between PLLA and EVA in the blend composites becomes rougher compared with the L8A2 specimen.
 |
| Fig. 4 SEM images showing the morphologies of PLLA/EVA/CNT blend composites with and without CNTs. The inserted images showing the morphologies obtained at relatively higher magnifications. Samples were immersed in cyclohexane at 50 °C for 4 h. (a) L8A2, (b) L8A2C0.5, (c) L8A2C1, (d) L8A2C2, and (e) L8A2C5. | |
Table 1 Weight average diameter (
w/μm), diameter distribution (σ), and matrix ligament thickness (τ/μm) of EVA particles in the PLLA/EVA/CNT blend composites
Samples |
w (μm) |
σ |
τ (μm) |
L8A2 |
0.42 |
1.34 |
0.18 |
L8A2C0.5 |
0.61 |
1.35 |
0.28 |
L8A2C1 |
0.77 |
1.60 |
0.53 |
L8A2C2 |
1.03 |
1.75 |
0.94 |
L8A2C5 |
1.75 |
2.13 |
3.02 |
It has been reported elsewhere that CNTs can exhibit a role of “compatibilizer” to improve the dispersion of dispersed phase.50 Although some researchers believed that CNTs could reduce the interfacial tension of the immiscible blend, recent researches demonstrated that CNTs exhibited a steric hindrance, which prevents the aggregation of dispersed phase during the melt compounding processing.51 Interestingly, in our work, the presence of CNTs induces the formation of irregular EVA particles with largely increased diameters. So far, it is still unclear why CNTs induces the increase of EVA particles. One possibility is that the migration of CNTs from PLLA to EVA and the selectively located CNTs in the EVA particles exhibit the role of volume filling.
At higher magnifications (the inserted images), one can clearly see the location of CNTs at the blend interface. Generally, the selective location of nanofillers in an immiscible polymer blend is simultaneously determined by the thermodynamic factor, which is mainly related to the interfacial tension between nanofiller and components, and the kinetic factors, which are mainly related to the viscosity ratio between components, blending sequence, blending duration, shear stress, etc.52 Nanofillers tend to selectively locate in the component that exhibits high interfacial affinity to them or has much lower viscosity than the other one. This means that if nanofillers are first in the component with lower interfacial affinity to them or with higher viscosity, they migrate from this component to the other component during the melt compounding processing with the aid of high shear stress. However, if nanofillers are first in the component with higher interfacial affinity to them or with lower viscosity, nanofillers maintains in this component and no migration occurs during the subsequent processing. In our previous work,53 it was demonstrated that in the PLLA/EVA blend with VA content of 40 wt%, the selective location of CNTs was greatly determined by blending sequence. If the master batch of PLLA/CNT was used, most of CNTs selectively located at the blend interface; if the master batch of EVA/CNT was used, all the CNTs selectively located in the EVA phase. In this work, to better demonstrate our observations, the cryogenically fractured surfaces of the representative L8A2C2 and L8A2C5 samples were also treated in cyclohexane at 50 °C for 2 h to remove partial EVA component. The SEM images of the samples before and after being etched for different time (2 and 4 h) obtained at relatively higher magnifications are shown in Fig. 5. It can be deduced that most of CNTs locate at the blend interface and some CNTs (or a part of a single CNT) enter into the EVA particles. Obviously, this observation is consistent with our previous observations although the VA content is increased to 50 wt% in this work.
 |
| Fig. 5 SEM images showing the dispersion state of CNTs in the L8A2C2 (a–c) and L8A2C5 (d–f) samples. The cryogenically fractured surfaces were treated in cyclohexane at 50 °C for different time to provide the different degrees of etching. (a and d) Without etching, (b and e) after being etched for 2 h, and (c and f) after being etched for 4 h. | |
According to the methodology proposed by Liu Z. H. et al.,54 the matrix ligament thickness (τ) can be calculated according to the following relation:
|
 | (3) |
where
ϕ is the elastomer volume fraction. As shown in
Table 1, the L8A2 specimen exhibits the smallest
τ (0.18 μm) while the L8A2C5 sample exhibits the biggest
τ (3.02 μm). The more the CNTs in the blend composites are, the bigger the
τ is. The relationships among CNT content, matrix ligament thickness, notched Izod impact strength are illustrated in
Fig. 6. It is interesting to observe that the impact strength increases with increasing
τ. Obviously, this is in conflict with the Wu's toughening theory which suggests that smaller
τ facilitates the enhancement of fracture toughness.
16 This indicates that the enhanced fracture toughness of the immiscible PLLA/EVA blend induced by adding CNTs can not be attributed to the change of morphologies but to other factors.
 |
| Fig. 6 Relationships among notched Izod impact strength, content of CNTs and matrix ligament thickness. | |
3.3. Rheology
The rheological properties of the blend composites were then investigated to better understand the microstructure changes of the PLLA/EVA/CNT blend composites. Fig. 7 exhibits the variations of storage modulus (G′), loss modulus (G′′), Cole–Cole plots of G′ versus G′′, and the complex viscosity (η*). From Fig. 7a one can see that although the L8A2C0.5 sample exhibits very similar G′ to that of the L8A2 specimen at all frequencies, further increasing CNT content leads to apparent change of G′ at low frequencies. Specifically, for the L8A2C2 and L8A2C5 samples, a platform at low frequencies is observed. In this condition, the melt exhibits a solid-like response and nearly invariant G′ is achieved. This indicates that CNTs form a physical network structure in the melt.55,56 Similar variation trends are also observed for G′′ as shown in Fig. 7b. At relatively low CNT content, the blend composites exhibit similar G′′ to that of the binary blend, while at relatively higher CNT content, a platform in G′′ is observed at low frequencies. The Cole–Cole plots of G′ versus G′′, which can be also used to demonstrate the microstructure of nanofillers in polymer melt, is shown in Fig. 7c. Generally, when the Cole–Cole plots exhibit a deviation from the linear relationship between G′ and G′′, and the increase of G′ is higher than that of G′′, the nanofiller forms the physical network structure,57,58 which increases the elastic responses of the melt to the external shear stress. As shown in Fig. 7c, both the L8A2C0.5 and the L8A2C1 samples exhibit very similar Cole–Cole plots to that of the L8A2 sample, and the three samples exhibit the linear relationship between G′ and G′′. However, when a high content of CNTs (L8A2C2 and L8A2C5) are present in the melt, the samples exhibit an apparent deviation from the linear relationship. This further indicates the formation of the physical CNT network structure in the melt of the blend composites. From Fig. 7d one can see that adding a few number of CNTs (≤1 wt%) does not induce the apparent change of η*. However, largely increased η* is obtained at low frequencies with increasing CNT content, which demonstrates that high content of CNTs reduce the mobility of melts possibly due to the restriction effect of CNT physical network structure. But it is worth noting that at relatively higher shear frequency, the difference in melt viscosity becomes smaller. This indicates that under the condition of high shear frequency, the negative effect of CNTs on mobility of melts is reduced. In other words, high content of CNTs do not apparently affect the processability of the PLLA/EVA/CNT blend composites. This is very significant from a viewpoint of maintaining the good processability of the blend composites.
 |
| Fig. 7 Rheological properties of the PLLA/EVA/CNT blend composites. (a) Storage modulus, (b) loss modulus, (c) Cole–Cole plots of storage modulus versus loss modulus, and (d) complex viscosity. | |
The previous morphological characterizations demonstrate that a high content of CNTs induce the apparent change of EVA phase with increased diameters and irregular particle shape. Considering the formation of CNT physical network structure at relatively high content, it is then suggested that the morphological change of EVA phase is possibly related to the formation of CNT physical network structure. Factually, many researches have demonstrated that CNTs can adsorb a certain component, when CNTs form the physical network structure, the adsorbed component has a chance to aggregate together and form a larger and/or continuous phase domain.59,60
3.4. Glass transition behavior
The previous morphological characterization of the impact-fractured surface demonstrates that with the presence of CNTs, it is very difficult to differentiate the EVA particles from the PLLA matrix, which indicates that the interfacial adhesion between PLLA and EVA components is possibly intensified. Furthermore, it is also believed that the formation of CNT physical network structure possibly restricts the mobility of chain segment. To clarify these problems, the relaxation behaviors of all the samples were investigated through DMA measurements. Fig. 8 exhibits the loss factor (tan
δ) of all the samples. The loss factor peak relating to the maximum of tan
δ (tan
δmax) at relatively lower temperature (below −16 °C) is attributed to the glass transition of EVA chain segments and the peak at relatively higher temperature (about 72 °C) to the glass transition of PLLA chain segments. Correspondingly, the glass transition temperature (Tg) can be obtained from the position of the loss factor peak. The corresponding glass transition parameters are listed in Table 2. It can be seen that with the presence of CNTs, the PLLA and EVA components exhibit different variation trends. The PLLA component exhibits random changes of Tg-PLLA and tan
δmax-PLLA, while the EVA component exhibits the regular variation trends of Tg-EVA and tan
δmax-EVA, i.e. Tg-EVA increases gradually, especially at relatively high content of CNTs, and simultaneously, tan
δmax-EVA also increases with increasing content of CNTs. This indicates that the glass transition behavior of EVA component is greatly influenced. One possibility is that the physical CNT network structure restricts the chain segment mobility of EVA component, and the other possibility is possibly related to the intensified interfacial adhesion between PLLA and EVA. Considering the selective location of CNTs at the blend interface and the indiscoverable EVA particles from the impact-fractured surface, it is suggested that the intensified interfacial adhesion mainly contributes to the greatly influenced glass transition of EVA component.
 |
| Fig. 8 Loss factor of the binary PLLA/EVA blend and the PLLA/EVA/CNT blend composites obtained through DMA measurements. | |
Table 2 Relaxation behavior parameters obtained from DMA measurement of different PLLA/EVA/CNT specimens
Samples |
EVA |
PLLA |
Tg (°C) |
tan δmax |
IR |
Tg (°C) |
tan δmax |
IR |
L8A2 |
−19.4 |
0.044 |
0.22 |
72.9 |
2.172 |
21.97 |
L8A2C0.5 |
−19.5 |
0.049 |
0.32 |
71.8 |
1.878 |
20.81 |
L8A2C1 |
−18.9 |
0.051 |
0.46 |
72.0 |
1.897 |
20.58 |
L8A2C2 |
−18.4 |
0.055 |
0.48 |
72.9 |
2.106 |
21.04 |
L8A2C5 |
−16.9 |
0.069 |
0.61 |
72.8 |
1.814 |
18.76 |
Recently, it has been demonstrated that the fracture toughness of polymers can be also estimated by DMA measurements.61 The magnitude of glass transition (IR) is representative of the total energy dissipated because of viscoelastic relaxation of polymers and therefore, the impact toughness can be reflected by IR. From Table 2 one can also see that IR-EVA increases gradually with increasing CNT content while IR-PLLA exhibits random variations. It should be pointed out that although IR-PLLA is much higher than that of IR-EVA, the impact measurement was carried out at room temperature, which was much lower than Tg-PLLA of PLLA component, therefore, the contribution of EVA phase on fracture toughness of the blend and/or blend composites is considered. The previous observations indicate at least that the role of EVA in influencing the fracture toughness of the PLLA/EVA/CNT blend composites is amplified with the aid of CNTs.
3.5. Toughening mechanism of CNTs on the PLLA/EVA
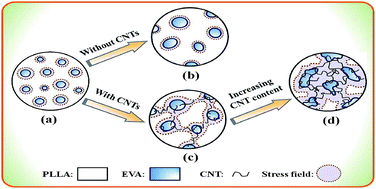
According to the previous observations, the toughening mechanism of CNTs on the immiscible PLLA/EVA blend can be understood as follows. For better understanding the toughening mechanism, more visualized schematic representations are proposed in Fig. 9 according to the concept of stress field.16 Fig. 9a represents the formation of stress field around dispersed EVA particles in the binary PLLA/EVA blend when external force is applied. Although the blend exhibits very homogeneous dispersion of EVA particles, the poor interfacial adhesion between PLLA matrix and dispersed EVA phase results in very weak stress field around EVA particles and therefore, it is very difficult for the superposition of stress field. As a consequence, the binary blend exhibits relatively poor fracture toughness. Fig. 9b represents the formation of stress field around EVA particles with increased diameters in the binary PLLA/EVA blend. Factually, this is not present in this work. However, it can be hypothesized that if larger EVA particles are present and the matrix ligament thickness is also increased, it becomes more difficult for the superposition of stress field, and in this condition, the binary blend will exhibit lower fracture toughness compared with the scenario as shown in Fig. 9a. Fortunately, with the presence of CNTs that selectively locate at the blend interface, as shown in Fig. 9c, EVA particles act as the stress concentrator and the stress can be easily transferred from the EVA particles to the PLLA matrix through the bridging effect of CNTs, which provides the probability for the superposition of stress field of adjacent EVA particles that linked by CNTs. When CNTs form the physical network structure and most of the irregular EVA particles are linked by CNTs, as shown in Fig. 9d, the superposition of stress field becomes easier. In this condition, the blend composites exhibit the largely improved fracture toughness.
 |
| Fig. 9 Schematic representations showing the morphology of the blend, dispersion of CNTs and the formation of stress field around EVA particles under the load of external forces. (a) Stress field formation in the binary PLLA/EVA blend with smaller EVA particles, (b) stress field formation in the binary PLLA/EVA blend with larger EVA particles, (c) stress field formation in the blend composites with smaller content of CNTs, and (d) stress field formation in the blend composites with relatively higher content of CNTs. | |
3.6. Other mechanical properties of the blend composites
The effect of CNTs on the tensile properties of the blend composites were also measured through uniaxial tensile process. Fig. 10 shows the typical engineering stress–stain curves and the corresponding tensile properties. It can be seen that the binary PLLA/EVA blend exhibits an apparent yielding behavior during the universal tensile process, which is apparently different from the stress–strain behavior of PLLA, which exhibits the typical brittle fracture mode without yielding and cold-drawing behaviors (not shown here). Furthermore, one can see that except the L8A2C0.5 sample, the presence of CNTs does not induce the apparent changes in the stress–strain behaviors of the blend composites. Although CNTs are well known as an efficient reinforcement agent for polymers, however, in this work, the reinforcement effect of CNTs is not conspicuous.
 |
| Fig. 10 (a) Typical engineering stress–strain curves of samples and (b) the corresponding tensile properties. | |
The storage modulus (E′) and loss modulus (E′′) of the samples obtained through DMA measurements are shown in Fig. 11. The former parameter is related to the stiffness while the latter one to the damping behavior of the sample. Generally, the bigger the E′ is, the higher the sample stiffness is; however, the bigger the E′′ is, the more energy consumption under the load condition is. From Fig. 11a one can see that CNTs don't exhibit the reinforcement effect on the blend composites and contrarily, all the blend composites exhibit relatively lower E′ compared with the binary PLLA/EVA blend. The presence of CNTs induces apparent changes of E′′ in some temperature ranges (Fig. 11b). In the glass transition region of EVA component (from −10 to 0 °C), E′′ increases with increasing CNT content, while in the glass transition region of PLLA component (from 60 to 80 °C), E′′ decreases with increasing CNT content. This demonstrates that the energy consumption induced by CNTs is mainly originated from the EVA component rather than from the PLLA component during the dynamic mechanical measurements. This indirectly demonstrates that adding CNTs strengthens the toughening effect of EVA on PLLA matrix. However, it is still not clear why CNTs induces the slight deterioration of the sample stiffness, and much work needs to be done in the future to simultaneously improve the stiffness and toughness of the PLLA/EVA/CNT blend composites.
 |
| Fig. 11 The storage modulus (a) and loss modulus (b) of samples obtained during the DMA measurements. | |
4. Conclusions
In summary, different contents of CNTs are introduced into the PLLA/EVA blend that exhibits sea-island morphology. The fracture toughness measurements demonstrate that the ternary PLLA/EVA/CNT specimens exhibit largely improved fracture toughness compared with the binary PLLA/EVA specimen, especially at relatively higher content of CNTs. Further results demonstrate that with the presence of CNTs, the PLLA/EVA/CNT specimens exhibit apparent plastic deformation behaviors during the fracture process. Morphological characterizations demonstrate that CNTs induces the formation of irregular EVA particles with largely increased diameters. Rheological measurements demonstrate the formation of CNT physical network structure in the blend composites at relatively higher content of CNTs, which is believed to be the main reason for the morphological change of EVA particles. DMA measurements show that the glass transition of EVA particles is greatly influenced by CNTs. The toughening mechanism is suggested to be the intensified interfacial adhesion between the PLLA matrix and the EVA particles through the bridging effect of CNTs, especially when CNTs form the physical network structure, which facilitates the stress transferring in the system and superposition of stress field during the fracture process.
Acknowledgements
Authors express their sincere thanks to the National Natural Science Foundation of China (51473137 and 50973090).
References
- Y. Kayano, H. Keskkula and D. R. Paul, Polymer, 1998, 39, 2835–2845 CrossRef CAS.
- J. J. Huang and D. R. Paul, Polymer, 2006, 47, 3505–3519 CrossRef CAS PubMed.
- Z. Ke, D. Shi, J. Yin, R. K. Y. Li and Y. Mai, Macromolecules, 2008, 41, 7264–7267 CrossRef CAS.
- Y. Yokoyama and T. Ricco, Polymer, 1998, 39, 3675–3681 CrossRef CAS.
- J. Z. Liang and R. K. Y. Li, J. Appl. Polym. Sci., 2000, 77, 409–417 CrossRef CAS.
- Y. Liu, X. Zhang, J. Gao, F. Huang, B. Tan, G. Wei and J. Qiao, Polymer, 2004, 45, 275–286 CrossRef CAS PubMed.
- W. Loyens and G. Groeninckx, Polymer, 2003, 44, 123–136 CrossRef CAS.
- K. L. Fung and R. K. Y. Li, Polym. Test., 2005, 24, 863–872 CrossRef CAS PubMed.
- P. Phinyocheep, J. Saelao and J. Y. Buzaré, Polymer, 2007, 48, 5702–5712 CrossRef CAS PubMed.
- J. Silberberg and C. D. Han, J. Appl. Polym. Sci., 1978, 22, 599–609 CrossRef CAS PubMed.
- L. Tang, K. Tam, C. Yue, X. Hu, Y. Lam and L. Li, Polym. Int., 2002, 51, 325–337 CrossRef CAS PubMed.
- K. Cho, J. Yang and C. E. Park, Polymer, 1998, 39, 3073–3081 CrossRef CAS.
- B. J. P. Jansen, S. Rastogi, H. E. H. Meijer and P. J. Lemstra, Macromolecules, 1999, 32, 6283–6289 CrossRef CAS.
- H. T. Oyama, Polymer, 2009, 50, 747–751 CrossRef CAS PubMed.
- R. J. M. Borggreve, R. J. Gaymans, J. Schuijer and J. F. I. Housz, Polymer, 1987, 28, 1489–1496 CrossRef CAS.
- S. Wu, Polymer, 1985, 26, 1855–1863 CrossRef CAS.
- W. M. Gramlich, M. L. Robertson and M. A. Hillmyer, Macromolecules, 2010, 43, 2313–2321 CrossRef CAS.
- C. B. Bucknall and D. R. Paul, Polymer, 2009, 50, 5539–5548 CrossRef CAS PubMed.
- C. B. Bucknall and D. R. Paul, Polymer, 2013, 54, 320–329 CrossRef CAS PubMed.
- E. Piorkowska, A. S. Argon and R. E. Cohen, Macromolecules, 1990, 23, 3838–3848 CrossRef CAS.
- B. Cotterell, J. Y. H. Chia and K. Hbaieb, Eng. Fract. Mech., 2007, 74, 1054–1078 CrossRef PubMed.
- H. Bai, C. Huang, H. Xiu, Y. Gao, Q. Zhang and Q. Fu, Polymer, 2013, 54, 5257–5266 CrossRef CAS PubMed.
- C. B. Bucknall, A. Karpodinis and X. C. Zhang, J. Mater. Sci., 1994, 29, 3377–3383 CrossRef CAS.
- A. Lazzeri and C. B. Bucknall, Polymer, 1995, 36, 2895–2902 CrossRef CAS.
- R. M. Rasal, A. V. Janorkar and D. E. Hirt, Prog. Polym. Sci., 2010, 35, 338–356 CrossRef CAS PubMed.
- R. E. Drumright, P. R. Gruber and D. E. Henton, Adv. Mater., 2000, 12, 1841–1846 CrossRef CAS.
- C. Nyambo, A. K. Mohanty and M. Misra, Biomacromolecules, 2010, 11, 1654–1660 CrossRef CAS PubMed.
- H. Liu and J. Zhang, J. Polym. Sci., Part B: Polym. Phys., 2011, 49, 1051–1083 CrossRef CAS PubMed.
- L. Xiao, Y. Mai, F. He, L. Yu, L. Zhang, H. Tang and G. Yang, J. Mater. Chem., 2012, 22, 15732–15739 RSC.
- Y. He, J. Zeng, G. Liu, Q. Li and Y. Wang, RSC Adv., 2014, 4, 12857–12866 RSC.
- B. K. Chen, C. H. Shen, S. C. Chen and A. F. Chen, Polymer, 2010, 51, 4667–4672 CrossRef CAS PubMed.
- K. S. Anderson, K. M. Schreck and M. A. Hillmyer, Polym. Rev., 2008, 48, 85–108 CrossRef CAS PubMed.
- V. Vilay, M. Mariatt, Z. Ahmad, K. Pasomsouk and M. Todo, J. Appl. Polym. Sci., 2009, 114, 1784–1792 CrossRef CAS PubMed.
- A. Kathuria, M. G. Abiad and R. Auras, Polymer, 2013, 54, 6979–6986 CrossRef CAS PubMed.
- B. Li, F. X. Dong, X. L. Wang, J. Yang, D. Y. Wang and Y. Z. Wang, Eur. Polym. J., 2009, 45, 2996–3003 CrossRef CAS PubMed.
- N. Bitinis, R. Verdejo, P. Cassagnau and M. A. Lopez-Manchado, Mater. Chem. Phys., 2011, 129, 823–831 CrossRef CAS PubMed.
- S. Yildiz, B. Karaağac and G. Ozkoc, Polym. Eng. Sci., 2014, 54, 2029 CAS.
- S. Ishida, R. Nagasaki, K. Chino, T. Dong and Y. Inoue, J. Appl. Polym. Sci., 2009, 113, 558–566 CrossRef CAS PubMed.
- Y. Li and H. Shimizu, Macromol. Biosci., 2007, 7, 921–928 CrossRef CAS PubMed.
- Y. Li and H. Shimizu, Eur. Polym. J., 2009, 45, 738–746 CrossRef CAS PubMed.
- P. Ma, D. G. Hristova-Bogaerds, J. G. P. Goossens, A. B. Spoelstra, Y. Zhang and P. J. Lemstra, Eur. Polym. J., 2012, 48, 146–154 CrossRef CAS PubMed.
- H. Liu, F. Chen, B. Liu, G. Estep and J. Zhang, Macromolecules, 2010, 43, 6058–6066 CrossRef CAS.
- Y. Sun and C. He, Macromolecules, 2013, 46, 9625–9633 CrossRef CAS.
- H. Bai, D. Bai, H. Xiu, H. Liu, Q. Zhang, K. Wang, H. Deng, F. Chen, Q. Fu and F. Chiu, RSC Adv., 2014, 4, 49374–49385 RSC.
- W. S. Chow, Y. Y. Leu and Z. A. Mohd-Ishak, eXPRESS Polym. Lett., 2012, 6, 503–510 CrossRef CAS.
- Y. Y. Shi, W. B. Zhang, J. H. Yang, T. Huang, N. Zhang, Y. Wang, G. P. Yuan and C. L. Zhang, RSC Adv., 2013, 3, 26271–26282 RSC.
- Y. Y. Shi, Y. L. Li, T. Huang, C. Chen, Y. Peng and Y. Wang, Polym. Adv. Technol., 2012, 23, 783–790 CrossRef CAS PubMed.
- Y. L. Li, L. Liu, Y. Y. Shi, F. M. Xiang, T. Huang, Y. Wang and Z. W. Zhou, J. Appl. Polym. Sci., 2011, 121, 2688–2698 CrossRef CAS PubMed.
- Y. H. Wang, X. L. Xu, J. Dai, J. H. Yang, T. Huang, N. Zhang, Y. Wang, Z. W. Zhou and J. H. Zhang, RSC Adv., 2014, 4, 59194–59203 RSC.
- D. Wu, Y. Zhang, M. Zhang and W. Yu, Biomacromolecules, 2009, 10, 417–424 CrossRef CAS PubMed.
- F. F. Tao, D. Auhl, A. C. Baudouin, F. J. Stadler and C. Bailly, Macromol. Chem. Phys., 2013, 214, 350–360 CrossRef CAS PubMed.
- A. Taguet, P. Cassagnau and J. M. Lopez-Cuesta, Prog. Polym. Sci., 2014, 39, 1526–1563 CrossRef CAS PubMed.
- Y. Y. Shi, J. H. Yang, T. Huang, N. Zhang, C. Chen and Y. Wang, Composites, Part B, 2013, 55, 463–469 CrossRef CAS PubMed.
- Z. H. Liu, X. D. Zhang, X. G. Zhu, Z. N. Qi and F. S. Wang, Polymer, 1997, 38, 5267–5273 CrossRef CAS.
- R. Krishnamoorti and E. P. Giannelis, Macromolecules, 1997, 30, 4097–4102 CrossRef CAS.
- P. Pötschke, T. D. Fornes and D. R. Paul, Polymer, 2002, 43, 3247–3255 CrossRef.
- R. A. Khare, A. R. Bhattacharyya, A. R. Kulkarni, M. Saroop and A. Biswas, Prog. Polym. Sci., 2008, 46, 2286–2295 CAS.
- H. K. F. Cheng, N. G. Sahoo, Y. Z. Pan, L. Li, S. H. Chan, J. H. Zhao and G. Chen, J. Polym. Sci., Part B: Polym. Phys., 2010, 48, 1203 CrossRef CAS PubMed.
- H. Zou, K. Wang, Q. Zhang and Q. Fu, Polymer, 2006, 47, 7821–7826 CrossRef CAS PubMed.
- F. M. Xiang, Y. Y. Shi, X. X. Li, T. Huang, C. Chen, Y. Peng and Y. Wang, Eur. Polym. J., 2012, 48, 350–361 CrossRef CAS PubMed.
- H. Yang, X. Zhang, C. Qu, B. Li, L. Zhang, Q. Zhang and Q. Fu, Polymer, 2007, 48, 860–869 CrossRef CAS PubMed.
|
This journal is © The Royal Society of Chemistry 2015 |
Click here to see how this site uses Cookies. View our privacy policy here.