Aligned carbon nanotube/polymer hybrid electrolytes for high performance dye sensitized solar cell applications

K. Prabakaran, Akshaya K. Palai, Smita Mohanty* and Sanjay Kumar Nayak
Laboratory for Advanced Research in Polymeric Materials, Central Institute of Plastics Engineering & Technology, Bhubaneswar, Odisha, India 751 024. E-mail: papers.journal@gmail.com; Fax: +91 0674 2740463; Tel: +91 0674 2742852

Received 8th June 2015 , Accepted 27th July 2015

First published on 27th July 2015


Abstract

Novel multiwalled carbon nanotube (MWCNT) filled poly(ethylene oxide) (PEO) and poly(vinylidenefluoride-co-hexafluoropropylene) (PVDF-HFP) composite electrolytes were successfully prepared for solid state dye sensitized solar cell application. The prepared composite membranes were characterized by Fourier transform infrared (FTIR) spectroscopy, transmission electron microscopy (TEM), differential scanning calorimetry (DSC), thermogravimetry (TGA), UV-visible spectroscopy, electrochemical impedance spectroscopy (EIS) and linear steady state voltammetry (LSV) measurements. The incorporated MWCNTs were electrically aligned by an applied external DC electric field of 440 V cm−1. The alignment of MWCNTs in the PEO/PVDF-HFP matrix was confirmed by wide angle X-ray diffraction (WAXD) and Raman spectroscopy. The ionic conductivity doubled up to 5.72 mS cm−1 for aligned MWCNT/PEO/PVDF-HFP electrolyte in comparison to the electrolyte containing unaligned-MWCNT. It was observed from linear steady state voltammograms that the apparent diffusion coefficient was increased up to 7.1 × 10⁻⁹ cm2 s−1 (I) for the electrically aligned MWCNT incorporated electrolyte. The polymer nanocomposites with the optimal composition (1 wt% of MWCNT in 4[thin space (1/6-em)]:[thin space (1/6-em)]6 wt% of PEO/PVDF-HFP) were used as an electrolyte for solid state dye sensitized solar cell (DSSC) fabrication. The DSSC with electrically aligned MWCNT/PEO/PVDF-HFP electrolyte showed a higher photoconversion efficiency of about 4% under the illumination of 100 mW cm−2, while the device based on unaligned MWCNT based electrolyte gave 3.2%. The enhancement was also confirmed by the electrochemical impedance spectra analyses of the DSSCs, which showed lower diffusion resistance (Rdif) and charge transfer resistance (Rct). The stability of the device was studied using chronoamperometry technique under several on–off cycles.

1. Introduction

Since the great invention of the DSSC by Gratzel and O'Regan in 1991, it has been attracting much attention from the research society due to its desirable efficiency, simple structure, low material cost, and low energy consumption for production.1,2 The standard DSSC consists of two sandwiched conducting glass plates; one is coated with wide band gap semiconducting nanoparticles with a self assembled monolayer of chemisorbed dye molecules. Another glass plate coated with Pt, carbon, etc., is used as a counter electrode. The redox couple (I/I3) electrolyte is filled between these two electrodes for dye regeneration.3,4 Since the DSSC was categorized between conventional photovoltaic cells and classical photo-electrochemical cells, a lot of researchers have highlighted their considerable contributions to improve the scientific and technological advancement in the field of this photovoltaic technology.5 To date the best solar conversion efficiency achieved for a liquid electrolyte based DSSC is approximately ∼13%.6

However, the electrolyte leakage, electrode corrosion, volatilization of organic solvents and sealing problem are hampered for further technical development and commercialization of DSSCs. Hence, electrolyte is an essential part of DSSC and it should fulfil certain criteria such as viscosity, high diffusion coefficient, high electrochemical stability and thermal stability, low vapor pressure and ease of sealing properties.7

Many alternatives to the liquid systems have been studied such as nanoparticles, gelling agents, bio-inspired/bio-sourced materials, p-type semiconductor, organic hole conductors, ionic liquid (room temperature molten salts), polymeric or gel materials comprising redox active electrolyte solution.8–12 Among them, polymer gel electrolytes have been employed as a suitable candidates for electrolyte applications due to their unique properties.9,10 There are several polymers that have been utilized as an electrolyte host such as PEO, PVDF, PAN, PU, PVDF-HFP, PMMA, and biopolymer, etc.13–23 Among them PVDF-HFP and PEO are selected as the host polymer electrolyte, because of their photochemical stability in presence of catalytic materials and better solvating properties. When these two polymer hosts are blended with each other, the crystallinity is significantly reduced. The compatibility also increased through the interaction of CF2 group present in PVDF-HFP and C–O–C in PEO.

To improve the ionic conductivity of solid/gel polymer electrolytes for DSSC, a variety of inorganic semiconducting nanoparticles has been incorporated to various polymers.24–27 In particular, the utilization of carbon based nanomaterials such as carbon nanotubes as fillers can improve the charge transport within electrolyte medium due to their outstanding characteristics such as electronic properties, ballistic charge transport, high mechanical strength, thermal stability and catalytic activity for the reduction of tri-iodide (I3) to iodide (I). The addition of CNTs does not only affect the structural and thermal properties, but it can also work as a catalytic material within polymer electrolytes.28,29 Byrne et al. reported that the incorporation of carbon based nanomaterials (CNT and graphene) into the 1-methyl-3-propylimidasolium iodide (PMII) based ionic liquid electrolyte could significantly reduced the charge transfer resistance and improved the photovoltaic performance.8 It was observed that the addition of more amount of CNT within polymer electrolytes leads to poor ionic conductivity.30 So far the photo conversion efficiency of DSSC based on MWCNT-gel electrolytes is reported between 0.5% and 6.8% using different modifications/organic dispersants, etc.31,32 Hong et al. investigated DSSC based on MWCNT filled gel electrolyte as well as counter electrode.33 It is interesting to note that magnetically or electrically aligned CNT in polymer matrix improved the properties due to their anisotropic structure.34,35 Recently, Gahlot et al. have reported a dramatic improvement of proton conductivity from the nanohybrid PEM of electrically aligned CNT used in direct methanol fuel cells.36 However, rare attempts have been made on electrically aligned MWCNT within PEO/PVDF-HFP electrolyte for solid state dye sensitized solar cell applications.

Keeping in view the physical properties of MWCNT and aligned MWCNT on the diffusion properties, we have prepared MWCNT reinforced PEO/PVDF-HFP electrolytes for DSSCs. The optimized compositions of MWCNT/PEO/PVDF-HFP nanocomposites were introduced into electrical alignment. The effect of aligned MWCNT on electrochemical and photovoltaic properties was studied. To the best of our knowledge, this is the first report on the aligned MWCNT based PEO/PVDF-HFP composite electrolyte for DSSC.

2. Experimental procedure

2.1. Materials

Poly(vinylidenefluoride-co-hexafluoropropylene) (PVDF-HFP, Kynar flex 2801) with melt viscosity of 23–27 K poise was supplied by Arkema (India). Poly(ethylene oxide) (PEO) (Mw = 5 × 10⁶), Triton X-100 (laboratory grade), titanium IVn-butoxide (purity 99%) and trisodium citrate dihydrate (HOC(COONa)(CH2COONa)22H2O) (purity 99%) were purchased from Sigma India. Anhydrous lithium iodide (LiI) and iodine (I2) were purchased from Thermo Fisher Scientific India. Iodolyte HI-30 and di-tetrabutylammonium cis-bis(isothiocyanato)bis(2,2′-bipyridyl-4,4′-dicarboxylato)ruthenium(II) (N-719) dye were purchased from Solaronix, Switzerland. 4-tert-Butylpyridine (purity > 96%) and 1-methyl-3-propylimidazolium iodide (purity > 95%) were purchased from TCI chemicals, India. Zinc nitrate hexahydrate (Zn(NO3)26H2O) (purity 99%), sodium hydroxide (NaOH) (99%), anhydrous dimethyl formamide (DMF) (99.5%), ethanol (99.9%), acetylacetone (99%), sulfuric acid (H2SO4, 63%) and nitric acid (HNO3, 98%), propylene carbonate (PC) (99%), ethylene carbonate (EC) (99%) were purchased from Himedia, India, and FTO glass plate (Rsh < 10 ohm cm−2) supplied by M/s Shilpa Enterprises, India.

2.2. Preparation of polymer blend nanocomposite electrolyte

1 g of poly(vinylidenefluoride-co-hexafluoropropylene) (PVDF-HFP) and poly(ethylene oxide) (PEO) with optimized composition (6[thin space (1/6-em)]:[thin space (1/6-em)]4 wt% ratio) were dissolved in 20 mL of DMF at 80 °C.37 Then, different amount (0.2–1.4 wt%) of acid treated MWCNTs were slowly added into the polymer solution. The mixtures were thoroughly mixed under continuous stirring for about 4 hours and then introduced into sonication for 30 min. Subsequently, the mixtures were poured in glass plate and the solvent was allowed to evaporate. Finally, the dimensionally stable hybrid nanocomposite polymer membranes were obtained. The obtained membranes were soaked into the liquid electrolyte containing 0.6 M 1-methyl-3-propylimidazolium iodide, 0.1 M LiI, 0.05 M I2 and 0.5 M 4-tert-butylpyridine in EC/PC (1[thin space (1/6-em)]:[thin space (1/6-em)]1 wt%). The amount of MWCNT within PEO/PVDF-HFP was optimized at 1 wt% based on ionic conductivity measurements. For further enhancement in electrical properties, the optimized sample (1% MWCNT/PEO/PVDF-HFP) solution was kept under strong electric field at the time of casting. The DC electric field of 440 V cm−1 was applied to the rectangular aluminum electrodes and the distance between two electrodes was maintained at about 0.5–1 cm. In order to evaporate the solvent, the alignment set up kept on the hot plate and 60 °C temperature was maintained.

Hereafter randomly aligned and electrically aligned multiwall carbon nanotubes are named as rMWCNT and aMWCNT, respectively. The electrical alignment of MWCNTs with the polymer matrix is shown in Scheme 1.


image file: c5ra10843h-s1.tif
Scheme 1 Schematic diagram of CNT alignment.

2.3. Fabrication of DSSC

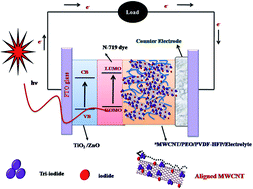
The photoanode was fabricated on FTO coated glass substrate by depositing a thick layer starting from 0.1 g of TiO2[thin space (1/6-em)]:[thin space (1/6-em)]ZnO (8[thin space (1/6-em)]:[thin space (1/6-em)]2 wt%) and using Doctor Blade technique. The MWCNT/Nafion® composite was used as a counter electrode. The detailed fabrication procedure of photoanode and counter electrode was reported in our earlier work.37 The optimized composition of MWCNT/PEO/PVDF-HFP electrolyte membranes was taken for the device fabrication. Finally, the electrolyte membranes were sandwiched between dye (N-719) adsorbed photoanode (TiO2:ZnO) and counter electrode (MWCNT-Nafion®). The schematic diagram of fabricated DSSC is shown in Scheme 2.
image file: c5ra10843h-s2.tif
Scheme 2 Solid state dye sensitized solar cells.

2.4. Characterizations

Fourier transform infrared (FTIR) spectra of MWCNT incorporated PEO/PVDF-HFP composites were performed on a NICOLET 6700, USA FTIR spectrometer from 4000 to 400 cm−1 with a scan rate of 5 cm−1 s−1. X-ray study of MWCNT-incorporated PEO/PVDF-HFP nanocomposite membranes was conducted with a Schimadzu X-ray diffractometer, Japan, using CuKα (1.514 Å) at a scanning rate of 5 °C min−1 over a 2θ interval from 2° to 80°. Raman spectra of the samples were studied using a Lab Ram HR800 micro Raman spectroscope (Horiba Jobin-Yvon, France). The Raman system operated at a laser power of 20 mW and at an excitation wavelength of 514 nm with an Ar+ ion laser. The data were collected using a 10 s data point acquisition time in the spectral region of 100–3500 cm−1. Micrograph images of the randomly oriented and electrically aligned CNTs within polymer matrix were recorded using a FEI Tecnai 30 G2 model transmission electron microscope (TEM) and images were carried out at an accelerating voltage of 300 kV. Thin section has been taken from membrane using microtome, Lieca EM UC6 microtome (M/s Leica, Germany), under cryo conditions, for analysis. The sections were collected onto 300 mesh carbon-coated copper grids. DSC thermograms were carried out using DSC, Q20, M/s TA Instruments (USA) equipment. Samples of ≤7 mg was heated from −60 to 200 °C, at the heating rate 5 °C min−1 under nitrogen atmosphere. Thermal stability of the samples was studied using thermogravimetric analyzer (TGA, Q50, TA Instruments USA). Samples of about 7 mg were heated from room temperature to 700 °C at a linear heating rate of 10 °C min−1 under N2 flow (20 mL min−1). The absorption spectra (in the range of 200 nm to 600 nm) of the polymer electrolyte samples were conducted by UV-VIS spectrophotometer (UV-2450, M/s Schimadzu, Japan). The ionic conductivity of the polymer electrolytes was measured by electrochemical impedance spectroscopy technique using WonATech-ZiveSP2 (Korea) electrochemical workstation. A perturbation of sinusoidal voltage signal of 10 mV was applied over a frequency range from 1 mHz to 1 MHz at room temperature. To study the ion (I/I3) diffusion behavior, steady state voltammetry was carried by CHI660 electrochemical work station and the scan rate of 5 mV s−1. A computer controlled Auto lab PGSTAT302N electrochemical workstation was used for JV measurements and Oriel Class-A Simulator (M-91900 A, Newport) with Xenon lamp as a light source having intensity of 100 mW cm−2. The active area of the cell was 0.5 cm2. To analyze the internal resistance of DSSC, EIS measurements were carried out by Auto lab PGSTAT302N electrochemical workstation with a signal frequency range from 1 mHz–1 MHz under the illumination of 100 mW cm−2. The chronoamperometry study has been carried out to study the stability and reproducibility of devices.

3. Results and discussion

3.1. FTIR analysis

FTIR absorbance spectra of the PEO/PVDF-HFP blend and its MWCNT incorporated PEO/PVDF-HFP blend nanocomposites are shown in Fig. 1. The IR spectra of the composite membranes were studied in the range of 4000–400 cm−1 at room temperature. The peaks at 1464 and 1355 cm−1 correspond to the stretching and bending vibrations of CH2 in PEO, respectively.38 The deformed vibration of CH2 groups was observed at 1403 cm−1.39 In PVDF-HFP, the crystalline characteristics peaks were observed at 1071 cm−1, 759 cm−1 and 607 cm−1 and amorphous bands were observed at 872 and 841 cm−1. The peaks observed in the frequencies 1280 and 1050 cm−1 are designated as –CF and –CF2 stretching vibrations. The peaks at 1284 cm−1 and 3010 cm−1 correspond to the symmetric and asymmetric vibrations of –CH2, respectively. The vibrational peaks around 504 cm−1 and 420 cm−1 are assigned to bending and wagging frequencies of –CF2. The scissoring vibration of vinylidene was observed at 1404 cm−1.40 The strong absorption band around 1095 cm−1 is assigned to the main characteristic peak of non resolved anti-symmetric stretching and symmetric stretching of C–O–C in polymer backbone of pure polycrystalline PEO.41
image file: c5ra10843h-f1.tif
Fig. 1 FTIR spectra of (a) PEO/PVDF-HFP, (b) rMWCNT/PEO/PVDF-HFP (c) aMWCNT/PEO/PVDF-HFP membrane and (d) aMWCNT/PEO/PVDF-HFP/electrolyte.

For nanocomposite membranes, the intensity of the peaks decreased in comparison to their polymer blend counterpart (Fig. 1a). Especially in the case of the aMWCNT/PEO/PVDF-HFP composite membrane, the decrease is prominent (Fig. 1c). This decrease in peak intensity indicates the reduction in crystallinity of the polymer membrane in presence of carbon nanomaterials. In addition, no more changes in the peaks position were observed for both randomly oriented and aligned MWCNT composites, thus suggesting that the chemical property of the membranes is not affected by the orientation of MWCNT within the polymer matrix.

In electrolyte incorporated nanocomposite membrane [Fig. 1d], the main characteristic strong absorption band of C–O–C in polymer back bone chains of pure polycrystalline PEO around 1095 cm−1 is shifted towards lower wavenumber region compared to only MWCNT incorporated polymer nanocomposites. This red shift is due to the formation of a transient cross-linking complex between the cations of the electrolyte salt and the ether oxygen of the PEO, so that the generated transition state will weaken the C–O–C stretching vibration and the crystallization of PEO will be decreased.42 Similarly, the carboxylic group of the functionalized MWCNT at 1712 cm−1 has slightly shifted to higher wavenumber. This might be due to the interaction between Li cations in the electrolytes and π-electron clouds of MWCNT through ionic interaction.

3.2. WAXD analysis

Fig. S1(a), (b) and 2(a)–(d) show the WAXD patterns of PEO, PVDF-HFP and PEO/PVDF-HFP blend, MWCNT incorporated PEO/PVDF-HFP composite membranes, respectively. As shown in Fig. 2a and discussed in our previous report, the crystalline peak intensity of PVDF-HFP is diminished with the addition of PEO; it implies that both polymers were properly blended with each other and hinder re-crystallization processes.38 Further, these diffraction peaks were broadened and intensity was decomposed into amorphous phase with the incorporations of MWCNT. The added MWCNT within PEO/PVDF-HFP matrix significantly disturb the long range high molecular weight polymers, hence the crystallinity of the hosts decreased. The lower crystallinity of the polymer electrolyte is expected to contribute towards high ionic conductivity. In fact, large amount of free volume space in the amorphous phase helps to the easy ion migrations without any restriction.
image file: c5ra10843h-f2.tif
Fig. 2 WAXD patterns of (a) PEO/PVDF-HFP, (b) rMWCNT/PEO/PVDF-HFP (c) aMWCNT/PEO/PVDF-HFP and (d) aMWCNT/PEO/PVDF-HFP/electrolyte.

In Fig. 2c, the characteristic peak of MWCNT at 26° with the d-space (002) is about 0.34 nm (Fig. 2b), and it disappeared in electrically aligned MWCNT/PEO/PVDF-HFP nanocomposite membranes. This can be explained considering that, when the MWCNT is electrically aligned in a perpendicular direction within polymer matrix, the incident X-rays are scattered downward direction.43 Thus, the peak intensity is decreased and it is confirmed that the dispersed MWCNT is vertically aligned under external applied electric field. It is expected that aligned MWCNT can provide conducting channels for ions from electrolytes to photoanode. The increased amorphous nature of polymer matrix and vertically aligned MWCNT may lead to higher ionic conductivity through more amount of electrolyte diffusion, which is discussed in next section. There are no additional peaks observed in electrolyte incorporated MWCNT/PEO/PVDF-HFP membrane (Fig. 2d), which indicted that carboxylic groups on the MWCNT, oxygen in PEO and fluorine in PVDF-HFP were coordinated by cations (Li+) of the salt.

3.3. Raman analysis

Raman spectroscopy has also been used to get the additional evidence of MWCNT alignment within the PEO/PVDF-HFP matrix. The Raman spectra of PEO/PVDF-HFP with electrically aligned and randomly oriented MWCNT are shown in Fig. 3. The sharp G-band peak at 1580 cm−1 represents the in-plane vibration of carbon, which is related to the vibration of sp2 bonded carbon atom in graphene wall of CNT (2D hexagonal lattice). The peak at 1350 cm−1 corresponds to D-band, and it is related to the dangling bonds or local defects that originates from structural imperfections.44
image file: c5ra10843h-f3.tif
Fig. 3 Raman spectra of (a) randomly oriented MWCNT and (b) electrically aligned MWCNT within PEO/PVDF-HFP membrane.

From the figures, it is clear that both 1350 cm−1 (D-band) and 1580 cm−1 (G-band) peaks are strong and intense for aMWCNT/PEO/PVDF-HFP membrane (Fig. 3b) in comparison to randomly oriented MWCNT/PEO/PVDF-HFP nanocomposites (Fig. 3a). It is shown in electrically aligned MWCNT/PEO/PVDF-HFP that the intensity of the peaks was comparatively increased and high intense G-band peak is slightly shifted towards lower wavenumber. The sharp intensity of the peaks is attributed to the fact that the incident radiation is parallel to the nanotube axis, which exhibits high Raman shift due to enhanced absorption of molecular polarization and optical conductivity long the nanotube axis. It is reported that when the CNT is vertically aligned, it creates the optical channel within the polymer matrix and hence enhancement in Raman intensity.45

3.4. TEM analysis

The TEM images of electrically aligned and unaligned MWCNT membranes were shown in Fig. 4. It is seen from the Fig. 4a that the incorporated multiwalled carbon nanotubes are randomly oriented in PEO/PVDF-HFP matrix under the absence of electric field (E = 0). However, the nanotubes are aligned in the downward direction (show in arrow) under applied electric field (E > 0) for MWCNT/PEO/PVDF-HFP nanocomposites (Fig. 4b). The results observed in TEM analysis were corroborated by XRD and Raman studies. The similar observation has also been reported by Gahlot et al. for CNT/SPEEK nanohybrid system.36
image file: c5ra10843h-f4.tif
Fig. 4 TEM images of MWCNT/PEO/PVDF-HFP nanocomposite for (a) E = 0 and (b) E > 0, respectively.

3.5. Thermal analysis

DSC thermograms of pure and MWCNT incorporated PEO/PVDF-HFP nanocomposite membranes in a wide range of temperatures from −60 to 200 °C are shown in Fig. 5. The thermal parameters such as the glass transition temperature (Tg), the melting temperatures of PEO (Tm1), PVDF-HFP (Tm2), melting enthalpy of PEO (ΔHm1) and PVDF-HFP (ΔHm2) were derived from the DSC curve. Here, all the samples (nanocomposites as well as blend) show a single glass transition, which indicates that they are miscible with homogeneous phase in the blend electrolyte system. The addition of MWCNT in PEO/PVDF-HFP blend reduces the cohesive force between long range polymer chains, thereby increases the segmental motion and hence the glass transition temperature of incorporated composite membranes were marginally reduces to −22.5 to −24.7 °C compared to pure PEO/PVDF-HFP blend. Generally, the ionic movement is directly correlated with segmental motion of the polymer chains. Therefore, the glass transition temperatures below the room temperature is of fundamental importance for solid state DSSC applications.46 This reduction in Tg can help the effective ion transport in polymer electrolyte. Hence, it is expected that addition of MWCNT enhances the ionic conductivity in the membrane.47
image file: c5ra10843h-f5.tif
Fig. 5 DSC thermal analysis of (a) PEO/PVDF-HFP, (b) rMWCNT/PEO/PVDF-HFP (c) aMWCNT/PEO/PVDF-HFP membranes.

The crystallinity of the polymer hosts represents one of the important parameter for ionic properties. In the present case the crystallization temperature of PEO is about 50–60 °C and it can impede the ionic movement. However, the interruption in crystallinity of PEO could be achieved by the addition of nanomaterials into the PEO/PVDF-HFP matrix.37 In the present study, it is observed from the DSC curve that the thermograms of MWCNT nanocomposite membranes are quite different from pure PEO/PVDF-HFP, which means that the incorporated nanotubes changed the crystallinity of original PEO/PVDF-HFP blend. Therefore, the melting peak of PEO (Tm1) is broadened and enthalpy also decreased. The relative percentage of crystallinity (%χ) was determined according to the following eqn (1)

 
%χ = ΔHmH0m × 100% (1)
where, ΔH0m is the heat of fusion of pure PEO, which is equal to 213.7 J g−1 when it is assumed as a 100% crystalline material.48 ΔHm is the heat of fusion of polymer blend electrolyte. The reduction in crystallinity is observed for MWCNT incorporated nanocomposites in comparison to pristine PEO/PVDF-HFP blend. This may be due to the large surface area of MWCNT and the carboxyl functional groups (C[double bond, length as m-dash]O) of nanotubes which destroy the polymer chain conformation and control the structural organization of PEO. The reduction in crystallinity of PEO/PVDF-HFP blend is expected to enhance ion transport properties, as it will be discussed in forthcoming sections. The similar behavior was observed in CNT incorporated polymer electrolytes by other researchers.49 Further, the relative percentage of crystallinity of aMWCNT/PEO/PVDF-HFP membrane is significantly reduced in comparison to rMWCNT/PEO/PVDF-HFP membrane and it is in agreement with FTIR and WAXD results (discussed in earlier section). The percentage of crystallinity of all the samples is also summarized in the Table 1.

Table 1 Thermal parameters derived from DSC
Polymer composite Crystallinity (%) (PEO) Tg (°C) ΔHm1 (J g−1) ΔHm2 (J g−1)
PEO/PVDF-HFP 21.10 −22.5 45.91 27.12
rMWCNT/PEO/PVDF-HFP 13.10 −22.4 37.61 25.43
aMWCNT/PEO/PVDF-HFP 12.70 −24.7 31.36 25.72
aMWCNT/PEO/PVDF-HFP/electrolyte 11.20 −35.1 23.90


In order to study the effect of incorporation of electrolytes on the thermal properties of PEO/PVDF-HFP, these membranes were also studied. The DSC curve of PEO/PVDF-HFP electrolyte was depicted in Fig. S2. It is interesting to note that the incorporation of electrolyte reduced the Tg, and Tm also shifted to lower temperature. The downward shift in melting temperature of PEO is a due to reduction in crystallinity or localized influence on the high molecular weight polymer chain conformation. The ionic liquid weakened the interactive bonds between chains within polymer electrolyte.50 Hence, the amount of energy required to break the bond is reduced. No melting peak is detected for PVDF-HFP, that indicates the structural transformation took place from crystalline phase to amorphous phase. The relative crystallinity also decreased about 11.2% in compared to pure composite membranes. The results are in good agreements with WAXD data.

TGA and DTA curves of MWCNT incorporated PEO/PVDF-HFP nanocomposite electrolyte membranes are shown in Fig. S3. It is observed that the stability of samples slightly moves down at lower temperature around 70–150 °C with a weight loss of 5–8%. It is well known that this phenomenon is related to the evaporation of moisture on the PEO surface. No other weight losses are observed until 240 °C, followed by a broad weight loss DTA exothermic peak which clearly showed that the degradation of PEO/PVDF-HFP blend started in this range of temperature. This may be due to thermal degradation of random chain scission of C–O bonds in PEO.51 The main degradation products are ethyl alcohol, methyl alcohol, alkenes, non-cyclic ethers (ethoxymethane, ethoxyethane and methoxymethane), formaldehyde, acetic aldehyde, ethylene oxide, water, CO and CO2.37 The thermal stability of the membranes beyond 430 °C is due to the repeating units –(CF2–CF2)– of PVDF-HFP. The chemical bond strength of C–F is approximately 485 kJ mol−1, which is higher than C–H and C–C bond strengths, that are around 435 kJ mol−1, and 410 kJ mol−1 respectively.37 At elevated temperature no more appreciable enhancement in degradation temperature occurred, since the amount of incorporated MWCNT was about 1 wt%. Anyway, the thermal stability of composite electrolyte at high operating temperature is not necessary for practical applications of DSSC.

3.6. UV-visible spectroscopy studies

The UV-visible absorption spectra of PEO/PVDF-HFP and MWCNT incorporated electrolyte membranes are shown in Fig. S4. There are two peaks around 231 nm and 292 nm for the electrolyte samples, which correspond to the redox couples I and I3, respectively.47 It is visualized that intensity of peaks increased with the addition of MWCNT (Fig. S4a). The incorporation of MWCNT in a polymer electrolyte plays the role of Lewis acid–base interaction centers with the ionic species in the electrolyte. The surface hydroxyl groups/carboxyl groups of the acid treated MWCNTs are expected to interact with the salt and increased the amount of free ions. Generally, higher concentrations of I and I3 rapidly provide large number of ions during the photo-electrochemical reaction within polymer electrolyte, resulting in high ionic conductivity.

3.7. Electrochemical impedance spectroscopy (EIS) studies

Fig. 6 shows the ionic conductivity and diffusion coefficient of PEO/PVDF-HFP with different amount of MWCNT. The conductivity of PEO/PVDF-HFP electrolytes was gradually increased with the addition of MWCNT. The electrochemical parameters such as conductivity (σ), mobility (μ), diffusion coefficient (D) and number of charge carriers (n) were calculated from the following eqn (2)–(5).
 
σ = t/RbA (2)
where, t is the thickness of the membrane, Rb is bulk resistance; A is the area of electrode in contact with electrolyte membrane. The intercept of the Nyquist plot (Zvs. Z′′) with the real axis at higher frequency region is taken as a bulk resistance (Rb) of polymer electrolyte membranes.
 
image file: c5ra10843h-t1.tif(3)
 
image file: c5ra10843h-t2.tif(4)
 
image file: c5ra10843h-t3.tif(5)
where, d = thickness of sample/2, δ = d/λ, λ = ε0εA/k−1 is the electrical double layer thickness, A is the area of electrolyte membrane, ε0 is vacuum permittivity, ε dielectric constant of polymer blend electrolytes τ2 = 1/ω2, ω2 is the angular frequency at which the spike interest at the real impedance axis.37,47

image file: c5ra10843h-f6.tif
Fig. 6 (a) Ionic conductivity and (b) diffusion coefficient of MWCNT incorporated PEO/PVDF-HFP electrolyte.

The conductivity approached maximum of 2.71 mS cm−1 at 1 wt% MWCNT and decreased upon further addition. The addition of MWCNTs helps to reduce the folding of polymer chains, which causes the increase of the free volume space due to the high aspect ratio of the filler. Thus, the impedance of the conduction paths within the polymer is reduced and ion transport enhanced.

In general the lowering of Tg and reduction of crystallinity (see Fig. 2 and 3) are the main factors for the enhancement of ion transport properties (as discussion in previous section). The polymer backbone is accompanied by improved molecular motion (segmental motion) at higher temperature than glass transition temperature (Tg). Hence the bond rotation of the polymer chain and the kinetic energy of the molecules are increased. The high degree of rotation freedom of molecules within the polymer backbone promotes the decoupling/dissociating nature of the charge carriers (I; anions). Therefore, the number of charge carriers increased and it favors for ionic transportation, which leads to increase the ionic conductivity.37,50

However, in the present work the lowering of Tg and reduction of crystallinity is not only the reason for higher ionic conductivity, but also there might be an interaction between redox salt and MWCNT. The interaction may arise from strong electron affinity of cations in the redox salt (Li+) to the negative charges of the electron clouds in the outer surface of the MWCNTs as well as carboxyl group of acid treated MWCNTs; it reduces the ion pair formations and increases the free ions (I and I3) which is also evidenced from UV-visible spectra of PEO/PVDF-HFP electrolytes (Fig. S4). The similar fashion was observed in our earlier report, a new additional interaction of cation in electrolyte salt with surface organic functional groups in silane modified TiO2/PEO/PVDF-HFP electrolytes.37 The additional interactions may help to dissociate a larger amount of salt. Hence, the ion transport properties were increased. Moreover, the interaction of CNT with polymer network and formation of continuous free voids helped for ion transport within PEO/PVDF-HFP electrolytes. Thus, the hydrogen bonding between the surface functional groups of MWCNT and ether oxygen in PEO as well as fluorine atom in PVDF-HFP will skew the polymer chain, thus creating more pathways for better ion mobility.

The ionic conductivity decreases at (>1% wt) higher concentration of MWCNT, and this is due to the insulation of nanotubes within the polymer matrix. It is known that higher amounts of nanofillers also lead to well-defined crystallite regions and the added filler beyond the optimum level may catalyze aggregation of polymer chains and thus increase the rate of recrystallization processes.52 The similar behavior was observed for CNT and other inorganic nanoparticles incorporated polymer electrolytes for electrochemical device applications.53,54 The results revealed that enhancement of the ion conductivity cannot be attributed to the electronic properties of CNT.

In order to further improve the ionic conductivity, the optimized electrolyte solution was introduced into electric field for uniform alignment. It is interesting to note that ionic conductivity of the electrolyte is doubly increased upto 5.72 mS cm−1. The difference in dielectric constant of MWCNT and polymer matrix caused the creation of dipole moments under applied external electric field.

The strong dipole moment in the axis parallel to the length of the nanotube aligns the MWCNTs along the direction of applied electric field and perpendicular to the parallel plate electrodes. The electrostatic repulsive force helps in proper dispersion for MWCNTs, because their length is lower than the thickness of the polymer membrane. Hence, the sedimentations of nanotubes at the bottom side of the polymer solution were avoided. The aligned MWCNT in polymer matrix were linked up with each other forming an interconnecting rope like structure. The aligned CNT structures provided easy conduction path for fast ion migrations in perpendicular direction within the electrolytes. Therefore, diffusion of ions also increased.34

The ionic conductivity, ionic mobility, diffusion coefficient and number of charge carriers within the blend electrolytes were derived and summarized in Table 2. All other electrical parameters also increased for electrically aligned MWCNT/PEO/PVDF-HFP electrolyte system. The similar behavior of enhanced gas permeation was observed by A. Sharma et al. for hydrogen gas separation in fuel cell applications.35

Table 2 Electrochemical parameters of PEO/PVDF-HFP composite membranes derived from EIS measurements
Amount of MWCNT (wt%) in PEO/PVDF-HFP Conductivity (S cm−1) Diffusion coefficient (cm2 s−1) No. of charge carrier (cm−3) Ionic mobility (cm2 V−1 s−1)
0.2 8.28 × 10⁻⁵ 2.57 × 10⁻⁹ 5.18 × 10²¹ 9.99 × 10⁻⁸
0.4 7.68 × 10⁻⁵ 3.64 × 10⁻⁹ 3.39 × 10²¹ 1.42 × 10⁻⁷
0.6 1.30 × 10⁻⁴ 3.78 × 10⁻⁹ 3.31 × 10²² 1.47 × 10⁻⁷
0.8 7.70 × 10⁻⁴ 5.22 × 10⁻⁹ 3.18 × 10²² 1.51 × 10⁻⁷
1.0 2.71 × 10⁻³ 6.64 × 10⁻⁹ 6.56 × 10²² 2.58 × 10⁻⁷
1.2 1.52 × 10⁻³ 6.10 × 10⁻⁹ 4.02 × 10²² 2.37 × 10⁻⁷
1.4 8.24 × 10⁻⁴ 5.93 × 10⁻⁹ 2.23 × 10²² 2.31 × 10⁻⁷
1.0 (aMWCNT) 5.72 × 10⁻³ 1.34 × 10⁻⁸ 6.86 × 10²² 5.21 × 10⁻⁷


3.8. Linear voltammetry studies

The transport properties of (I/I3) redox couples in electrolytes membranes play the major role in efficiency of DSSCs. The steady state voltammograms of PEO/PVDF-HFP and rMWCNT/PEO/PVDF-HFP and aMWCNT/PEO/PVDF-HFP electrolytes were conducted at room temperature and are shown in Fig. 7.
image file: c5ra10843h-f7.tif
Fig. 7 Steady state voltammograms of (a) PEO/PVDF-HFP (b) rMWCNT/PEO/PVDF-HFP and (c) aMWCNT/PEO/PVDF-HFP electrolytes.

From the cathodic and anodic steady state limiting current (Iss), the apparent diffusion coefficient (Dapp) of I3 and I respectively can be derived from the following eqn (6)

 
Iss = 4nRFCDapp (6)
where, n is the number of electrons involved in each electrochemical reaction, F is the Faraday constant, R is the radius of ultra microelectrode, and C is the concentration of electroactive species.

Generally, the apparent diffusion coefficient is classified into two different diffusion mechanisms as shown in the following eqn (7)

 
Dapp = Dphys + Dex (7)
where Dphys and Dex are the physical diffusion coefficient and exchange reaction-based diffusion coefficient, respectively. The Dphys is the diffusion of ions in the electrolyte, whereas Dex related to the charge transport dominated by the contribution from the exchange reaction of I and I3 within the electrolytes. Huang et al. reported that, if the conductivity of the electrolytes is constant for all samples, then the diffusion coefficient fully depends on Dex. However, in the present case the physical and exchange diffusion mechanisms take place for all composite electrolytes.55

The addition of MWCNT within PEO/PVDF-HFP marginally increased the diffusion coefficient of the redox couples. The additional free space created near the particles surface of the nanotube generates more room for I/I3 mobility and particularly favor the mobility of the relatively larger size tri-iodide (I3). The dominant characteristics of Dapp (I) among the redox couples (I and I3) in all the PEO/PVDF-HFP composite electrolyte is mainly due to its smaller ionic radius. The determined ionic diffusion coefficient (I3/I) from steady state voltammetry is also in agreement with EIS results in the earlier section and mentioned in Table 3. The enhancement in ionic diffusion coefficient (Dapp) of PEO/PVDF-HFP blends is higher for electrically aligned MWCNT than randomly aligned counterpart. It is assumed that the aligned nanotubes created an additional pathway along the vertical direction; hence the apparent diffusion coefficient is increased.

Table 3 Apparent diffusion coefficient of anions (I and I3) in the polymer membrane electrolytes
PEO/PVDF-HFP electrolyte Dapp (I3) (cm2 s−1) Dapp (I) (cm2 s−1)
Without MWCNT 1.94 × 10⁻⁹ 2.8 × 10⁻⁹
rMWCNT 4.71 × 10⁻⁹ 5.2 × 10⁻⁹
aMWCNT 5.97 × 10⁻⁹ 7.1 × 10⁻⁹


3.9. Photovoltaic performance of DSSC

The photocurrent density–voltage (JV) characteristics curves for the best cells at 100 mW cm−2 irradiation are shown in Fig. 8. The photovoltaic parameters for all cells are summarized in Table 4.
image file: c5ra10843h-f8.tif
Fig. 8 JV characteristics curves of (a) PEO/PVDF-HFP, (b) rMWCNT/PEO/PVDF-HFP and (c) aMWCNT/PEO/PVDF-HFP electrolytes based DSSCs.
Table 4 Photovoltaic parameters of DSSCs with PEO/PVDF-HFP and its nanocomposite electrolytes
Electrolytes Voc (V) Jsc (mA cm−2) FF (%) Efficiency (%) References
PEO/PVDF-HFP 0.75 ± 0.01 2.1 ± 0.12 63 ± 1 0.9 ± 0.03 Present
rMWCNT/PEO/PVDF-HFP 0.74 ± 0.005 6.5 ± 0.06 63 ± 1 3.2 ± 0.02 Present
aMWCNT/PEO/PVDF-HFP 0.73 ± 0.01 8.2 ± 0.04 64 ± 1 3.8 ± 0.02 Present
Liquid electrolyte 0.76 ± 0.01 11 ± 0.02 68 ± 1 6.3 ± 0.01 Present
1% CNT/PEO 0.59 10.6 56 3.5 64
PVA/MWCNT/PAni 0.36 10.8 56 2.2 65
TNT/PEO electrolyte 0.37 0.58 58 0.124 66


It can be observed that the conversion efficiency of DSSC significantly increased for MWCNT incorporated PEO/PVDF-HFP electrolytes in comparison with pure PEO/PVDF-HFP electrolyte. With the addition of MWCNT within the PEO/PVDF-HFP blend, photo-current density (Jmax) increased from 1.83 ± 0.02 mA cm−2 to 5.1 ± 0.01 mA cm−2. Further increase in Jmax (6.5 ± 0.01 mA cm−2) could be achieved by the alignment of MWCNTs within the polymer matrix. It is well known that the performance of DSSC is mainly determined by effective transport behaviour of I and I3 ions. Here, the incorporated MWCNT may sufficiently reduce the ohmic resistance to increase the electron exchange in PEO/PVDF-HFP electrolyte network of the electrolyte region as well as reduce the ion diffusion resistance of polymer electrolytes by creating ion conducting pathways.

In addition, the improvement in the efficiency (3.2 ± 0.02%) and Jsc (6.5 ± 0.06 mA cm−2) for rMWCNT/PEO/PVDF-HFP electrolyte is mainly due to the reduction in the crystallinity followed by increasing ionic conductivity to about 2.71 × 10⁻³ S cm−1. The more free volume space in amorphous phase of rMWCNT/PEO/PVDF-HFP electrolyte can provide easy migration of ions from electrolyte to electrode. Furthermore, high Jsc (8.2 ± 0.04 mA cm−2) and hence better performance (efficiency = 3.8 ± 0.02%) of DSSCs based on electrically aligned MWCNT/PEO/PVDF-HFP electrolyte is due to reduced ionic diffusion length. This is also consistent with the high ionic conductivity and high apparent diffusion coefficient of redox couples (I/I3) from EIS measurements and linear cyclic voltammetry (LSV) of the electrolytes (discussed in former section). The electrochemical catalytic activity of MWCNT helps in electron exchange reaction (I/I3) within the polymer gel electrolyte and high free ions concentration, resulting in improvement in short circuit current density (Jsc).

Even though an enhancement is achieved in the conversion efficiency for randomly oriented and aligned MWCNT incorporated PEO/PVDF-HFP electrolyte, the Voc was slightly reduced. This reduction in Voc is essentially determined by recombination between the conduction band electrons and I3 ions in the redox couples. The high surface area of contact polymer between nanocomposite electrolyte with the photoanode (TiO2/ZnO) accompanied with a higher probability of electron recombination losses was observed for aligned MWCNT incorporated PEO/PVDF-HFP electrolyte.56 Generally, the high efficient (η > 5%) DSSCs employ purely liquid based electrolytes.56–61 However; the efficiency (η ∼4%) in the present work is comparable with recently reported efficiency (η, 2–5%) of similar electrolyte systems.62,63

For comparison, liquid electrolyte based devices were also fabricated and the best efficiency was ∼6.4% (Fig. S5 and Table 4). Nevertheless, the main concern of the present work was to study the effect of the aligned MWCNT/PEO/PVDF-HFP nanocomposites on the conversion efficiency of DSSC as compared with pure PEO/PVDF-HFP and randomly oriented MWCNT/PEO/PVDF-HFP electrolyte systems.

3.10. Internal resistance of DSSC

The electrochemical impedance spectroscopy (EIS) was carried to investigate the electron transfer kinetics and the internal resistance of different interfaces of DSSC under the illumination of 100 mW cm−2. Fig. 9 shows the EIS spectra of DSSC based on PEO/PVDF-HFP and its composites electrolytes. It is clearly seen that three distinct semi-circles were observed in the frequency range of 10−3 Hz to 106 Hz. These semicircles are due to Nernst diffusion within the electrolyte, the electron transfer at the TiO2–ZnO (photoanode)/electrolyte interface and the redox reaction at the counter electrode. The experimental EIS data fitted with equivalent circuit (Fig. S6) and charge transfer resistance of each interface were derived. From the Fig. 9, Rs is denoted as the series resistance of the electrolytes and electric contacts in the DSSCs. Rct1, Rct2 and Rdiff correspond to the charge transfer process occurring at the MWCNT/Nafion® counter electrode/electrolyte (1st arc), the FTO/TiO2–ZnO/electrolyte interface (2nd arc) and the Warburg element of the ionic diffusion for the redox-couple (I/I3) in the electrolyte (3rd arc), respectively.37,67 The EIS parameters were derived using equivalent circuit (Fig. S6) and summarized in Table 5.
image file: c5ra10843h-f9.tif
Fig. 9 EIS spectra of DSSC with different electrolytes (a) PEO/PVDF-HFP (b) rMWCNT PEO/PVDF-HFP and (c) aMWCNT/PEO/PVDF-HFP.
Table 5 EIS parameter of DSSC under 100 mW cm−2 illumination
Electrolyte PEO/PVDF-HFP rMWCNT/PEO/PVDF-HFP aMWCNT/PEO/PVDF-HFP
Rct1 10 11 9
Rct2 50 40 32
Rdiff 34 15 8


DSSC based on aMWCNT electrolyte shows smaller Rct2 and Rdiff than pristine and rMWCNT incorporated PEO/PVDF-HFP (see Table 5). It is mainly attributed to the uniform dispersion and vertical alignment of MWCNT within the PEO/PVDF-HFP matrix, thus facilitating the high ionic diffusion coefficient (I/I3) rather than randomly oriented CNT based electrolytes. Hence, the photocurrent and solar energy conversion efficiency of aMWCNT/PEO/PVDF-HFP based DSSC have been significantly increased.

3.11. Stability of DSSC

In order to study the reproducibility of the device, photo-response study has been carried out using chronoamprometry technique under light illumination on/off and shown in Fig. 10. The results are in good agreement with JV characteristics (Fig. 8). When the light is turned on photocurrent is reached to 8.31 mA cm−2 and exhibits an initial decay followed by stable value. The initial decay in photocurrent is due to the recombination of photo-generated charge carriers through the surface states.68 The steady state photocurrent after small decay is pointed out that the dye molecules have been rapidly injecting electrons to the conduction band of semiconducting photoanode and regenerated by getting the electrons from rMWCNT/PEO/PVDF-HFP electrolytes during redox reaction. Further photo-current steep down, when the light turned off. The photocurrent generation is prompt and stable in the periodic time interval under several on–off cycles, which revealed that the cell exhibit good stability and reproducibility.
image file: c5ra10843h-f10.tif
Fig. 10 Photocurrent behavior as a function of time (It) for rMWCNT/PEO/PVDF-HFP electrolyte based DSSC.

4. Conclusions

In summary, solid state dye sensitized solar cell based on aligned MWCNT/PEO/PVDF-HFP blend electrolyte has been successfully proposed. The carbon nanotubes in the polymer matrix were electrically aligned by applying external DC electric field of 440 V cm−1. The reduction of crystallinity of PEO/PVDF-HFP nanocomposite was confirmed from WAXD and DSC. The alignment of MWCNT was confirmed through the intensity variation from XRD diffractogram and Raman spectra. The free ion concentration of the electrolytes was studied by UV-visible spectroscopy and it was found to increase with the addition of MWCNTs. The ionic conductivity was found to be increased approximately two times by the introduction of aligned MWCNTs within the polymer matrix (PEO/PVDF-HFP blend) in comparison to its randomly oriented nanocomposite electrolyte counterpart. The apparent diffusion coefficient (Dapp) of redox couples (I/I3) has also been enhanced for electrically aligned MWCNT/PEO/PVDF-HFP electrolyte. The fabricated DSSC with aligned MWCNT based nanocomposite electrolyte membrane shows a maximum photoconversion efficiency of about 4% under the illumination of 100 mW cm−2. The DSSC based on aMWCNT/PEO/PVDF-HFP electrolytes also shows lower internal charge transfer resistance than pristine and rMWCNT incorporated blend membranes. The above results suggested that alignment of CNTs within polymer electrolytes is an effective approach to enhance the ion transport properties.

References

  1. B. O'Regan and M. Gratzel, Nature, 1991, 353, 737 CrossRef PubMed.
  2. F. Bella, D. Pugliese, J. R. Nair, A. Sacco, S. Bianco, C. Gerbaldi, C. Barolo and R. Bongiovanni, Phys. Chem. Chem. Phys., 2013, 15, 3706 RSC.
  3. F. Bella, A. Sacco, G. P. Salvador, S. Bianco, E. Tresso, C. F. Pirri and R. Bongiovanni, J. Phys. Chem. C, 2013, 117, 20421 CAS.
  4. D. Pugliese, A. Lamberti, F. Bella, A. Sacco, S. Bianco and E. Tresso, Org. Electron., 2014, 15, 3715 CrossRef CAS PubMed.
  5. K. W. Ko, M. Lee, S. S. Sekhon, S. K. Balasingam, C. H. Han and Y. Jun, ChemSusChem, 2013, 6, 2117 CrossRef CAS PubMed.
  6. S. Mathew, A. Yella, P. Gao, R. H. Baker, B. F. E. Curchod, N. A. Astani, I. Tavernelli, U. Rothlisberger, Md. K. Nazeeruddin and M. Grätzel, Nat. Chem., 2014, 6, 242 CrossRef CAS PubMed.
  7. J. Wu, Z. Lan, J. Lin, M. Huang, Y. Huang, L. Fan and G. Luo, Chem. Rev., 2015, 115, 2136 CrossRef CAS PubMed.
  8. O. Byrne, I. Ahmad, P. K. Surolia, Y. K. Gunko and K. R. Thampi, Sol. Energy, 2014, 110, 239 CrossRef CAS PubMed.
  9. (a) O. A. Ileperuma, Mater. Tech., 2013, 28, 65 CrossRef CAS PubMed; (b) F. Bella, N. N. Mobarak, F. N. Jumaah and A. Ahmad, Electrochim. Acta, 2015, 151, 306 CrossRef CAS PubMed.
  10. (a) C. L. Chen, T.-W. Chang, H. Teng, C.-G. Wu, C.-Y. Chen, Y.-M. Yang and Y.-L. Lee, Phys. Chem. Chem. Phys., 2013, 15, 3640 RSC; (b) A. Sacco, F. Bella, S. D. L. Pierre, M. Castellino, S. Bianco, R. Bongiovanni and C. F. Pirri, ChemPhysChem, 2015, 16, 960 CrossRef CAS PubMed.
  11. Y. S. Kwon, J. Lim, I. Song, I. Y. Song, W. S. Shin, S. J. Moon and T. Park, J. Mater. Chem., 2012, 22, 8641 RSC.
  12. L. Tao, Z. Huo, S. Dai, Y. Ding, J. Zhu, C. Zhang, B. Zhang, J. Yao, M. K. Nazeeruddin and M. Grätzel, J. Phys. Chem. C, 2014, 118, 16718 CAS.
  13. A. L. Sharma and A. K. Thakur, Ionics, 2010, 16, 339 CrossRef CAS.
  14. Y. Duan, Q. Tang, Y. Chen, Z. Zhao, Y. Lv, M. Hou, P. Yang, B. He and L. Yu, J. Mater. Chem. A, 2015, 3, 5368 CAS.
  15. H. C. Lee, H. Cheol, A. M. Shaheer, P. J. Geun, K. K. Ju, S. K. Lee, S. K. Yang and O. Bong, J. Nanosci. Nanotechnol., 2010, 10, 3502 CrossRef CAS PubMed.
  16. F. S. Freitas, J. N. D Freitas, B. I. Ito, A. de Paoli and A. F. Nogueira, ACS Appl. Mater. Interfaces, 2009, 1, 2870 CAS.
  17. H. S. Lee, C. H. Han, Y. M. Sung, S. S. Sekhon and K. J. Kim, Curr. Appl. Phys, 2011, 11, S158 Search PubMed.
  18. A. Chiappone, F. Bella, J. R. Nair, G. Meligrana, R. Bongiovanni and C. Gerbaldi, ChemElectroChem, 2014, 1, 1350 CrossRef CAS PubMed.
  19. F. Bella, J. R. Nair and C. Gerbaldi, RSC Adv., 2013, 3, 15993 RSC.
  20. R. Singh, N. A. Jadhav, S. Majumder, B. Bhattacharya and P. K. Singh, Carbohydr. Polym., 2013, 91, 682 CrossRef CAS PubMed.
  21. P. K. Singh, B. Bhattacharya, R. K. Nagarale, K. W. Kim and H. W. Rhee, Synth. Met., 2010, 160, 139 CrossRef CAS PubMed.
  22. L. Pinjiang, Y. Zhang, W. Fa, Y. Zhang and B. Huang, Carbohydr. Polym., 2011, 86, 1216 CrossRef PubMed.
  23. X. Huang, Y. Liu, J. Deng, B. Yi, X. Yu, P. Shen and S. Tan, Electrochim. Acta, 2012, 80, 219 CrossRef CAS PubMed.
  24. H. W. Ho, W. Y. Cheng, Y. C. Lo, T. C. Wei and S. Y. Lu, ACS Appl. Mater. Interfaces, 2014, 6, 17518 CAS.
  25. M. Sivakumar, R. Subadevi and R. M. Pradeepa, AIP Conf. Proc., 2013, 1536, 857 CrossRef CAS PubMed.
  26. H. Chae, D. Song, Y. G. Lee, T. Son, W. Cho, Y. B. Pyun, T. Y. Kim, J. H. Lee, F. F. Santiago, J. Bisquert and Y. S. Kang, J. Phys. Chem. C, 2014, 118, 16510 CAS.
  27. M. Sethupathy, S. Ravichandran and P. Manisankar, Int. J. Electrochem. Sci., 2014, 9, 3166 Search PubMed.
  28. K. Dong, G. Zhou, X. Liu, X. Yao and S. Zhang, J. Phys. Chem. C, 2009, 113, 10013 CAS.
  29. N. Khongchareon, S. Choopun, N. Hongsith, A. Gardchareon, S. Phadungdhitidhada and D. Wongratanaphisan, Electrochim. Acta, 2013, 106, 195 CrossRef CAS PubMed.
  30. J. E. Benedetti, A. A. Corrêa, M. Carmello, L. C. P. Almeida, A. S. Gonçalves and A. F. Nogueira, J. Power Sources, 2012, 208, 263 CrossRef CAS PubMed.
  31. Y. C. Wang, K. C. Huang, R. X. Dong, C. T. Liu, C. C. Wang, K. C. Ho and J. J. Lin, J. Mater. Chem., 2012, 22, 6982 RSC.
  32. Y.-H. Chang, P.-Y. Lin, S.-R. Huang, K.-Y. Liu and K.-F. Lin, J. Mater. Chem., 2012, 22, 15592 RSC.
  33. S. U. Lee, W. S. Choi and B. Hong, Sol. Energy Mater. Sol. Cells, 2010, 94, 680 CrossRef CAS PubMed.
  34. A. Sharma, S. Kumar, B. Tripathi, M. Singh and Y. K. Vijay, Int. J. Hydrogen Energy, 2009, 34, 3977 CrossRef CAS PubMed.
  35. A. Sharma, B. Tripathi and Y. K. Vijay, J. Membr. Sci., 2010, 361, 89 CrossRef CAS PubMed.
  36. S. Gahlot and V. Kulshrestha, ACS Appl. Mater. Interfaces, 2015, 7, 264 CAS.
  37. K. Prabakaran, S. Mohanty and S. K. Nayak, RSC Adv., 2015, 5, 40491 RSC.
  38. M. Deka and A. Kumar, Bull. Mater. Sci., 2009, 32, 627 CrossRef CAS.
  39. S. Rajendran, O. Mahendran and R. Kanan, Mater. Chem. Phys., 2002, 74, 52 CrossRef CAS.
  40. D. Saikia and A. Kumar, Electrochim. Acta, 2004, 49, 2581 CrossRef CAS PubMed.
  41. Y. Y. Hao, J. Peng, W. Furong, W. Lefu and L. Xuehui, Sci. China: Chem., 2012, 55, 1608 CrossRef.
  42. S. Bose, A. R. Bhattacharyya, A. R. Kulkarni and P. Potschke, Compos. Sci. Technol., 2009, 69, 365 CrossRef CAS PubMed.
  43. A. Cao, C. Xu, J. Liang, D. Wu and B. Wei, Chem. Phys. Lett., 2001, 344, 13 CrossRef CAS.
  44. S. B. Jagtap, R. K. Kushwaha and D. Ratna, J. Appl. Polym. Sci., 2012, 127, 5028 CrossRef PubMed.
  45. M. S. Mauter, M. Elimelech and C. O. Osuji, ACS Nano, 2010, 4, 6651 CrossRef CAS PubMed.
  46. J. E. Benedetti, A. A. Correa, M. Carmello, L. C. P. Almeida, A. S. Gonçalves and A. F. Nogueira, J. Power Sources, 2012, 208, 263 CrossRef CAS PubMed.
  47. K. Prabakaran, S. Mohanty and S. K. Nayak, J. Mater. Sci.: Mater. Electron., 2015, 6, 3887 CrossRef.
  48. A. M. M. A. Ali, R. H. Y. Subban, H. Bahron, T. Winnie, F. Latif and M. Z. A. Yahya, Ionics, 2008, 14, 491 CrossRef CAS.
  49. M. Ulaganathan and S. Rajendran, Soft Mater., 2010, 8, 358 CrossRef CAS PubMed.
  50. C.-W. Liew, Y. S. Ong, J. Y. Lim, C. S. Lim, K. H. Teoh and S. Ramesh, Int. J. Electrochem. Sci., 2013, 8, 7779 CAS.
  51. P. S. Claire, Macromolecules, 2009, 42, 3469 CrossRef.
  52. S. Ramesh, K. Ramesh and A. K. Arof, Int. J. Electrochem. Sci., 2013, 8, 8348 CAS.
  53. K. Prabakaran, S. Mohanty and S. K. Nayak, Int. J. Plast. Technol., 2014 DOI:10.1007/s12588-014-9089-5.
  54. R. Sharma, A. Sil and S. Ray, Polym. Compos., 2015 DOI:10.1002/pc.23372.
  55. K.-C. Huang, Y.-H. Chang, C.-Y. Chen, C.-Y. Liu, L.-Y. Lin, R. Vittal, C.-G. Wu, K.-F. Lin and K.-C. Ho, J. Mater. Chem., 2011, 21, 18467 RSC.
  56. Z. Lan, J. Wu, J. Lin, M. Huang, S. Yin and T. Sato, Electrochim. Acta, 2007, 52, 6665 CrossRef PubMed.
  57. A. K. Arof, H. K. Jun, L. N. Sim, M. Z. Kufian and B. Sahraoui, Opt. Mater., 2014, 36, 135 CrossRef PubMed.
  58. S. P. Lim, A. Pandikumar, N. M. Huang and H. N. Lim, RSC Adv., 2014, 4, 38111 RSC.
  59. L. Yu, W. Shi, L. Lin, Y. Liu, R. Li, T. Peng and X. Li, Dalton Trans., 2014, 8421 RSC.
  60. L. Wei, Y. Yang, R. Fan, P. Wang, L. Li, J. Yu, B. Yang and W. Cao, RSC Adv., 2013, 3, 25908 RSC.
  61. T. M. W. J. Bandara, W. J. M. J. S. R. Jayasundara, M. A. K. L. Dissanayake, I. Albinsson and B. E. Mellander, Phys. Chem. Chem. Phys., 2012, 14, 8620 RSC.
  62. X. Zhang, J. Liu, S. Li, X. Tan, M. Yu and J. Du, RSC Adv., 2013, 3, 18587 RSC.
  63. U. Nithiyanantham, R. Ananthakumar and S. Kundu, RSC Adv., 2014, 4, 35659 RSC.
  64. M. S. Akhtar, J.-G. Park, H.-C. Lee, S.-K. Lee and O.-B. Yang, Electrochim. Acta, 2010, 55, 2418 CrossRef PubMed.
  65. B. C. Nath, B. Gogoi, M. Boruah, S. Sharma, M. Khannam, G. A. Ahmed and S. K. Dolui, Electrochim. Acta, 2014, 146, 106 CrossRef CAS PubMed.
  66. S. Suresh, A. Pandikumar, S. Murugesan, R. Ramaraj and S. P. Raj, Sol. Energy, 2011, 85, 1787 CrossRef CAS PubMed.
  67. K. Prabakaran, S. Mohanty and S. K. Nayak, Ceram. Int., 2015, 41, 11824 CrossRef CAS PubMed.
  68. T. C. Dang, D. L. Pham, H. L. Nguyen and V. H. Pham, Adv. Nat. Sci.: Nanosci. Nanotechnol., 2010, 1, 035010 CrossRef.

Footnote

Electronic supplementary information (ESI) available. See DOI: 10.1039/c5ra10843h

This journal is © The Royal Society of Chemistry 2015
Click here to see how this site uses Cookies. View our privacy policy here.