DOI:
10.1039/C5RA10091G
(Paper)
RSC Adv., 2015,
5, 69829-69838
Treatment of pharmaceutical wastewater for reuse by coupled membrane-aerated biofilm reactor (MABR) system
Received
28th May 2015
, Accepted 10th August 2015
First published on 11th August 2015
Abstract
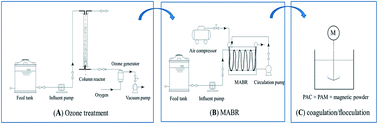
The high-concentration pharmaceutical intermediate wastewater treatment was studied experimentally by using a coupled membrane-aerated biofilm reactor (MABR) system, which included ozone oxidation as pre-treatment, MABR biochemical method, and improved coagulation–flocculation technology as post-treatment. First, the influence of ozone production rate and reaction time on chemical oxygen demand (COD) reduction and biochemical oxygen demand (BOD5)/COD (B/C) ratio was explored. 53% COD reduction and an increase of B/C ratio from 0.22 to 0.46 were achieved under the conditions of 6 g h−1 of dose and 30 min of reaction time. Subsequently, multi-group continuous experiments were conducted to investigate the effect of hydraulic retention time (HRT), aeration pressure, and flow velocity on C and N removals in MABR system. With 24 h HRT, aeration pressure of 0.15 MPa, and flow velocity of 0.08 m s−1, 95% COD removal and 92% total nitrogen (TN) reduction were obtained simultaneously in the MABR process. Finally, the improved coagulation–flocculation was applied using polyaluminium chloride (PAC, 1.2 g L−1) combined with polyacrylamide (PAM, 2 mg L−1) and magnetic powder (8–10 g L−1) to generate excellent effluent quality for industrial reuse in China (GB/T 19923-2005). In conclusion, O3-MABR-improved coagulation/flocculation technology was feasible for treating pharmaceutical intermediate wastewater for reuse.
1. Introduction
Abundant pharmaceutical intermediates produced every year in China are mainly used in the essence, medicine, and pesticides industries.1 The synthesis of these matters involves sophisticated organic reactions; thus, pharmaceutical intermediate wastewater is characterized by high concentrations of COD and TN and various volatile organic constituents.2–5 Approximately half of the pharmaceutical wastewater produced worldwide is released without any treatment,6 resulting in severe environmental problems. Hence, these toxic substances must be strictly removed to satisfy stringent water quality regulations and demand for increased water reuse rate.7,8
Generally, biological treatment is the most common and most economical wastewater treatment method.9,10 However, traditional biological methods are insufficient in removing all potentially hazardous constituents of the wastewater;11–14 in particular, effective simultaneous removal of carbon and nitrogen could not be achieved. Membrane-aerated biofilm reactor (MABR) is an emerging bioprocess technology in which gas-permeable membranes are used as the carrier of microbes and bubble less aerator.15 As gas transfer efficiency is higher in a membrane aerator than in conventional bubble diffusers, membrane aeration has the following advantages: lower operating costs16 and emission of volatile pollutants.17 Oxygen and contaminants diffuse into the biofilm adhering on the membrane from opposite sides. Thus, the unique stratification of functional organisms in biofilm is easily generated and the simultaneous removal of carbon and nitrogen in a single chamber can be potentially completed.18–22 Additionally, the large specific surface area of attached biomass supplied by hollow fiber membranes allows the achievement of high strength COD and nitrogen removal in MABR.
However, MABR is not cost-efficient for the treatment of raw industrial wastewater, such as pharmaceutical intermediate wastewater and chemical organic wastewater with relatively lower (BOD)5/COD ratio than 0.3. The most common physiochemical methods that have played a key role in the treatment of refractory wastewater are the following: advanced oxidation processes (AOPs),23,24 coagulation/flocculation,25,26 and activated carbon adsorption.27,28 These methods have been successfully used in the mineralization of non-degradable matter in the wastewater. However, when these technologies are used alone, removal effects are not obvious. Therefore, excellent treatment efficiency for pharmaceutical intermediate wastewater requires a combination of many treatment techniques. In our previous research, we attempted to design and set up an integrated MABR system for pharmaceutical wastewater treatment.29 This system mainly combined the use of MABR process and activated carbon adsorption, thereby producing low effluent COD and NH4+-N concentrations. However, the hydrolysis/acidification pretreatment consumed much time (>36 h), thereby resulting in low operational efficiency and high running cost. Thus, a more effective integrated MABR system should be developed to promote the treatment of pharmaceutical intermediate wastewater.
In this study, O3-based AOPs were introduced in the first stage of the treatment process to increase biodegradability of raw pharmaceutical intermediate wastewater and allow degradation in the MABR system. Subsequently, a novel curtain-type membrane-aerated biofilm reactor was established to reduce COD, TN, and NH4-N. Finally, a coagulation–flocculation process was conducted as post-treatment to guarantee the effluent water quality for industrial reuse.
2. Materials and methods
2.1 Pharmaceutical intermediate wastewater
Raw wastewater was derived directly from Cangzhou Kangda Pharmaceutical Company in Tianjin (China). The raw wastewater was characterized by high concentrations of COD and TN (especially organic nitrogen), bad biodegradability, and high turbidity. The detailed water quality parameters are presented in Table 1.
Table 1 Physicochemical parameters of pharmaceutical intermediate wastewater
| Parameters |
COD (mg L−1) |
TN (mg L−1) |
NH4+-N (mg L−1) |
pH |
Turbidity (NTU) |
BOD (mg L−1) |
| Values |
2058 ± 110.5 |
62.6 ± 1.3 |
12.4 ± 1.3 |
7.2 ± 0.4 |
404 ± 12.6 |
456 ± 10.3 |
2.2 Pretreatment-ozone oxidation process
In this process, ozonation treatment was performed in an ozone oxidation device. As shown in Fig. 1(a), this system consisted of four parts, as follows: an oxygen container as oxygen source, a bench-scale ozone generator (GUOLIN, China), a vacuum pump used for circulation of cooling water, and a simple bubble column reactor (1.4 L). In the process, the pharmaceutical intermediate wastewater was pumped into the bubble column reactor. Then, the wastewater was thoroughly blended with the O3 rising from the bottom of reactor. Ozone yield rate was controlled at 2, 4, 6, and 8 g h−1 for 30 min, respectively. Samples were collected and analyzed in terms of COD concentration and B/C ratio every 5 min.
 |
| | Fig. 1 Schematic diagram of the hybrid MABR system: (a) ozone treatment, (b) MABR process, (c) coagulation/flocculation treatment. | |
2.3 Biological treatment-MABR process
An experimental MABR system was designed and set up for the treatment of post-ozonation wastewater. As shown in Fig. 1(b), the membrane module (Hydroking Sci.&Tech., Ltd, Tianjin, China) was the core component of the system, which was mainly comprised of 200 hollow fiber membranes with the following characteristics: dense, PVDF, 1.6 m length, 150 μm wall thickness, and 400 μm outer diameter. The module was installed and submerged in a rectangular and well-designed Plexi glass container (33 cm long, 12 cm wide, and 22 cm high), and these fibers were entwined through the rectangular channel. In addition, the air was pumped into the membrane by an air compressor. The cross-flow velocity across the biofilm on membrane was controlled and regulated through a circulation pump, which was roughly calculated by dividing inlet water flux by the intra cross section area of the rectangular container. The aeration pressure was adjusted through the gas valves and pressure gauges, and the HRT was controlled through the adjustment of the inlet flow rate. The continuous experiment was divided into three stages, as follows: biofilm formation, replacement acclimation, and stable operation.
2.4 Post-treatment: coagulation/flocculation
To improve the final effluent water quality, coagulation/flocculation process for advanced treatment was carried out (Fig. 1(c)). The applied coagulant and polymer flocculant were polyaluminium chloride (PAC) and polyacrylamide (PAM), respectively. Additionally, magnetic powder was used to strengthen the effect of coagulation–flocculation process by strengthening the floc density. The improved coagulation–flocculation experiment was carried out in 3 × 1 L transparent beaker filled with 500 mL of effluent from MABR. The adding sequence and operating conditions were as follows: PAC (0–2 g L−1) of rapid mixing for 20 s at 240 rpm, magnetic powder (8–10 g L−1) for 5 s at 350 rpm, and PAM (2 mg L−1) for 5 s at 100 rpm. After sedimentation, COD concentration, soluble solids (SS), and chromaticity of the supernatant were determined without any filtration.
2.5 Analytical methods
The concentrations of COD, NH4+-N, NO3−-N, NO2−-N and total nitrogen (TN) were measured according to spectrophotometry methods using Multi-parameter Bench Photometer for laboratories (HACH, USA). Chromaticity and SS were determined in accordance with standard methods.30 BOD5 concentration was tested using BODTrak™ (HACH, USA). Dissolved oxygen (DO) and pH were monitored by the HQd series laboratory meters (HACH, USA). The growth and thickness of the biofilm were observed by biological microscopy (OPTEC, China) and visual inspection, respectively. Each measurement was performed in triplicate.
3. Results and discussion
3.1 Ozonation treatment
The influence of ozone production rate and reaction time on B/C ratio and COD value of effluent were evaluated to determine the optimal conditions for promoting the degradation of pharmaceutical intermediates wastewater in MABR.
COD concentration variation of effluent under different ozone production rates during 30 min is shown in Fig. 2(a). When ozone production rate was controlled at 2 g h−1, COD concentration decreased slowly from around 2080 mg L−1 to 1533 mg L−1 with 26% removal efficiency. Ozone production rate was at 4 g h−1. COD concentration substantially decreased to approximately 1260 mg L−1, achieving 40% reduction. When ozone production rate was further increased to 6 g h−1 at the first 5 min, COD concentration declined dramatically to 1408 mg L−1. Between 5 and 15 min, COD concentration showed a sudden increase to 1600 mg L−1. Afterwards, COD concentration gradually decreased to 985 mg L−1 with 53% removal efficiency. Similarly, as ozone production rate reached 8 g L−1, COD concentration slightly increased to 2175 mg L−1 in the first 5 min. Subsequently, COD concentration decreased substantially and finally reached 878 mg L−1 with 58% removal efficiency. The initial increase in COD concentration might be due to the increase in biodegradable and small compounds from the decomposition of organic macromolecule compounds under higher ozone production rate.31,32 Meanwhile, further increasing ozone density generally decreased the COD concentration over the 30 min reaction time.33
 |
| | Fig. 2 (a) Variations of COD concentration at different ozonation production rates and reaction times; (b) variations of BOD5/COD ratio at different ozonation production and reaction times. | |
B/C ratio of effluent treated by ozonation is an important factor in the evaluation of ozonation efficiency. As shown in Fig. 2(b), when ozone production rate was adjusted to 2, 4, and 6 g h−1, B/C ratio showed a steady increase from 0.22 to 0.30, 0.33, and 0.46, respectively. A significant increase in the effluent biodegradability occurred with high ozone dose.32
However, when ozone dose was at 8 g h−1, the profile was divided into two parts. B/C ratio increased rapidly to 0.42 in the first 15 min. Afterwards, B/C ratio decreased sharply to 0.23. The O3 molecule could make a complex organic matter mineralize into small molecules, thereby increasing the B/C ratio and biodegradability of the wastewater. Nevertheless, compounds relatively susceptible to ozonation could be completely degraded under high ozone production rate and long reaction time conditions, thereby causing the deterioration of biodegradability. In brief, the optimum conditions were as follows: ozone production rate at 6 g h−1 and reaction time for 30 min with a final COD reduction of 53% and B/C of 0.46.
3.2 MABR process
3.2.1 Biofilm formation. Initially, MABR system was inoculated with activated sludge with a wide variety of microorganisms collected from an MBR device in Tianjin University (Tianjin, China). During biofilm formation stage, the reactor was operated at the aeration pressure of 0.2 MPa and was aided with an aeration equipment. This equipment was used to mix sludge with water completely and to prevent sludge settling. Meanwhile, a certain amount of substrates, such as glucose, ammonia chloride, and potassium dihydrogen phosphate (with about 5% of pharmaceutical intermediates effluent following ozonation) were added into the MABR system. After a week of seeding, microorganism successfully adhered to the walls of the hollow-fiber membrane and began to grow. Metazoans like rotifera were observed by using a biological microscope, thereby indicating that the biofilm developed preliminarily.
3.2.2 Replacement and acclimation. Subsequently, effluent was added to MABR system following ozonation. Addition of effluent was conducted in a gradually increasing proportion (step by step) for 20 d. The reactor was operated in batch operation, with HRT and aeration pressure maintained at 24 h and 0.2 MPa, respectively. As the amount of wastewater increased little by little, effluent COD, NH4+-N, and TN concentrations gradually increased (Fig. 3(a–c)). When influent COD, NH4+-N, and TN concentrations in MABR increased to about 980, 23, and 60 mg L−1, respectively (complete wastewater after ozonation), the concentrations of the effluents declined to 188, 9.6, and 27.6 mg L−1, respectively. To improve environmental adaptability of microbial community in MABR, biofilm acclimation was carried out for another 6 d under identical influent conditions. Finally, the effluent quality from MABR remained stable, and nearly 90% COD and 60% TN removal were obtained. These results indicated that the biofilm was able to simultaneously remove carbon and nitrogen, and the nitrifiers and denitrifiers in biofilm showed effective enrichment and steadily adapted to the ozonated wastewater.
 |
| | Fig. 3 (a) COD concentrations and removal efficiency of influent and effluent at the replacement and acclimation stage; (b) NH4+-N concentrations of influent and effluent at the replacement and acclimation stage; (c) TN concentrations and removal efficiency of influent and effluent at the replacement and acclimation stage. | |
3.2.3 Optimization of MABR system. The influence of crucial operating parameters (i.e., HRT, aeration pressure, flow velocity) on COD, NH4+-N, and TN removal efficiencies was investigated thoroughly to maximize the use of MABR.
The effect of HRT on C and N removals. The continuous experiments were carried out at HRT of 20, 24, and 28 h, aeration pressure of 0.2 MPa and flow velocity of 0.04 m s−1 for 5 d, respectively. As shown in Fig. 4(a–c), when HRT was increased from 20 h to 24 h, COD, NH4+-N, and TN values of effluent from MABR decreased rapidly from 90, 5, and 28 mg L−1 to 70, 0.5, and 15 mg L−1, respectively. As HRT was further increased to 28 h, COD and NH4+-N concentrations declined to around 65 and 0.1 mg L−1, and these values were slightly lower than the ones under 24 h. Conversely, TN value at 28 h increased to around 20 mg L−1, which was probably attributed to the higher dissolved oxygen (DO > 2 mg L−1) and inhibited denitrification with the accumulation of NO3−-N.34,35 Thus, the HRT of 24 h was efficient for treating pharmaceutical intermediate wastewater in the MABR system.
 |
| | Fig. 4 (a) COD concentrations of effluent at different HRTs; (b) NH4+-N concentrations of effluent at different HRTs; (c) TN concentrations of effluent at different HRTs. | |
The effect of aeration pressure on C and N removals. By varying aeration pressures at 0.1, 0.15, and 0.2 MPa with identical HRT (24 h), MABR experiments were applied in the treatment of pharmaceutical wastewater. COD and NH4+-N concentrations of effluent decreased with increasing aeration pressure, and reached the lowest value of around 75 and 0.4 mg L−1, respectively, when aeration pressure was at 0.2 MPa, as shown in Fig. 5(a–c). The lowest effluent TN value occurred at 0.15 MPa. Previous studies reported that aeration pressure played a critical role in forming microbial stratification (nitrifying and denitrifying bacteria), and further N removal could be controlled by aeration pressure.36,37 The nitrification rate could be favored under higher air supply pressure, but the denitrification process might be limited to a certain degree. In the present MABR system, the process of simultaneous nitrification and denitrification could be achieved effectively at an aeration pressure of 0.15 MPa.
 |
| | Fig. 5 (a) COD concentrations of effluent at different aeration pressures (b) NH4+-N concentrations of effluent at different aeration pressures; (c) TN concentrations of effluent at different aeration pressures. | |
The effect of flow velocity on C and N removals. The influence of flow velocity on COD, NH4+-N, and TN removals was studied by varying the flow velocity at 0, 0.04, and 0.08 m s−1. As indicated in Fig. 6(a–c), the MABR system became more capable of degrading and removing COD, NH4+-N, and TN with increasing flow velocity. Moreover, effluent quality worsened without flow velocity. The facts showed the crucial role of flow rate in carbon and nitrogen removals in this MABR system. Higher flow velocity could contribute to the aggregations and biosorption of COD, NH4+-N, and organic nitrogen on the biofilm surface.38 Consequently, contaminants were more able to diffuse from the outer to the inner of biofilm for further degradation.39 Additionally, excess biomass could be effectively washed out, and a thick biofilm that functions in the reduction of the mass transfer resistance under high fluid shearing forces was hardly produced.40 In the current study, a flow velocity of 0.08 m s−1 was appropriate for promoting mass transfer. The effluent quality was stable with a COD, NH4+-N, and TN concentrations of 68, 0.12, and 6 mg L−1, respectively.
 |
| | Fig. 6 (a) COD concentrations of effluent at different flow velocities; (b) NH4+-N concentrations of effluent at different flow velocities; (c) TN concentrations of effluent at different flow velocities. | |
Degradation behavior of C and N in MABR system. To study the degradation behavior of C and N in MABR system, the concentrations of COD, NH4+-N, NO3−-N, TN, and DO were measured with the interval time of 2 h in batch experiments. The HRT, flow velocity, and aeration pressure were controlled at 24 h, 0.08 m s−1 and 0.15 MPa, respectively.In Fig. 7(a–d), COD and TN degradation and reduction were faster than those of NH4+-N in the first 12 h. This phenomenon was attributed to several reasons, as follows. First, the initial higher COD concentration favored the heterotrophic bacteria activity and consumed more oxygen (DO < 0.5 mg L−1). Then, the nitrifying process was inhibited to some degree.37,41 Second, the transformation of organic nitrogen to NH4+-N contributed to the initially slow decline of NH4+-N. Afterwards, COD value became constant at a concentration of around 64 mg L−1 with a removal rate of 94%. However, NH4+-N concentration declined rapidly, thereby indicating that ammonia-oxidizing activity in biofilm was strengthened gradually with the decrease of COD and the increase of DO concentration. Meanwhile, TN concentration continued to decrease, but the NO3−-N concentration increased sharply. This result suggested that denitrifying performance of biofilm in the later stage was slightly inhibited due to the lack of available carbon source. In the end, the effluent was characterized with the COD, NH4+-N, and TN removal rates of 94%, 98%, and 90%, respectively. This MABR system could provide simultaneous C and N removal for the treatment of pharmaceutical intermediates wastewater following ozonation.42,43
 |
| | Fig. 7 (a) COD concentrations and removal efficiency of effluent at different times; (b) NH4+-N concentrations and NO3−-N concentrations of effluent at different times; (c) TN concentrations and removal efficiency of effluent at different times; (d) DO concentration of effluent at different times. | |
3.3 Improved coagulation–flocculation treatment
Although the ozone and MABR could remove most of the hazardous compounds, some recalcitrant intermediates remained without mineralization or degradation. Additionally, waste contaminants in suspended or colloidal form44 were hardly removed by the abovementioned processes. To improve water quality for industrial reuse, according to GB/T 19923-2005 (the reuse of urban recycling water–water quality standard for industrial use, China), an improved coagulation–flocculation process was used to further enhance the removal rates of color, SS, and COD from the effluent of MABR. As an environmentally friendly coagulant, PAC became increasingly popular in the coagulation–flocculation process for the treatment of various wastewater, e.g., dyeing wastewater,45 algae-laden water,46 and oily wastewater.47
In this section, multi-group experiments of varying PAC doses with a constant PAM dose of 2 mg L−1 was carried out to determine the optimal condition. As shown in Fig. 8(a and b), COD concentration declined from 70 mg L−1 to 45 mg L−1 when PAC dose gradually increased from 0 g L−1 to 1.2 g L−1. Meanwhile, SS declined from 54 mg L−1 to 0 mg L−1, and chromaticity declined from 128 to 8. As PAC dose continued to increase to 1.6 g L−1, COD concentration and SS remained unchanged (at below 50 mg L−1 and 0 mg L−1, respectively). Thus, PAC dose increasing resulted in increased strength of the coagulation process, thereby reducing the concentrations of COD, SS, and color compounds. Unfortunately, chromaticity increased from 8 to 64 at 2.0 g L−1 PAC, which was probably due to the excessive amount of PAC. Consequently, surface charge of the coagulated color particles/flocs was reversed, and particle re-stabilization occurred.48,49 Thus, PAC dose of 1.2 g L−1 was definitely necessary for COD, chromaticity, and SS removals.
 |
| | Fig. 8 (a) COD and SS concentrations of effluent at different PAC doses; (b) chromaticity of effluent at different PAC doses. | |
4. Conclusions
The treatments of pharmaceutical intermediate wastewater were evaluated by applying MABR system combined with ozonation and coagulation–flocculation process. The pre-ozonation (6 g h−1 dose; 30 min of reaction time) resulted in the rapid decrease of COD concentration from 2080 mg L−1 to 984 mg L−1, and the rapid increase of B/C ratio from 0.22 to 0.46. The effluent following ozonation was susceptible to degradation through the subsequent MABR process. The effluent from MABR remained stable with COD, NH4+-N, and TN concentrations below 70 mg L−1, 1 mg L−1 and 6 mg L−1, respectively, under optimum conditions, as follows: HRT of 24 h, aeration pressure of 0.15 MPa, and flow velocity of 0.08 m s−1. Thus, the optimum conditions resulted in simultaneous carbon and nitrogen removals in MABR. Finally, the water from MABR was subjected to advanced treatment through coagulation–flocculation process using PAC (1.2 g L−1) combined with PAM (2 mg L−1) and magnetic powder (8–10 g L−1). The ultimate effluent quality was as follows: 45 mg L−1 COD (removal rate, 97.7–98.0%), 0.12 mg L−1 NH4+-N (removal rate, 98.8–99.2%), 6 mg L−1 TN (removal rate, 90.1–90.7%), 0 mg L−1 SS (removal rate, 100%), and 8 chromaticity (removal rate, 93.8%). Thus, the results met the standard for industrial use in China, according to GB/T 19923-2005. Future research will aim at conducting a pilot-scale test to study feasibility of this technology for industrial production.
Acknowledgements
This work was supported by the National Natural Science Foundation Item of China (No. 51478304) and the Tianjin Scientific and Technological Planning Project, China (No. 13ZCZDSF00500).
References
- J. A. Melero, F. Martinez, J. A. Botas, R. Molina and M. I. Pariente, Water Res., 2009, 43, 4010–4018 CrossRef CAS PubMed.
- G. T. Ankley, B. W. Brooks, D. B. Huggett and J. P. Sumpter, Environ. Sci. Technol., 2007, 41, 8211–8217 CrossRef CAS.
- D. Sreekanth, D. Sivaramakrishna, V. Himabindu and Y. Anjaneyulu, Bioresour. Technol., 2009, 100, 2534–2539 CrossRef CAS PubMed.
- C. Miege, J. M. Choubert, L. Ribeiro, M. Eusebe and M. Coquery, Water Sci. Technol., 2008, 57, 49–56 CrossRef CAS PubMed.
- C. Miege, J. M. Choubert, L. Ribeiro, M. Eusebe and M. Coquery, Environ. Pollut., 2009, 157, 1721–1726 CrossRef CAS PubMed.
- O. V. Enick and M. M. Moore, Environ. Impact Assess. Rev., 2007, 27, 707–729 CrossRef PubMed.
- X. Wei, B. Li, S. Zhao, L. Wang, H. Zhang, C. Li and S. Wang, Bioresour. Technol., 2012, 122, 189–195 CrossRef CAS PubMed.
- Y. Yang, P. Wang, S. Shi and Y. Liu, J. Hazard. Mater., 2009, 168, 238–245 CrossRef CAS PubMed.
- N. Kulik, M. Trapido, A. Goi, Y. Veressinina and R. Munter, Chemosphere, 2008, 70, 1525–1531 CrossRef CAS PubMed.
- D. S. S. Raj and Y. Anjaneyulu, Process Biochem., 2005, 40, 165–175 CrossRef PubMed.
- M. Clara, B. Strenn, O. Gans, E. Martinez, N. Kreuzinger and H. Kroiss, Water Res., 2005, 39, 4797–4807 CrossRef CAS PubMed.
- O. A. H. Jones, N. Voulvoulis and J. N. Lester, Environ. Pollut., 2007, 145, 738–744 CrossRef CAS PubMed.
- R. R. Giri, H. Ozaki, S. Taniguchi and R. Takanami, Int. J. Environ. Sci. Technol., 2008, 5, 17–26 CrossRef CAS.
- R. R. Giri, H. Ozaki, S. Ota, R. Takanami and S. Taniguchi, Int. J. Environ. Sci. Technol., 2010, 7, 251–260 CrossRef CAS.
- M. Gonzalez-Brambila, O. Monroy and F. Lopez-Isunza, Chem. Eng. Sci., 2006, 61, 5268–5281 CrossRef CAS PubMed.
- X. Wei, B. Li, S. Zhao, C. Qiang, H. Zhang and S. Wang, J. Membr. Sci., 2012, 389, 257–264 CrossRef CAS PubMed.
- T. Li, J. Liu, R. Bai and F. S. Wong, Environ. Sci. Technol., 2008, 42, 2099–2104 CrossRef CAS.
- H. L. Tian, J. Y. Zhao, H. Y. Zhang, C. Q. Chi, B. A. Li and X. L. Wu, Appl. Microbiol. Biotechnol., 2015, 99, 3279–3290 CrossRef CAS PubMed.
- E. Casey, B. Glennon and G. Hamer, Resour., Conserv. Recycl., 1999, 27, 203–215 CrossRef.
- K. Hibiya, A. Terada and S. Tsuneda, J. Biotechnol., 2003, 100, 23–32 CrossRef CAS.
- F. F. Hou, B. A. Li, M. H. Xing, Q. Wang, L. Hu and S. C. Wang, Bioresour. Technol., 2013, 140, 1–9 CrossRef CAS PubMed.
- N. Landes, A. Morse and W. A. Jackson, Environ. Eng. Sci., 2013, 30, 606–616 CrossRef CAS.
- G. Li, J. He, D. Wang, P. Meng and M. Zeng, Environ. Technol., 2015, 36, 1026–1034 CrossRef CAS PubMed.
- A. Rubio-Clemente, E. Chica and G. A. Penuela, Water, Air, Soil Pollut., 2015, 226, 1–18 CrossRef CAS.
- Y. Wei, A. Ding, L. Dong, Y. Tang, F. Yu and X. Dong, Colloids and Surfaces, A: Physicochemical and Engineering Aspects, 2015, 470, 137–141 CrossRef CAS PubMed.
- C. Amor, E. De Torres-Socias, J. A. Peres, M. I. Maldonado, I. Oller, S. Malato and M. S. Lucas, J. Hazard. Mater., 2015, 286, 261–268 CrossRef CAS PubMed.
- S. Verma, B. Prasad and I. M. Mishra, Sep. Sci. Technol., 2014, 49, 1067–1075 CrossRef CAS PubMed.
- K. Wang, S. Liu, Q. Zhang and Y. He, Environ. Technol., 2009, 30, 1469–1474 CrossRef CAS PubMed.
- X. Wei, B. A. Li, S. Zhao, L. Wang, H. Y. Zhang, C. Li and S. C. Wang, Bioresour. Technol., 2012, 122, 189–195 CrossRef CAS PubMed.
- APHA, AWWA and WEF, American Public Health Association, American Water Works Association, Water Environment Federation, WA, Washington, DC, 1998 Search PubMed.
- Y. Lester, H. Mamane, I. Zucker and D. Avisar, Water Res., 2013, 47, 4349–4356 CrossRef CAS PubMed.
- I. A. Alaton, S. Dogruel, E. Baykal and G. Gerone, J. Environ. Manage., 2004, 73, 155–163 CrossRef PubMed.
- I. Zucker, Y. Lester, D. Avisar, U. Huebner, M. Jekel, Y. Weinberger and H. Mamane, Environ. Sci. Technol., 2015, 49, 301–308 CrossRef CAS PubMed.
- J. Oh and J. Silverstein, Water Res., 1999, 33, 1925–1937 CrossRef CAS.
- X. Yang, S. Wang and L. Zhou, Bioresour. Technol., 2012, 104, 65–72 CrossRef CAS PubMed.
- L. S. Downing and R. Nerenberg, Biotechnol. Bioeng., 2008, 101, 1193–1204 CrossRef CAS PubMed.
- J. H. Hwang, N. Cicek and J. Oleszkiewicz, Water Res., 2009, 43, 3301–3307 CrossRef CAS PubMed.
- X. Wei, B. A. Li, S. Zhao, C. Qiang, H. Zhang and S. Wang, J. Membr. Sci., 2012, 389, 257–264 CrossRef CAS PubMed.
- E. Casey, B. Glennon and G. Hamer, Biotechnol. Bioeng., 2000, 67, 476–486 CrossRef CAS.
- D. Celmer, J. A. Oleszkiewicz and N. Cicek, Water Res., 2008, 42, 3057–3065 CrossRef CAS PubMed.
- L. S. Downing and R. Nerenberg, Appl. Microbiol. Biotechnol., 2008, 81, 153–162 CrossRef CAS PubMed.
- M. J. Semmens, K. Dahm, J. Shanahan and A. Christianson, Water Res., 2003, 37, 4343–4350 CrossRef CAS.
- A. Terada, T. Yamamoto, R. Igarashi, S. Tsuneda and A. Hirata, Biochem. Eng. J., 2006, 28, 123–130 CrossRef CAS PubMed.
- P. T. Zayas, G. Geissler and F. Hernandez, J. Environ. Sci., 2007, 19, 300–305 CrossRef CAS.
- Y. S. Perng and M. H. Bui, J. Serb. Chem. Soc., 2015, 80, 115–125 CrossRef CAS.
- H.-S. Ou, C.-H. Wei, Y. Deng and N.-Y. Gao, Water Sci. Technol.: Water
Supply, 2014, 14, 493–503 CAS.
- S. M. Hoseini, M. M. Salarirad and M. R. A. Moghaddam, Desalin. Water Treat., 2015, 53, 300–308 CrossRef CAS PubMed.
- C.-Z. Liang, S.-P. Sun, F.-Y. Li, Y.-K. Ong and T.-S. Chung, J. Membr. Sci., 2014, 469, 306–315 CrossRef CAS PubMed.
- C. Wen Po, C. Fung Hwa, L. Chun Chang and Y. Ruey Fang, Colloids and Surfaces, A: Physicochemical and Engineering Aspects, 2008, 312, 238–244 CrossRef PubMed.
|
| This journal is © The Royal Society of Chemistry 2015 |
Click here to see how this site uses Cookies. View our privacy policy here.