DOI:
10.1039/C5RA10021F
(Paper)
RSC Adv., 2015,
5, 82952-82959
Promoted performance of a MnOx/PG catalyst for low-temperature SCR against SO2 poisoning by addition of cerium oxide
Received
27th May 2015
, Accepted 24th September 2015
First published on 24th September 2015
Abstract
Manganese oxide supported palygorskite (MnOx/PG) catalysts are considered highly efficient for lower-temperature selective catalytic reduction (SCR) of flue gas NO by ammonia. However, during the SCR reaction, the surface of the MnOx/PG catalyst tends to get poisoned by SO2. In this study, we have doped the MnOx/PG catalyst with cerium oxide to improve their resistance against SO2 poisoning. The SCR activity of the CeO2-doped catalyst (Mn–Ce/PG) is found to be remarkably higher than that of the undoped MnOx/PG catalyst in the temperature range of 100–200 °C in the presence of 400 ppm SO2. Of all the different samples with different concentrations of Ce doping, the catalyst Mn8Ce5/PG exhibits the highest SCR activity in the presence of SO2-containing gases. Systematic analyses of the sample performed by using XRD, XPS, SEM-EDS, temperature programmed desorption (TPD) and TGA suggest that the cerium oxide doping can obviously inhibit the SO2-poisoning of the active species manganese oxides, which is widely believed to be one of the major reasons for the deactivation of manganese-based catalysts. However, the deposition of ammonium sulfates on the surface of catalysts, which is yet another important cause of SO2 poisoning, can hardly be avoided via the addition of cerium oxide. On the basis of systematic studies, it can be assumed that the addition of cerium oxide can enhance the stability of the active species via the reduction of manganese sulfate rather than ammonium sulfates, thereby improving its resistance toward SO2 poisoning.
1. Introduction
NOx gas emitted from stationary and mobile combustion sources leads to a variety of undesirable and environmentally harmful effects. Selective catalytic reduction (SCR) has been proven to be the most effective technology for the abatement of nitrogen oxides from industrial flue gases.1 Commercially, V2O5–WO3/TiO2 catalysts are being widely used for medium–high-temperature SCR. Moreover, manganese-based catalysts that are often prepared by supporting manganese oxides on different carriers such as MnOx/TiO2,2,3 MnOx/Al2O3 (ref. 4) and MnOx/ZSM-5 (ref. 5) have been reported to be potential candidates for low-temperature SCR of NO with NH3. In our previous study,6 we demonstrated the use of the clay mineral, palygorskite (PG), as a support for the preparation of a novel MnOx/PG catalyst. The catalyst thus obtained is found to be very active for SCR at low temperatures.
However, these manganese-based catalysts are sensitive to the residual SO2 in the flue gas and tent to get deactivated dramatically at low temperatures. Recently, ceria (CeO2) has received considerable attention for the SCR of NO, primarily owing to its exceptional oxidation and reduction abilities. Some studies have analyzed the functionalities of CeO2 mixed with MnOx catalyst to form mixed oxides catalysts such as MnOx–CeOx/CNTs,7,8 Mn–Ce/TiO2,9 and MnOx–CeOx.10 The addition of CeO2 to the Mn-based catalysts enhances the catalytic activity as well as improves the sulfur resistance to some extent. Nevertheless, the addition of CeO2 to the Mn-based catalysts does not completely solve the issues related to deactivation, especially at low temperatures. Therefore, it is highly imperative to explore the reason underlying the deactivation phenomenon occurring in low-temperature SCR catalysts to effectively circumvent the deactivation issue of catalyst during SCR of SO2-containing gases. To this end, some authors have suggested that the formation and accumulation of excess ammonium sulfate is the key reason underlying SO2 poisoning during low-temperature NH3-SCR reaction.11–13 Moreover, all these studies have unanimously concluded that the gas-phase SO2 combines with NH3 to form ammonium sulfates. Similarly, another study suggests that the manganese oxides catalyst is consumed by SO2, thereby reducing the stability of the active species. Wu et al.14 had reported that the doping of Ce on Mn/TiO2 catalyst could prevent the catalyst from being sulfated and inhibit the formation of ammonium sulfate on the surface of the catalyst. However, the exact mechanism underlying the phenomenon of SO2-resistance observed in Ce-doped catalysts is still unclear. Thus, in this study we have elucidated the role of ceria doping on the Mn–Ce/PG catalysts for the NH3-SCR reaction. Based on the results, we have proposed the plausible mechanism underlying the phenomenon of SO2-resistance exhibited by the Ce-doped Mn8Cex/PG catalysts.
2. Experimental
2.1 Catalyst preparation
The catalysts were prepared by the wetness co-impregnation method loading of active species and additive species.15 Palygorskite as support was pore volume impregnated by mixed aqueous solution of manganese nitrate and cerium nitrate as precursors. The mass ratios of manganese and cerium to palygorskite were 8 wt% and 1–5 wt%, respectively. The catalysts were dried initially at 50 °C for 6 h, followed by drying at 110 °C for 12 h. The dried catalysts were ground and sieved to 20–40 mesh, and subsequently calcined in air at 300 °C for 3 h. Catalysts thus obtained were designated as Mn8/PG and Mn8Cex/PG (x = 1–5), wherein “8” and “x” refer to the mass percentage of each element.
2.2 Determination of catalytic activity
SCR activity tests were performed in a quartz fixed-bed continuous flow reactor at a temperature of 100–300 °C. Typically, 2 g of the catalyst was used in the SCR tests. The flow rates of all the different reactant gases including NO–Ar, NH3–Ar, SO2–Ar and pure O2 were controlled via respective mass flow meters. The reactant gas comprised 600 ppm NO, 600 ppm NH3, 400 ppm or 600 ppm SO2 (when used), 3 vol% O2 and Ar as balance. The concentrations of NO and SO2 in the inlet and outlet streams of the reactor were on-line monitored by a NO analyzer (Testo 350XL) and a SO2 (Testo 300) analyzer, respectively. The conversion of NO and oxidation of SO2 were calculated using the formulae (1)–(3)| |
 | (1) |
| |
 | (2) |
| |
 | (3) |
2.3 Catalyst characterization
The microstructure and elementary composition of the catalyst after SCR reaction in SO2-containing gas were analyzed by using scanning electron microscope (SEM) equipped with an energy dispersive X-ray spectrometer (EDS). The surface atomic state of the catalyst was determined by using X-ray photoelectron spectroscopy (XPS, ESCALAB250 spectrometer) using Al Kα radiation. Moreover, the Mn 2p XPS spectrum was recorded from the SO2-poisoned catalyst. Besides, X-ray diffraction (XRD) was performed on a D/MAx2500V diffractometer (Rigaku, Japan) equipped with a monochromated Cu Kα radiation source. The catalysts were scanned at 2θ ranging from 10–70°.
Furthermore, temperature programmed desorption (TPD) experiments were performed on 1 g of the SO2-poisoned catalyst. In the typical process, the samples were initially reacted with 400 ppm of SO2-containing gases at the reaction temperature for 2 h. Subsequently, the TPD experiments were performed by raising the temperature from 60 to 800 °C at a heating rate of 5 °C min−1 in Ar (350 mL min−1) atmosphere.
Moreover, thermogravimetric analysis (TGA, DTG-60H) of the samples was performed in a static oxygen atmosphere in the temperature range from 20 to 800 °C at a heating rate of 10 °C min−1. Approximately 5–9 mg of the sample was used for the TGA.
3. Results and discussion
3.1 Catalytic activity
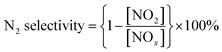
Fig. 1 shows the NO conversion of the different Mn8Cex/PG catalysts in the studied temperature range. Among all samples, the catalyst (Mn8/PG) without Ce-doped exhibits the lowest catalytic activity in the temperature range of 200–250 °C in the presence of 400 ppm SO2. After a certain amount of cerium oxide doped, the NO conversion is obviously enhanced especially at temperatures higher than 200 °C, in spite of that the increase in catalytic activity is not absolutely synchronized with the increase in Ce content. In case of less than 5 wt% Ce added, there is no a regular trend on the performance of catalysts upon Ce doping at temperatures lower than 200 °C. It implies that there may be a competition between the increase deposition of ammonium sulfates and the decrease formation of manganese sulfates caused by the doping of Ce. However, all the Ce-doped catalysts demonstrate higher catalytic activities in the temperature range of 200–300 °C, suggesting that the deposition of ammonium sulfates becomes less important due to thermal decomposition. Notably, the best performance of SCR was obtained on Mn8Ce5/PG catalyst in the whole temperature range with the NO conversion of 85% and 95% at 200 °C and 250 °C, respectively. For further study the influence of cerium doping on the catalysts, Mn8Ce5/PG catalyst was also evaluated for N2 selectivity. The selectivity of manganese based catalysts was widely considered as an important index for SCR. In this work, for Mn8Ce5/PG, the N2 selectivity was observed to be about 96% as calculated from the results shown in Fig. 1b. In the outlet flow stream, less than 20 ppm of NO2 is detected besides NO. These results indicate that the Ce-doped catalysts exhibit efficient resistance toward SO2-poisoning in the medium–high-temperature range with a high N2 selectivity, which is in agreement with the founding by other researchers.16,17
 |
| | Fig. 1 (a) The SCR activity of different Mn8Cex/PG catalysts in the presence of SO2. (b) Concentrations of NO and NO2 for Mn8Ce5/PG. Reaction conditions: [NH3] = [NO] = 600 ppm, [SO2] = 400 ppm, [O2] = 3 vol%, Ar balance, GHSV = 5000 h−1, total flow rate 350 mL min−1. | |
3.2 SO2 oxidation activity
As mentioned earlier, the manganese-based catalysts are prone to poison by SO2 during the SCR of NO. Therefore, researchers have long sought a suitable material that can act as a bridge and remove SO2 to avoid the depositions of ammonium and manganese sulfates (SO2-poisoning). Previous studies have demonstrated that the cerium oxide doping of Mn/TiO2 catalyst can prevented the oxidation of SO2 to SO3, which in turn would be beneficial for improving their catalytic activity in the presence of SO2-containing gases.14,18
Therefore, in this study, we investigate the effect of Ce addition on the SO2 oxidation on the surface of catalyst. Thus, we compare the changes in SO2 concentration with reaction time on the surface of the undoped (Mn8/PG) catalysts both in the absence and presence of oxygen (Fig. 2). For Mn/PG catalyst, the SO2 oxidation depends on the original lattice oxygen companied with manganese specie, which cannot be recovered by gaseous O2 after the formation of MnSO4. In other words, the presence of gaseous O2 does not change the degree of SO2 oxidation for Mn/PG catalyst due to the steady formation of MnSO4. Intriguingly, the outlet SO2 concentration of Mn8Ce5/PG is slightly lower than that of Mn8/PG in the absence of oxygen. Peralta19 reported that the SO2 gas molecules would tend to adsorb first onto Ce due to the presence of vacancies in Ce. In the case of Mn8Ce5/PG, the outlet concentration of SO2 is virtually zero during the first 30 min, which is far lower than that of the Mn8/PG catalyst in the presence of oxygen. It suggests that unlike previous study, the addition of Ce accelerates the oxidation of SO2 to SO3 in the presence of gaseous O2, which is the main reason for the formation of sulfates.
 |
| | Fig. 2 The SO2 oxidative behavior over Mn8/PG and Mn8Ce5/PG in the absence and presence of O2 at 200 °C. Reaction conditions: [SO2] = 400 ppm, [O2] = 3 vol%, Ar balance, total flow rate 350 mL min−1. | |
3.3 Characterizations of the catalysts
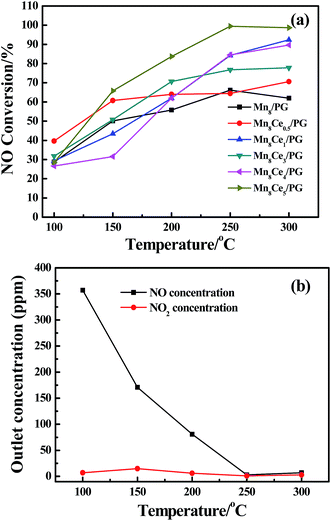
Fig. 3 shows the XRD patterns of Ce-modified catalysts. All the samples calcined at 300 °C were observed to maintain the primary structure of palygorskite. The strong diffraction peak at 8.436° ascribed to palygorskite was found to be too high for distinguishing other weak peaks. Thus, XRD patterns were only shown in the diffraction range of 10° to 70°. The diffraction peaks observed at 37.1°, 42.3° and 56.5° matching MnO2 well [PDF# 30-0820]. However, all these patterns do not show intense peaks of Mn2O3 because that Mn2O3 is more prone to form amorphous state than MnO2.20,21 Obviously, the peaks corresponding to MnO2 weakened with the addition of Ce, indicating that the addition of Ce enhances active component dispersion, which is in accordance with the founding by Wang.22
 |
| | Fig. 3 XRD patterns of catalysts: (a) Mn8/PG; (b) Mn8Ce1/PG; (c) Mn8Ce2/PG; (d) Mn8Ce3/PG; (e) Mn8Ce4/PG; (f) Mn8Ce5/PG. | |
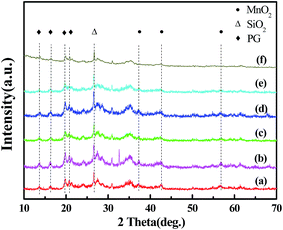
The morphology and elemental composition of the surface of Mn8Ce5/PG catalyst is investigated using SEM and EDS after NH3-SCR reaction in the presence of SO2-containing gases. As illustrated in Fig. 4A, the SEM image of the Mn8Ce5/PG catalyst after NH3-SCR reaction in the presence of 600 ppm of SO2 for 2 h at 150 °C exhibits a clear boundary between the part I and part II regions, while the size of part I is much smaller than that of part II. Fig. 4B presents the magnified image of the selected area in part I in Fig. 4A, which shows a type of granular material. In the actual experiment, there was a kind of white layer on the surface of the SO2-poisoned catalyst.
 |
| | Fig. 4 (A): SEM images for Mn8Ce5/PG catalyst after 600 ppm SO2 poisoning for 2 h at 150 °C; (B) the magnified images of the selected area in the picture A in part I. | |
Table 1 shows the elemental compositions of the noted regions of part I and part II. As can be seen, the mass percentage of S in part I is much lesser than that in part II, whereas the mass percentage of Mn and Ce are higher than that in part II. Moreover, a certain quantity of N is detected in part II with the N/S stoichiometric ratio of 2.53 which is greater than that of (NH4)2SO4, (NH4)2SO3 and NH4HSO4. This suggests that the granular material (white layer) in the part II is mainly composed of ammonium sulfates and there may be other compounds containing the N element existed (Mn-nitrate or adsorbed ammonia) apart from the ammonium sulfates. Thus, it can be deduced that the main reason for the deactivation of Ce-added catalysts at 150 °C is the formation of ammonium sulfates.
Table 1 The surface elemental composition of part I and part II from EDS analysis
| Element |
Mass percentage (%) |
Element |
Mass percentage (%) |
| Part I |
Part II |
Part I |
Part II |
| C |
1.15 |
— |
Ce |
7.92 |
3.22 |
| O |
36.44 |
37.20 |
Mg |
3.70 |
1.47 |
| N |
— |
17.52 |
Al |
2.50 |
— |
| S |
2.65 |
15.80 |
Si |
23.72 |
13.50 |
| Mn |
15.34 |
5.95 |
K |
0.83 |
0.64 |
| Fe |
3.48 |
1.49 |
Ca |
2.07 |
0.31 |
Furthermore, we have analyzed the oxidation state of manganese on the surface of the Mn8/PG and Mn8Ce5/PG catalysts before and after SO2-poisoning at 150 °C as determined using XPS spectroscopy (Fig. 5). The typical Mn 2p XPS spectra for all of the catalysts are almost similar. The broad Mn 2p3/2 peak in the spectra is the characteristic of a mixed-valence manganese system.14 2p3/2 binding energies at 640.3, 641.3 and 642.1 are attributed to the presence of surface Mn2+, Mn3+ and Mn4+ species in the catalysts, respectively.23,24 The estimated surface concentration of Mn and the relative percentage of MnR+ (R = 2, 3, 4) in Mn 2p3/2 are listed in Table 2. On surface of each catalyst, manganese specie exists in various oxidation states such as Mn2+, Mn3+ and Mn4+. The Mn4+ and Mn3+ atomic ratio increased after Ce-added, indicating that the addition of Ce enhances the transition of Mn2+ to Mn3+ and Mn4+, which is accordance with the found by Kwon.25 In case of Ce-added catalysts, the atomic ratio of surface Mn2+ is found to be much less than that of undoped catalysts, especially for SO2-poisoning catalysts. According to the results in Table 2, atomic ratio of surface Mn2+ for SO2-poisoning Mn8Ce5/PG is only 9.4%, while for SO2-poisoning Mn8/PG the percentage is 36.8. It indicates that lesser amount of MnSO4 is deposited onto the surface of Mn8Ce5/PG catalyst during the SCR reaction in the presence of SO2, which could be attributed to the addition of cerium oxide.
 |
| | Fig. 5 XPS spectra of Mn 2p for the catalysts before and after 400 ppm SO2 poisoning for 2 h at 150 °C. (A): Mn8/PG-SCR, (B): SO2-poisoned Mn8/PG, (C): Mn8 Ce5/PG-SCR, (D): SO2-poisoned Mn8Ce5/PG. | |
Table 2 XPS results for surface Mn atom percentage
| Catalyst |
Mn (%) |
Mn2+ (%) |
Mn3+ (%) |
Mn4+ (%) |
| Mn8/PG-SCR |
1.06 |
11.1 |
35.2 |
53.7 |
| Mn8/PG 400 ppm SO2 |
0.89 |
36.8 |
28.1 |
35.1 |
| Mn8Ce5/PG-SCR |
1.38 |
4.4 |
38.5 |
57.1 |
| Mn8Ce5/PG 400 ppm SO2 |
1.35 |
9.4 |
30.0 |
60.6 |
3.4 Thermal analysis
Fig. 6 shows the TG/DTG curves of the Mn8/PG and Mn8Ce5/PG catalysts after NH3-SCR reaction for 2 h in the presence of 400 ppm SO2 at 150 °C. The typical TG curves show five weight losses and the DTG shows the corresponding peaks. The weight loss peak I appearing at around 100 °C can be attributed to the evaporation of surface adsorbed water molecules in the catalysts.26 The second weight loss peak II at around 200 °C is close to the decomposition temperature of ammonium sulfate.27 The broad peak III arising in the temperature range between 350 and 500 °C can be ascribed to the decomposition of NH4HSO4 (350 °C)28,29 and the removal of the residual physisorbed water and hydroxyl groups on the surface of palygorskite.30 Moreover, there are two other smaller peaks in the temperature range of 550–750 °C. The peak IV should be attributed to the morphological change of manganese oxides,31 while the peak V is associated with the decomposition of MnSO4.11,32,33 Most importantly, the MnSO4 decomposition (peak V) is not observed in Fig. 5B, indicating that the addition of Ce inhibits the formation of MnSO4. These results are found to be in good agreement with the XPS results.
 |
| | Fig. 6 TG/DTG curves of samples after SCR reaction in the presence of 400 ppm SO2 at 150 °C. (A) Mn8/PG; (B) Mn8Ce5/PG. | |
3.5 Temperature programmed desorption of SO2
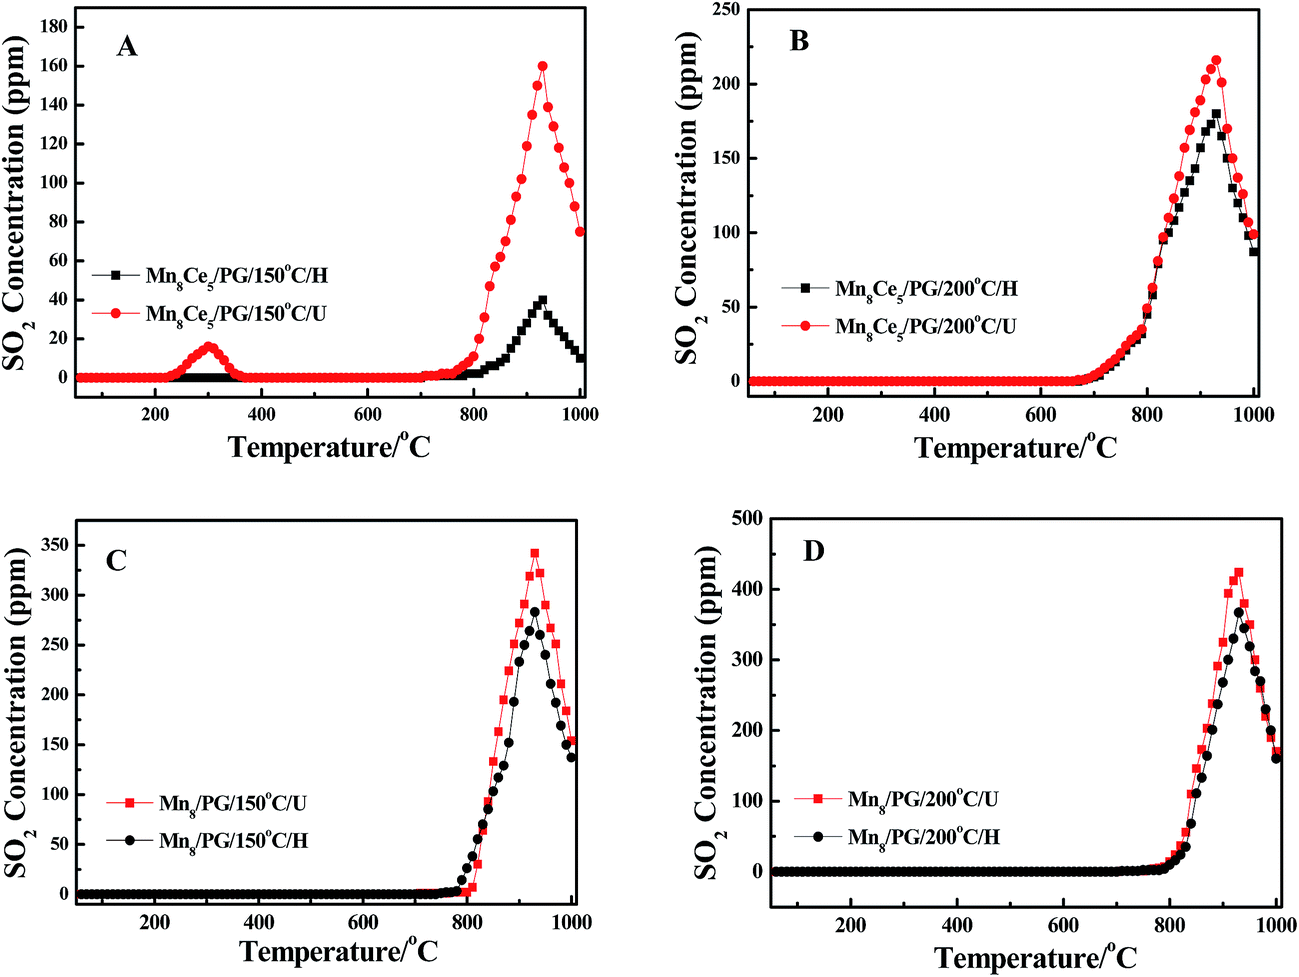
In principle, the amount of desorbed SO2 reflects the degree of poisoning of the catalysts. Therefore, in this study, we have performed the SO2-TPD to investigate the poisoning effect of SO2 on the Mn8/PG and Mn8Ce5/PG catalysts. Prior to the analysis, NH3-SCR reaction was performed for 2 h in the presence of 400 ppm SO2. The corresponding SO2-poisoned catalysts were denoted as Mn8/PG/T/U and Mn8Ce5/PG/T/U series, wherein T indicates the reaction temperature. During the SCR reaction, some white ammonium sulfates were deposited on the surface of catalysts and at the end part of the reactor. Therefore, the catalysts that underwent the SCR reaction were further heated at 300 °C for 2 h in Ar atmosphere and the reactor was washed in distilled water to remove the deposited ammonium sulfates. The corresponding catalysts were denoted as Mn8/PG/T/H and Mn8Ce5/PG/T/H series.
Fig. 7 shows the SO2-TPD profiles of the catalysts. As can be seen, all of the samples present similar SO2-TPD profile and have a strong desorption peak (T = 930 °C) in the temperature range of 750–1000 °C. However, for Mn8Ce5/PG/150 °C/U catalyst, there is an additional small desorption peak at around 300 °C, which can be assigned to the accumulation of ammonium sulfates on the surface of the catalysts, indicating that the addition of Ce increases the deposition of ammonium sulfates (T < 150 °C) by converting SO2 into SO3 upon the injection of SO2 in the selective catalytic reduction (SCR) reaction. Compared with Mn8Ce5/PG/150 °C/U catalyst, the peak at 930 °C for Mn8Ce5/PG/150 °C/H becomes obviously weaker, which suggests the formation of some substance on the surface of the catalyst that almost decomposes at 300 °C. In conjunction with the SEM-EDS and XPS results, this substance is speculated to be ammonium sulfates. Interestingly, there is no change in the concentration of desorbed SO2 after heating the Mn8Ce5/PG/200 °C/U catalyst. In contrast, the strong desorption starting at 800 °C is attributed to the decomposition of manganese sulfate.34 Comparing Fig. 7A and B, it is found that the concentration of SO2 desorbed from the Mn8Ce5/PG/200 °C/H is higher than that from Mn8Ce5/PG/150 °C/H, while that from Mn8Ce5/PG/200 °C/U is lower than that from Mn8Ce5/PG/150 °C/U. This means that on the Mn8Ce5/PG catalyst the ammonium sulfates tend to deposit at lower temperature, while manganese sulfate tends to deposit at higher temperature.
 |
| | Fig. 7 TPD profiles of different catalysts after SCR reaction for 2 h at 150 °C and 200 °C in the presence of 400 ppm SO2. | |
Similarly, comparing Fig. 7A with 7C, it can be observed that the SO2 concentration desorbed from Mn8Ce5/PG is lower than that from Mn8/PG catalyst after heating treatment at 300 °C. Moreover, the SO2-TPD curves of the Mn8/PG catalyst before and after heating at 300 °C are almost similar, which implies that the amount of MnSO4 formed on the surface of Mn8/PG catalyst is relatively higher than that on the Mn8Ce5/PG surface. Similarly, the concentration of SO2 desorbed from Mn8/PG is higher than that from Mn8Ce5/PG at 200 °C. The SO2-TPD results demonstrate that the reaction temperature has a great influence on the desorption of SO2 behavior. Higher reaction temperature favors the formation of MnSO4, while lower reaction temperature enhances the accumulation of ammonium sulfates.
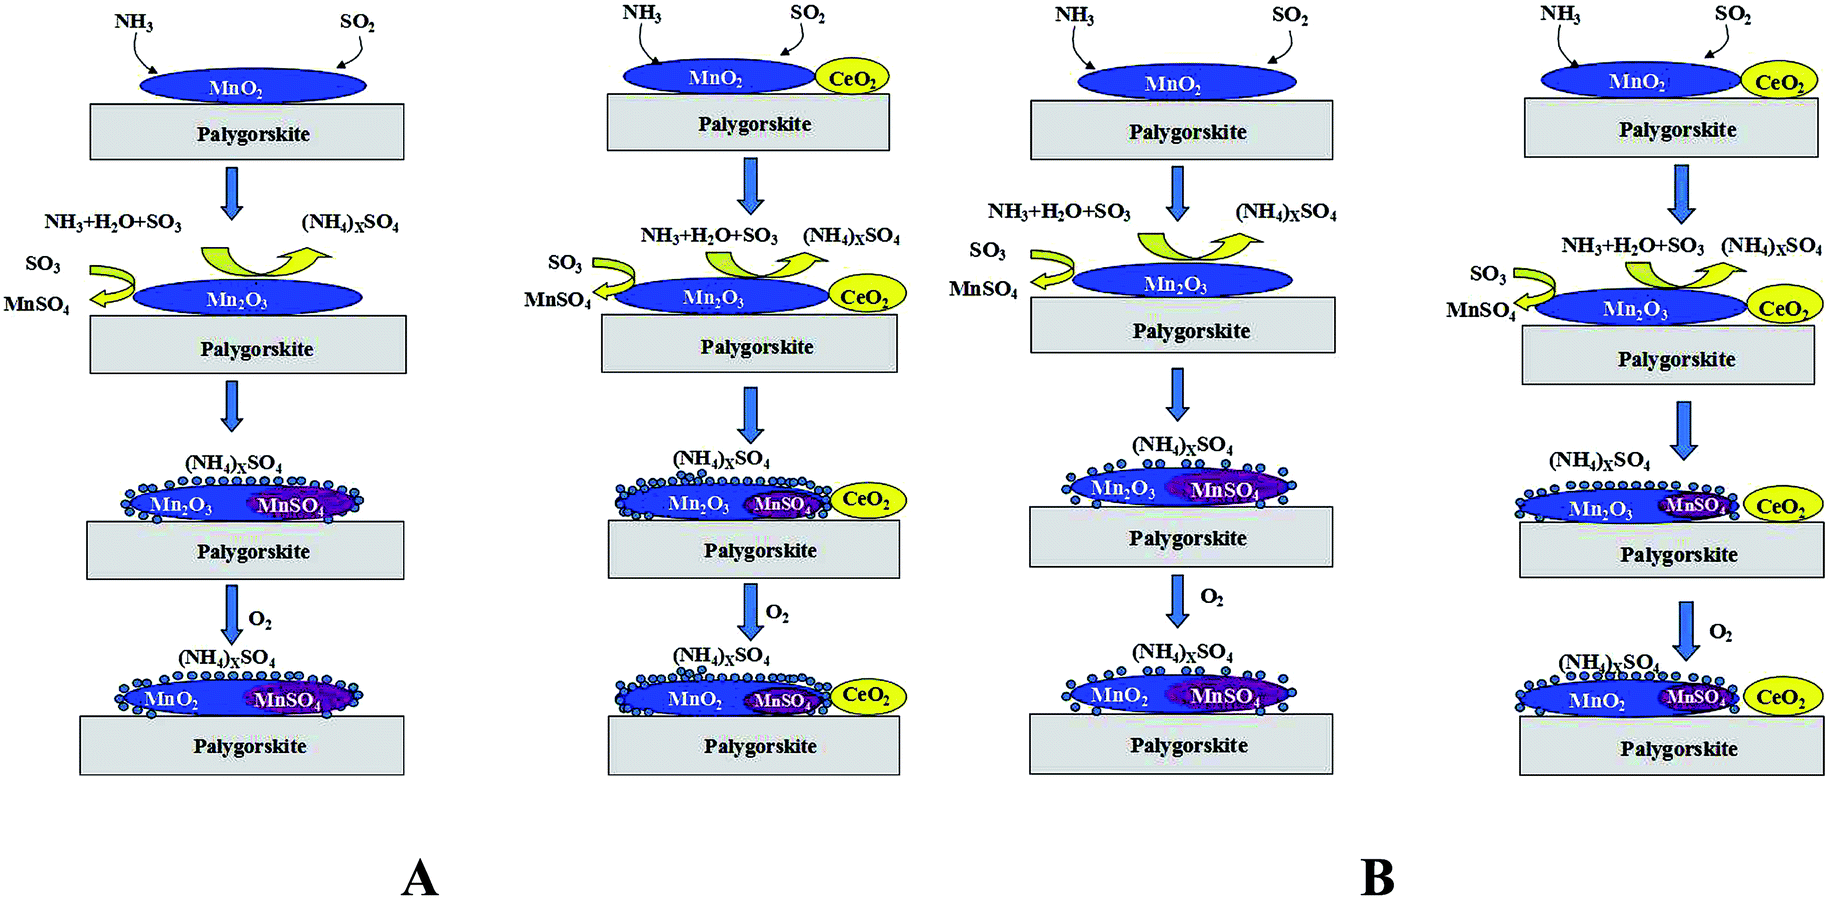
Fig. 8 shows the schematic of the mechanism underlying the NH3-SCR reaction over MnOx/PG catalyst in the presence of SO2. Unlikely previous study, the consumption of SO2 do not result in the formation of Ce2(SO4)3 but the formation of ammonium sulfates and manganese sulfates.18,25,35 On the basis of the above results, the SO2 deactivation of the catalyst can be attributed to the following two reasons. During the SCR, SO2 is oxidized to SO3 by the manganese oxides, which produces (NH4)xSO4 and MnSO4 combined with NH3 and MnO2.36 However, with the addition of CeO2, the active species (manganese oxides) transform between MnO2 and Mn2O3. According to study on MnOx–CeO2 catalyst reported by Qi et al., there exists a synergistic mechanism between the manganese and cerium oxides as shown in the following reactions (4)–(6):37,38
| | |
Mn2O3 + 2CeO2 → 2MnO2 + Ce2O3
| (5) |
| | |
Ce2O3 + 1/2O2 → 2CeO2
| (6) |
 |
| | Fig. 8 The mechanism on SCR of NOx with NH3 over MnOx supported palygorskite catalyst in the presence of SO2. (A) T < 150 °C; (B) T > 150 °C. | |
In case of the MnOx/PG catalyst, the accumulation of (NH4)xSO4 is more favored at lower temperatures (T < 150 °C). With the addition of cerium oxide to the catalyst, the degree of SO2 oxidation is improved, which in turn increases the deposition of ammonium sulfates. Meanwhile, the amount of MnSO4 gets decreased so as to slightly improve the catalytic activity at lower temperatures. Some studies have reported that the deactivation of SO2 tends to decrease with increase in temperature.39,40 For reaction temperatures higher than 150 °C, the formation of ammonium sulfates is decreased while that of MnSO4 is increased for the MnOx/PG catalyst. The major reason for SO2 deactivation is not the deposition of ammonium sulfates, but is the deposition of MnSO4 at medium temperature (150–250 °C). Therefore, the decreased accumulation of MnSO4 plays a more important role in the higher catalytic activity of the Mn–Ce/PG catalyst.
4. Conclusion
In summary, CeO2-doped MnOx/PG catalysts (Mn–Ce/PG) effectively resisted SO2 poisoning during the low-temperature SCR of NO with NH3. Different sulfates are formed at different temperatures during SCR on the surface of the Mn8/PG and Mn8Ce5/PG catalyst. This implies that different sulfates are responsible for the SO2 poisoning of the catalysts under different conditions. Results indicate that the accumulation of ammonium sulfate is favored at 150 °C, while manganese sulfate is predominantly formed at 200 °C. It was found that the cerium oxide addition did not inhibit the formation of ammonium sulfates. Rather, it aggravated the oxidation of SO2 to some extent and increased the deposition of ammonium sulfates, thereby restraining the formation of manganese sulfate on the surface of catalyst. Accordingly, it is the reduction of manganese sulfate rather than the ammonium sulfates, which is responsible for the observed resistance of the Ce-doped catalysts toward SO2 poisoning during SCR of NO with NH3.
Acknowledgements
The authors gratefully acknowledge financial support from the National Natural Science Foundation of China (40902020, 51002042), Ph. D. Programs Foundation of Ministry of Education of China (20090111120019), Programs Foundation of Provincial Education Department of Anhui (no. KJ2009B027, 2009SQRZ015, 2009AJZR0148, 2011AJZR0080).
References
- P. Forzatti, Appl. Catal., A, 2001, 222, 221–236 CrossRef CAS.
- B. Q. Jiang, Y. Liu and Z. B. Wu, J. Hazard. Mater., 2009, 162, 1249–1254 CrossRef CAS PubMed.
- P. R. Ettireddy, N. Ettireddy, S. Mamedov, P. Boolchand and P. G. Smirniotis, Appl. Catal., B, 2007, 76, 123–134 CrossRef CAS PubMed.
- W. S. Kijlstra, M. Biervliet, E. K. Poels and A. Bliek, Appl. Catal., B, 1998, 16, 327–337 CrossRef.
- G. Carja, Y. Kameshima, K. Okada and C. D. Madhusoodana, Appl. Catal., B, 2007, 73, 60–64 CrossRef CAS PubMed.
- D. S. Zhang, L. Zhang, C. Fang, R. H. Gao, Y. L. Qian, L. Y. Shi and J. P. Zhang, RSC Adv., 2013, 3, 8811–8819 RSC.
- L. Zhang, D. S. Zhang, J. P. Zhang, S. X. Cai, C. Fang, L. Huang, H. R. Li, R. H. Gao and L. Y. Shi, Nanoscale, 2013, 5, 9821–9829 RSC.
- R. B. Jin, Y. Liu, Z. B. Wu, H. Q. Wang and T. T. Gu, Chemosphere, 2010, 78, 1160–1166 CrossRef CAS PubMed.
- X. F. Tang, Y. G. Li, X. M. Huang, Y. D. Xu, H. Q. Zhu, J. G. Wang and W. J. Shen, Appl. Catal., B, 2006, 62, 265–273 CrossRef CAS PubMed.
- X. L. Zhang, B. W. Shi, X. P. Wu, W. P. Jiang, B. J. Yang and C. P. Zhang, Adv. Mater. Res., 2012, 356–360, 974–979 CrossRef CAS.
- J. Yu, F. Guo, Y. L. Wang, J. H. Zhu, Y. Y. Liu, F. B. Su, S. Q. Gao and G. W. Xu, Appl. Catal., B, 2010, 95, 160–168 CrossRef CAS PubMed.
- B. X. Shen and T. Liu, Acta Phys.–Chim. Sin., 2010, 26, 3009–3016 CAS.
- F. D. Liu, K. Asakura, H. He, W. P. Shan, X. Y. Shi and C. B. Zhang, Appl. Catal., B, 2011, 103, 369–377 CrossRef CAS PubMed.
- Z. B. Wu, R. B. Jin, H. Q. Wang and Y. Liu, Catal. Commun., 2009, 10, 935–939 CrossRef CAS PubMed.
- X. L. Zhang, L. F. Zhang, H. J. Zhang, X. P. Wu, J. N. Cheng, C. H. Xie and C. X. Yin, Adv. Mater. Res., 2013, 726–731, 2264–2269 CrossRef.
- X. N. Lu, C. Y. Song, S. H. Jia, Z. S. Tong, X. L. Tang and Y. X. Teng, Chem. Eng. J., 2015, 260, 776–784 CrossRef CAS PubMed.
- F. Cao, S. Su, J. Xiang, P. Y. Wang, S. Hu, L. S. Sun and A. C. Zhang, Fuel, 2015, 139, 232–239 CrossRef CAS PubMed.
- P. A. Kumar, Y. E. Jeong, S. Gautam, H. P. Ha, K. J. Lee and K. H. Chae, Chem. Eng. J., 2015, 275, 142–151 CrossRef CAS PubMed.
- M. A. Peralta, V. G. Milt, L. M. Cornaglia and C. A. Querini, J. Catal., 2006, 242, 118–130 CrossRef CAS PubMed.
- E. Stobbe, B. de Boer and J. Geus, Catal. Today, 1999, 47, 161–167 CrossRef CAS.
- J. Datka, A. Turek, J. Jehng and I. Wachs, J. Catal., 1992, 186–199 CrossRef CAS.
- Y. L. Wang, C. Z. Ge, L. Zhan, C. Li, W. M. Qiao and L. C. Ling, Ind. Eng. Chem. Res., 2012, 51, 11667–11673 CrossRef CAS.
- F. Kapteijn, A. D. Vanlangeveld, J. A. Moulijn, A. Andreini, M. A. Vuurman, A. M. Turek, J. M. Jehng and I. E. Wachs, J. Catal., 1994, 150, 94–104 CrossRef CAS.
- E. J. Romano and K. H. Schulz, Appl. Surf. Sci., 2005, 246, 262–270 CrossRef CAS PubMed.
- D. W. Kwon, K. B. Nam and S. C. Hong, Appl. Catal., A, 2015, 497, 160–166 CrossRef CAS PubMed.
- B. L. Zhang, B. S. Chen, K. Y. Shi, S. J. He, X. D. Liu, Z. J. Du and K. L. Yang, Appl. Catal., B, 2003, 40, 253–258 CrossRef CAS.
- H. Z. Chang, X. Y. Chen, J. H. Li, L. Ma, C. Z. Wang, C. X. Liu, J. W. Schwank and J. M. Hao, Environ. Sci. Technol., 2013, 47, 5294–5301 CrossRef CAS PubMed.
- E. García-Bordejé, J. L. Pinilla, M. J. Lázaro, R. Moliner and J. L. G. Fierro, J. Catal., 2005, 233, 166–175 CrossRef PubMed.
- R. Kiyoura and K. Urano, Ind. Eng. Chem., 1970, 9, 489–494 CAS.
- X. L. Zhang, W. P. Jiang, X. P. Wu, B. W. Shi, B. J. Yang, X. B. Jia and C. P. Zhang, J. Chem. Ind. Eng., 2012, 63, 916–923 CAS.
- R. Jothiramalingam, B. Viswanathan and T. K. Varadarajan, Catal. Commun., 2005, 6, 41–45 CrossRef CAS PubMed.
- M. Olszak-Humienik and J. Mozejko, Thermochim. Acta, 2000, 344, 73–79 CrossRef CAS.
- W. S. Kijlstra, M. Biervliet, E. K. Poels and A. Bliek, Appl. Catal., B, 1998, 16, 327–337 CrossRef.
- J. H. Huang, Z. Q. Tong, Y. Huang and J. F. Zhang, Appl. Catal., B, 2008, 78, 309–314 CrossRef CAS PubMed.
- L. Zhang, L. L. Li, Y. Cao, X. J. Yao, C. Y. Ge, F. Gao, Y. Deng, C. J. Tang and L. Dong, Appl. Catal., B, 2015, 165, 589–598 CrossRef CAS PubMed.
- X. L. Tang, J. M. Hao, H. H. Yi and J. H. Li, Catal. Today, 2007, 126, 406–411 CrossRef CAS PubMed.
- G. Qi, R. T. Yang and R. Chang, Appl. Catal., B, 2004, 51, 93–106 CrossRef CAS PubMed.
- G. Qi and R. T. Yang, J. Catal., 2003, 217, 434–441 CrossRef CAS.
- T. Valdés-Solıs, G. Marbán and A. B. Fuertes, Appl. Catal., B, 2003, 46, 261–271 CrossRef.
- T. S. Park, S. K. Jeong, S. H. Hong and S. C. Hong, Ind. Eng. Chem. Res., 2001, 40, 4491–4495 CrossRef CAS.
|
| This journal is © The Royal Society of Chemistry 2015 |
Click here to see how this site uses Cookies. View our privacy policy here.