A direct warm-white-light CaLa2(MoO4)4: Tb3+, Sm3+ phosphor with tunable color tone via energy transfer for white LEDs
Wei Xie,
Guixia Liu*,
Xiangting Dong,
Jinxian Wang and
Wensheng Yu
Key Laboratory of Applied Chemistry and Nanotechnology at Universities of Jilin Province, Changchun University of Science and Technology, Changchun, China. E-mail: liuguixia22@163.com; Fax: +86-431-85383815; Tel: +86-431-85582574
First published on 8th September 2015
Abstract
A series of Tb3+, Sm3+ co-doped CaLa2(MoO4)4 phosphors have been prepared via a solvothermal method without further sintering. The CaLa2(MoO4)4:1% Tb3+, x% Sm3+ (x = 0.0–5.0) phosphors were characterized by X-ray diffraction (XRD), field-emission scanning electron microscopy (FE-SEM) and photoluminescence (PL) spectra. Upon 277 nm excitation, the phosphors exhibit strong green emission of the Tb3+ ions and red-orange emission of the Sm3+ ions, the quenching concentration of Sm3+ is determined to be about 4%. The critical distance between Tb3+ and Sm3+ has been calculated to be about 14.3 Å and the energy transfer from Tb3+ to Sm3+ occurs through a dipole–dipole interaction. The color tone of the obtained phosphors is easily modulated from blue to cool-white, green, and ultimately to warm-white-light. Furthermore, the relationship between the value of CCT for warm-white-light and the rare earth ion (Tb3+, Sm3+) concentration was investigated in detail. These results reveal that this kind of phosphor is a potential candidate for white LEDs.
1 Introduction
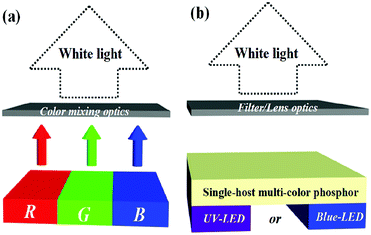
In recent years, white light emitting diodes (w-LEDs) are hoped to be the fourth-generation lighting source because of their longer lifetime, higher energy efficiency, greater reliability, and more environmentally friendly characteristics than conventional incandescent and fluorescent lamps.1,2 Currently, there are three different ways to achieve white light based on LEDs, as shown in Fig. 1a and b.3,4 At present, the commercial white LEDs are fabricated by combing a blue InGaN chip with the yellow-emitting Y3Al5O12:Ce3+ (YAG:Ce3+) phosphor. However, this combination has a high correlated color temperature (CCT = 7756 K) and low color rendering index (Ra < 80) due to the lack of red component, which can not meet the warm-white-light demands.5 Warm-white-light LEDs can be achieved by utilizing a UV LED chip to excite a blend of blue, green, and red emitting phosphors. Unfortunately, the strong re-absorption of the blue light by the green and red phosphors may significantly low the conversion efficiency of the device.6–9 Therefore, it is important to design a single-phase direct warm-white-light phosphor, which is expected to overcome the above-mentioned drawbacks. For this case, many excellent phosphors have been synthesized, such as Ca3Sc2Si3O12:Ce3+, Mn2+,10 KSr4(BO3)3:Dy3+, Tm3+, Eu3+,11 Na3(Y, Sc)Si3O9:Eu2+.12Owing to the characteristic emissions 4G5/2 → 6HJ/2 (J = 5, 7, 9) of Sm3+ ions are in the orange-red region, they are expected to provide red color component in phosphor.13,14 However, Sm3+ ions have very weak emissions under UV excitation. Tb3+ ions are expected to be used as green emitters in rare earth ions doped phosphors due to the high efficiency characteristic green emissions. It is well known that Tb3+ ions can exhibit strong blue and green emissions by adjusting the concentration of Tb3+ ions and excitation wavelengths. Obviously, the characteristic emissions of Tb3+ and Sm3+ ions almost cover the whole visible region. Warm-white-light can be easily realized by varying the relative composition of Tb3+/Sm3+ and excitation wavelengths in single-phase host. Furthermore, the 5D3 and 5D4 emission bands of Tb3+ have a good overlap with the excitation bands of Sm3+. It is expected that Tb3+ ions could transfer energy to Sm3+ ions, which contributes to realizing warm-white-light. In previous researches, it was reported that energy transfer played an important role in the luminescence properties of the phosphors.15 It can not only increase the PL intensities of the phosphor, but also tune the emission color by changing the concentrations of the sensitizer and activator. Some research work has been done to develop the single-phase phosphors based on the process of energy transfer from Tb3+ to Sm3+, such as in the host of NaGd(WO4)2,16 NaGdF4,17 BaCeF5,18 and Ca2Gd8Si6O26.19
As a large class of inorganic functional materials, molybdates have attracted great interest due to their wide use in catalysts, laser, and luminescence materials.20–24 Recently, the research has focused on the double rare earth molybdates ARE(MoO4)2 (A = Li, Na and K, RE = rare earth cation), which share the sheelite-like (CaWO4) isostructure, owing to their broad and intense absorption band in the near-UV region, excellent thermal and hydrolytic stability, they can be widely used in white light-emitting diodes (white LEDs).25–28 However, only few researches have done on the synthesis of rare-earth molybdates with the structure of ARE2(MoO4)4 (A = alkaline earth, RE = rare earth cation).29–31 More importantly, there has been no reports on Tb3+, Sm3+ co-doped in CaLa2(MoO4)4 host up to now.
In this work, we report on the synthesis, structure, luminescence properties and energy transfer of a series of molybdate-type phosphor, CaLa2(MoO4)4:Tb3+, Sm3+, which can serve as a single-phase warm-white-light phosphor based on the UV-LEDs. The emission color of the obtained phosphors is easily modulated by changing the Sm3+ contents. The efficient energy transfer and critical distance between Tb3+ and Sm3+ were calculated. In addition, we have also investigated the relationship between the values of CCT and the rare-earth ions (Tb3+, Sm3+) concentration in detail.
2 Experimental section
2.1 Materials
Aqueous solutions of La(NO3)3, Tb(NO3)3, Sm(NO3)3 and Ca(NO3)2 were obtained by dissolving the rare earth oxides La2O3, Tb4O7, Sm2O3, and CaO in dilute HNO3 solution (15 mol L−1) under heating with agitation in ambient atmosphere. All the other chemicals were of analytic grade and used as received without further purification.2.2 Preparation
A series of rare earth ions-doped CaLa2(MoO4)4 phosphors were synthesized by a facile solvothermal process without further sintering treatment. For the synthesis of CaLa2(MoO4)4:1% Tb3+, 1% Sm3+ phosphor, 1.0 mmol of RE(NO3)3 (including 0.98 mmol La(NO3)3, 0.01 mmol Tb(NO3)3, 0.01 mmol Sm(NO3)3) and 0.5 mmol Ca(NO3)2 were added into 100 mL flask. After vigorous stirring for 20 min, 2.0 mmol of Na2MoO4·2H2O, 8.8 mL H2O and 20 mL CH3CH2OH (according to the molar ratio of H2O![[thin space (1/6-em)]](https://www.rsc.org/images/entities/char_2009.gif) :
:![[thin space (1/6-em)]](https://www.rsc.org/images/entities/char_2009.gif) CH3CH2OH = 1
CH3CH2OH = 1![[thin space (1/6-em)]](https://www.rsc.org/images/entities/char_2009.gif) :
:![[thin space (1/6-em)]](https://www.rsc.org/images/entities/char_2009.gif) 1) was slowly added into the above solution. After additional agitation for 30 min, the as-obtained white mixing solution was transferred to a 50 mL Teflon bottle (filled up to 80% of its total volume) held in a stainless steel autoclave, and then heated at 180 °C for 20 h. Finally, as the autoclave was naturally cooled to room temperature, the precipitates were separated by centrifugation at 9000 rpm for 3 min, washed with deionized water and ethanol in sequence each three times, and then dried in oven at 60 °C for 12 h. The other samples were prepared in a similar procedure except for the doping appreciate content of rare earth ions.
1) was slowly added into the above solution. After additional agitation for 30 min, the as-obtained white mixing solution was transferred to a 50 mL Teflon bottle (filled up to 80% of its total volume) held in a stainless steel autoclave, and then heated at 180 °C for 20 h. Finally, as the autoclave was naturally cooled to room temperature, the precipitates were separated by centrifugation at 9000 rpm for 3 min, washed with deionized water and ethanol in sequence each three times, and then dried in oven at 60 °C for 12 h. The other samples were prepared in a similar procedure except for the doping appreciate content of rare earth ions.
2.3 Characterization
X-ray diffraction (XRD) was performed with a Rigaku D/max- RA X-ray diffractometer with Cu Kα radiation (λ = 0.15406 nm) and Ni filter, operating at a scanning speed of 10° min−1 in the 2θ range from 10 to 90°, 20 mA, 30 kV. The morphology of the samples was observed by field emission scanning electron microscope (FESEM) using a FEI XL-30 instrument. The excitation and emission spectra, and the luminescence decay curves of samples were measured using a HITACHI F-7000 Fluorescence Spectrophotometer equipped with a 150 W Xe lamp as the excitation source, operating at 700 V, scanning at 1200 nm min−1. Both of the excitation and emission slits were set at 2.5 nm. All of the measurements were performed at room temperature.3 Results and discussion
3.1 Phase identification and morphology
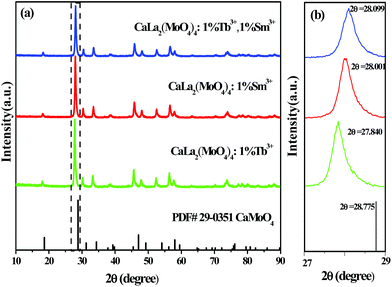
Fig. 2a shows the XRD patterns of CaLa2(MoO4)4:Tb3+, Sm3+. It is noted that all diffraction peaks of the samples are found to be well coincident with the standard CaMoO4 (PDF#29-0351). The strong and sharp diffraction peaks indicate that the as-synthesized samples at low temperatures are still highly crystalline. It is also observed that the entire diffraction profiles shift to the lower angle, as depicted in Fig. 2b, owing to the larger ionic radius of La3+ (1.16 Å) compared with that of Ca2+ (1.12 Å).32 The diffraction profiles shift towards to the higher degree from CaLa2(MoO4)4:1% Tb3+, CaLa2(MoO4)4:1% Sm3+ to CaLa2(MoO4)4:1% Tb3+, 1% Sm3+, which can be assigned to the ionic radius for the Tb3+ ions (1.04 Å) and the Sm3+ ions (1.079 Å) are smaller than La3+ ions (1.16 Å).32 In view of the ionic radius and valence state, the Tb3+ and Sm3+ ions preferentially substitute the La3+ ions in the CaLa2(MoO4)4 crystal. In other words, the rare-earth ions have been effectively built into the host.The morphology and size of the phosphors are important for their application in coatings on lighting devices.33 Fig. 3 shows the FESEM images of CaLa2(MoO4)4:1.0% Tb3+, 1.0% Sm3+ phosphor at different magnification, it is noted that the obtained phosphors take on a micro-sphere morphology with the diameter in the range of 0.2–0.8 μm and the average diameter is 0.437 μm, seen from the particle size histogram in the inset of Fig. 3b. The result can meet the requirement of commercial white LEDs phosphors.
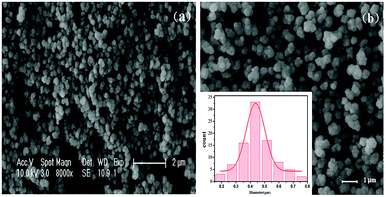 | ||
| Fig. 3 FESEM images (a and b) of CaLa2(MoO4)4:1.0% Tb3+, 1.0% Sm3+ phosphor (inset of b is the particle size histogram). | ||
3.2 Photoluminescence properties
Fig. 4 illustrates the PLE and PL spectra for CaLa2(MoO4)4:1% Tb3+ (a) and CaLa2(MoO4)4:1% Tb3+, 1% Sm3+ (b) phosphors. As seen from Fig. 4a, we have observed that the excitation spectrum of CaLa2(MoO4)4:1% Tb3+ (monitored at 545 nm) exhibits a strong excitation band from 200 to 350 nm with a maximum at 277 nm and two weak absorption peaks at 369 and 377 nm, which are assigned to the charge transfer (CTB) transition within Mo6+–O2− and the transitions of Tb3+ ions from the ground level 7F6 to the 5G6 and 5D3 excited levels, respectively. Upon 277 nm excitation, CaLa2(MoO4)4:1% Tb3+ phosphor emits a series of luminescent peaks located at 490, 545, 586, 620 nm, which originate from the 5D4 → 7FJ (J = 6, 5, 4, 3) transitions of Tb3+. Meanwhile, it is clearly seen that two strong green emissions (490 and 545 nm) and weak yellow and red emissions (586 and 620 nm), which could be used for obtaining excellent and abundant tunable color emissions. As seen from Fig. 4b, the PLE spectrum of CaLa2(MoO4)4:1% Tb3+, 1% Sm3+ illustrates some absorption peaks corresponding to the characteristic transitions of Tb3+ (369 and 377 nm) and Sm3+ (405 nm) when monitored by the emission of Sm3+ ions (564 nm), demonstrating the existence of energy transfer from the Tb3+ to Sm3+ ions in the CaLa2(MoO4)4 host. In addition, the CaLa2(MoO4)4:1% Tb3+, 1% Sm3+ presents a weaker CTB monitored at 564 nm than that monitored at 545 nm, suggesting that the energy transfer from CTB to Tb3+ is more efficient than that from CTB to Sm3+.34 Upon 277 nm excitation, the CaLa2(MoO4)4:1% Tb3+, 1% Sm3+ phosphor exhibits the characteristic emissions of 5D4 → 7FJ (J = 6, 5, 4, 3) transitions of Tb3+ ions and 4G2/5 → 6HJ (J = 5/2, 7/2, 9/2) transitions of Sm3+ ions, corresponding to 490, 545, 586, 625 nm for Tb3+ ions and 564, 594, 646 nm for Sm3+ ions, respectively. The emission spectrum nearly covers the entire visible region. Therefore, warm-white-light can be generated by combining the emissions of Tb3+ ions and orange-red emissions of Sm3+ ions in a single host by changing the Tb3+ and Sm3+ content via the process of energy transfer.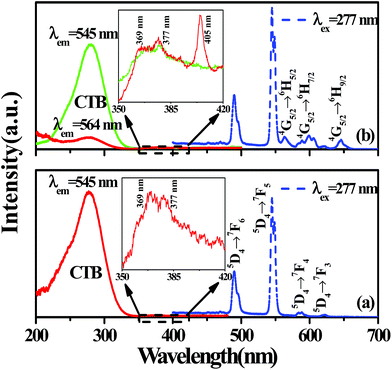 | ||
| Fig. 4 Photoluminescence excitation (PLE) and photoluminescence (PL) spectra for CaLa2(MoO4)4:1% Tb3+ (a) and CaLa2(MoO4)4:1% Tb3+, 1% Sm3+ (b) phosphors. | ||
In order to verify the energy transfer from Tb3+ to Sm3+, Fig. 5 presents the PL spectrum of CaLa2(MoO4)4:1% Tb3+ (dash line) and the PLE spectrum of CaLa2(MoO4)4:1% Sm3+ (solid line). The solid line is the f–f transitions of Sm3+ in the longer wavelength region at 405, 416, 444, 465 and 483 nm corresponding to the electronic transitions of Sm3+ ions from the ground level 6H5/2 to the 4K11/2, 6P5/2, 4G9/2, 4F5/2 and 4I11/2 excited levels, respectively.
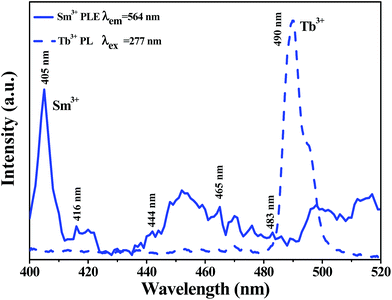 | ||
| Fig. 5 The PL emission spectrum of CaLa2(MoO4)4:1% Tb3+ (dash line) and the PLE spectrum of CaLa2(MoO4)4:1% Sm3+ (solid line). | ||
Furthermore, we can find that the strongest peak is located at 405 nm, which is suitable to be used for near-UV LED excited phosphors.16 The dash line is the emission peaks of Tb3+, we also observe the strong peak at 490 nm. Due to the d–d forbidden transitions of Sm3+, their excitation transitions are difficult to excite and the emission intensity is very weak. Therefore, the energy transfer was expected to occur from Tb3+ to Sm3+. Based on the effective spectral overlap from Fig. 5, it is found that the 5D3 and 5D4 emission bands of Tb3+ overlap the excitation bands of Sm3+. Based on the above discussion, the energy transfer from Tb3+ to Sm3+ is expected to occur in CaLa2(MoO4)4 system.
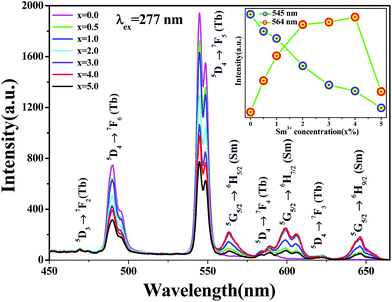
A series of CaLa2(MoO4)4:1% Tb3+, x% Sm3+ (x = 0.0, 0.5, 1.0, 2.0, 3.0, 4.0, 5.0) samples have been prepared to further study the energy transfer phenomenon from Tb3+ to Sm3+. Fig. 6 illustrates the PL emission spectra of the Tb3+, Sm3+ co-doped CaLa2(MoO4)4 phosphors with different Sm3+ doped concentrations. Upon 277 nm excitation, the PL spectra consist of the typical green emissions of Tb3+ and the typical orange-red emissions of Sm3+. Furthermore, we find that the PL intensities of 5D4 → 7F6 (490 nm) and 5D4 → 7F5 (545 nm) transitions for Tb3+ decrease monotonically with an increase in doping Sm3+ concentration. Meanwhile, the emissions of 4G5/2 → 6H5/2 (564 nm), 4G5/2 → 6H7/2 (594 nm) and 4G5/2 → 6H9/2 (648 nm) of Sm3+ increase gradually until the Sm3+ concentration is above 4% and then decrease for the concentration quenching, which can be easily observed from the inset of Fig. 6. These results give us another evidence to validate energy transfer from Tb3+ to Sm3+. In addition, as shown in Fig. 6, one can see that the emission peak of the Sm3+ shifts toward short wavelength with gradually increasing the doping concentration of Sm3+, which originates from the change of crystal field strength.8,35
Generally speaking, the critical distance (RC) of energy transfer is calculated by using the concentration quenching method estimated by the following formula suggested by Blasse:36,37
| RC = 2 × [3V/(4πxCZ)]1/3 | (1) |
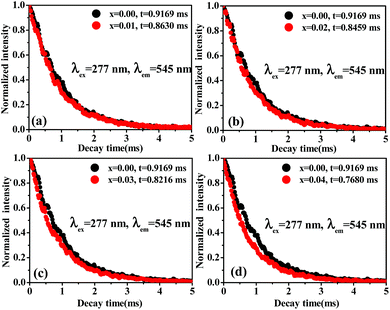
In order to well understand the mechanism of the energy transfer process, the fluorescent decay curves of CaLa2(MoO4)4:1% Tb3+, x% Sm3+ (x = 1.0, 2.0, 3.0, 4.0) samples were measured by monitoring the emission of Tb3+ at 545 nm. As shown from Fig. 7a–d, it is easily found that all the decay curves of Tb3+ can be fitted to a single exponential function as:
| I = I0 + Ae−t/τ | (2) |
Fig. 8 shows the decay time of the Tb3+ and the energy transfer efficiency from Tb3+ to Sm3+ as a function of Sm3+ doping concentration in host. The energy transfer efficiency ηT from the sensitizer to the activator can be calculated by the following equation:39
| ηT = 1 − IS/IS0 | (3) |
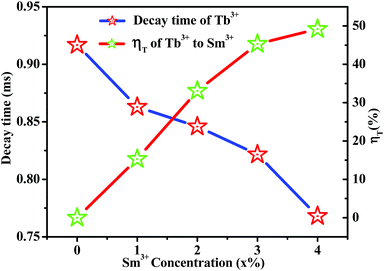 | ||
| Fig. 8 Dependence of the decay time of the Tb3+ and energy transfer efficiency ηT on doped Sm3+ concentration in CaLa2(MoO4)4:1% Tb3+, x% Sm3+ (x = 0.0, 1.0, 2.0, 3.0, 4.0) phosphors. | ||
Based on the discussion above, it is easy for us to draw the conclusion that the energy transfer mechanism from the Tb3+ to Sm3+ ions is a multipolar interaction. According to Dexter's energy transfer formula of exchange and multipolar interaction, the following relation can be given as:40
| IS0/IS ∝ Cn/3 | (4) |
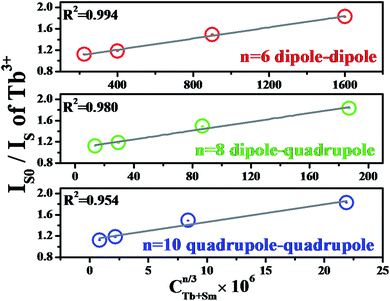 | ||
| Fig. 9 The dependence of IS0/IS of Tb3+ on CTb+Smn/3 × 106 in CaLa2(MoO4)4:1% Tb3+, x% Sm3+phosphors. | ||
To further research the dipole–dipole interaction, the energy transfer probability PSA from a sensitizer to an accepter is given by the following equation:41
| PSA = (1/τ) − (1/τ0) | (5) |
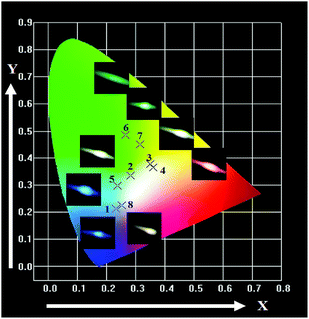
The Commission International de I'Eclairage (CIE) chromaticity coordinates and the correlated color temperature (CCT) for the single-phase CaLa2(MoO4)4:Tb3+, Sm3+ phosphors under different excitation wavelengths (277, 365, 370, 405 nm) are summarized in Table 1. As shown in Fig. 10, it can be observed that the color hue of the obtained phosphors can be easily modulated from blue (point 1, 5) to cool-white (point 2, 8), green (point 6, 7), and ultimately to warm-white (point 3, 4). Moreover, the points 3 and 4 show lower CCT values (4932, 4533 K), which meet the commercial warm-white-light requirement. All the above results reveal that the CaLa2(MoO4)4:Tb3+, Sm3+ phosphors can be used as a potential multicolor phosphor for w-LED application.
| Point | Sample | Excitation (nm) | CIE (x, y) | CCT (K) |
|---|---|---|---|---|
| 1 | 0.05% Tb3+, 5% Sm3+ | 365 | (0.232, 0.212) | 108![[thin space (1/6-em)]](https://www.rsc.org/images/entities/char_2009.gif) 458 458 |
| 2 | 0.05% Tb3+, 5% Sm3+ | 405 | (0.282, 0.334) | 8255 |
| 3 | 0.1% Tb3+, 5% Sm3+ | 277 | (0.349, 0.377) | 4932 |
| 4 | 0.1% Tb3+, 6% Sm3+ | 277 | (0.360, 0.366) | 4533 |
| 5 | 0.05% Tb3+, 5% Sm3+ | 277 | (0.238, 0.298) | 14![[thin space (1/6-em)]](https://www.rsc.org/images/entities/char_2009.gif) 047 047 |
| 6 | 1% Tb3+, 0.5% Sm3+ | 277 | (0.266, 0.485) | 7208 |
| 7 | 1% Tb3+, 4% Sm3+ | 277 | (0.315, 0.449) | 5973 |
| 8 | 1% Tb3+, 4% Sm3+ | 370 | (0.252, 0.226) | 36![[thin space (1/6-em)]](https://www.rsc.org/images/entities/char_2009.gif) 872 872 |
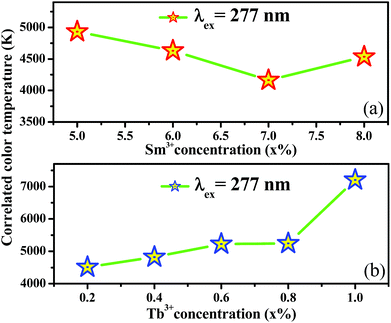
For the application of white LEDs, the correlated color temperature of the phosphor is one of the important factors. As we all known, the correlated color temperature for a warm-white-light should be less than 5000 K, which is popular in solid state lighting.11 Fig. 11 presents the relationship of the correlated color temperature for CaLa2(MoO4)4:Tb3+, Sm3+ phosphors with different Sm3+ and Tb3+ doping concentrations. Fig. 11a shows that the values of correlated color temperature are calculated to be 4932, 4630, 4164, 4534 K for the CaLa2(MoO4)4:0.1% Tb3+, x% Sm3+ (x = 5.0, 6.0, 7.0, 8.0), respectively. With an increase in Sm3+ concentration, we can find that the CCT decreases gradually until the Sm3+ concentration arrives at 7%, this phenomenon should result from the Sm3+ concentration quenching. From Fig. 11b, the values of correlated color temperature are calculated to be 4510, 4823, 5225, 5242, 7207 K for the CaLa2(MoO4)4:x% Tb3+, 5% Sm3+ (x = 0.2, 0.4, 0.6, 0.8, 1.0), respectively. Obviously, the values of CCT gradually increase as the concentration of Tb3+ increases. According to the above results, the values of CCT are closely related the Tb3+ and Sm3+ concentration, which have guiding significance for the application of commercial white LEDs.
In order to further describe the excitation and emission mechanisms in detail, we depict the energy-level diagram of Tb3+ and Sm3+ co-doped CaLa2(MoO4)4, shown in Fig. 12. It can be found that the electrons can absorb energies of photons from 277 nm UV light, when the electrons return to lower energy-level via multi-color emission and energy transfer from Tb3+ to Sm3+ ions, and some energy is lost by cross relaxation.
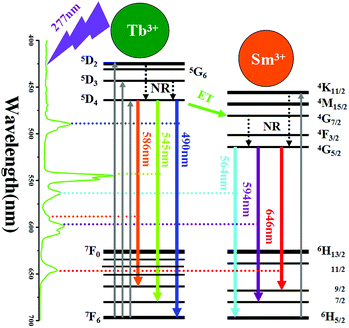 | ||
| Fig. 12 Schematic energy-level diagram showing the excitation and emission mechanisms of CaLa2(MoO4)4:Tb3+, Sm3+ phosphors (ET: energy transfer; NR: nonradiative). | ||
4 Conclusions
In summary, a series of color tunable phosphors from blue to warm-white-light were successfully realized with Tb3+ and Sm3+ co-doped in a CaLa2(MoO4)4 host. Upon 277 nm excitation, the phosphors show the intense green emissions of Tb3+ and the typical orange-red emissions of Sm3+. As for CaLa2(MoO4)4:1% Tb3+, x% Sm3+, the quenching concentration of Sm3+ was about x = 4.0. The photoluminescence and fluorescence decay times demonstrate that the energy transfer from Tb3+ to Sm3+ is expected. The critical distance for Tb3+ to Sm3+ has been calculated to be 14.3 Å by the basis of Dexter theory. The analysis indicates that the dipole–dipole interaction should be responsible for this energy transfer. The CIE coordinates show that the color hue can be tunable from blue to cool-white, green, and ultimately to warm-white-light. The CCT of warm-white-light emission required were obtained, which closely related to the Tb3+ and Sm3+ concentration. The results indicate that the as-synthesized phosphors have huge potential to be a single host warm-white-light phosphor for white LEDs.Acknowledgements
This work was supported by the National Natural Science Foundation of P.R. China (NSFC) (Grant No. 51072026, 51573023) and the Development of Science and Technology Plan Projects of Jilin Province (Grant No. 20130206002GX).Notes and references
- E. F. Schubert and J. K. Kim, Science, 2005, 308, 1274–1278 CrossRef CAS PubMed.
- Y. Narukawa, J. Narita, T. Sakamoto, T. Yamada, H. Narimatsu, M. Sano and T. Mukai, Phys. Status Solidi A, 2007, 204, 2087–2093 CrossRef CAS PubMed.
- S. Ye, F. Xiao, Y. X. Pan, Y. Y. Ma and Q. Y. Zhang, Mater. Sci. Eng., R, 2010, 71, 1–34 CrossRef.
- J. S. Hou, W. Z. Jiang, Y. Z. Fang and F. Q. Huang, J. Mater. Chem. C, 2013, 1, 5892–5898 Search PubMed.
- V. Bachmann, C. Ronda and A. Meijerink, Chem. Mater., 2009, 21, 2077–2084 CrossRef CAS.
- T. S. Chan, R. S. Liu and I. Baginskiy, Chem. Mater., 2008, 20, 1215–1217 CrossRef CAS.
- C. F. Guo, L. Luan, F. G. Shi and X. Ding, J. Electrochem. Soc., 2009, 156, J125–J128 CrossRef CAS.
- R. J. Xie, N. Hirosaki, M. Mitomo, K. Sakuma and N. Kimura, Appl. Phys. Lett., 2006, 89, 241103–241106 CrossRef PubMed.
- Z. G. Xia, X. M. Wang, Y. X. Wang, L. B. Liao and X. P. Jing, Inorg. Chem., 2011, 50, 10134–10142 CrossRef CAS PubMed.
- Y. F. Liu, X. Zhang, Z. D. Hao, Y. S. Luo, X. J. Wang and J. H. Zhang, J. Mater. Chem., 2011, 21, 16379–16384 RSC.
- L. Wu, Y. Zhang, M. Y. Gui, P. Z. Lu, L. X. Zhao, S. Tian, Y. F. Kong and J. J. Xu, J. Mater. Chem., 2012, 22, 6463–6470 RSC.
- Z. G. Xia and Z. Y. Mao, J. Mater. Chem. C, 2013, 1, 5917–5924 RSC.
- R. Satheesh Kumar, V. Ponnusamy and M. T. Jose, J. Lumin., 2013, 29, 649–656 CrossRef PubMed.
- C. Y. Jia, W. Lü, N. Guo, W. Lv, Q. Zhao and H. P. You, Chem. Commun., 2013, 49, 2664–2666 RSC.
- P. P. Dai, X. T. Zhang, L. L. Bian, S. Lu, Y. C. Liu and X. J. Wang, J. Mater. Chem. C, 2013, 1, 4570–4576 RSC.
- Y. Liu, G. X. Liu, X. T. Dong, J. X. Wang and W. S. Yu, RSC Adv., 2014, 4, 45389–45396 RSC.
- H. X. Guan, G. X. Liu, X. T. Dong, J. X. Wang and W. S. Yu, Dalton Trans., 2014, 43, 10801–10808 RSC.
- T. Sheng, Z. Fu, X. Wang, S. Zhou, S. Zhang and Z. Dai, J. Phys. Chem. C, 2012, 116, 19597–19603 CAS.
- G. S. R. Raju, J. Y. Park, H. C. Jung, E. Pavitra, B. K. Moon, J. H. Jeong and J. H. Kim, J. Mater. Chem., 2011, 21, 6136–6139 RSC.
- C. Mazzocchia, C. Aboumrad, C. Diagne, E. Tempesti, J. M. Herrmann and G. Thomas, Catal. Lett., 1991, 10, 181–191 CrossRef CAS.
- D. Spassky, S. Ivanov, I. Kitaeva, V. Kolobanov, V. Mikhailin, L. Ivleva and I. Voronina, Phys. Status Solidi C, 2005, 2, 65–68 CrossRef CAS.
- H. Barry, F. Moore and D. Robitaille, US Pat., 3 726 694, 1973.
- S. S. Kim, S. Ogura, H. Ikuta, Y. Uchimoto and M. Wakihara, Chem. Lett., 2001, 30, 760–761 CrossRef.
- R. Sundaram and K. S. Nagaraja, Sens. Actuators, B, 2004, 101, 353–360 CrossRef CAS PubMed.
- T. Wu, Y. F. Liu, Y. N. Lu, L. Wei, H. Gao and H. Chen, CrystEngComm, 2013, 15, 2761–2768 RSC.
- V. A. Morozov, B. I. Lazoryak, S. Z. Shmurak, A. P. Kiselev, O. I. Lebedev, N. Gauquelin, J. Verbeeck, J. Hadermann and G. V. Tendeloo, Chem. Mater., 2014, 26, 3238–3248 CrossRef CAS.
- Y. S. Hu, W. D. Zhuang, H. Q. Ye, D. H. Wang, S. S. Zhang and X. W. Huang, J. Alloys Compd., 2005, 390, 226–229 CrossRef CAS PubMed.
- L. Xu, X. Y. Yang, H. M. Lu, C. H. Hu and W. H. Hou, RSC Adv., 2014, 4, 13502–13508 RSC.
- V. A. Morozov, A. Bertha, K. W. Meert, S. V. Rompaey, D. Batuk, G. T. Martinez, S. V. Aert, P. F. Smet, M. V. Raskina, D. Poelman, A. M. Abakumov and J. Hadermann, Chem. Mater., 2013, 25, 4387–4395 CrossRef CAS.
- C. F. Guo, H. K. Yang and J. H. Jeong, J. Lumin., 2010, 130, 1390–1393 CrossRef CAS.
- J. S. Liao, D. Zhou, B. Yang, R. Q. Liu, Q. Zhang and Q. H. Zhou, Luminescence, 2013, 134, 533–538 CrossRef CAS PubMed.
- R. D. Shanan, Acta Crystallogr., Sect. A: Cryst. Phys., Diffr., Theor. Gen. Crystallogr., 1976, 32, 751–767 CrossRef.
- L. Hou, S. B. Cui, Z. L. Fu, Z. J. Wu, X. H. Fu and H. Jeong, Dalton Trans., 2014, 43, 5382–5392 RSC.
- Y. H. Zheng, Y. J. Huang, M. Yang, N. Guo, H. Qiao, Y. C. Jia and H. P. You, J. Lumin., 2012, 132, 362–367 CrossRef CAS PubMed.
- G. Blasse, J. Solid State Chem., 1986, 62, 207–211 CrossRef CAS.
- G. Blasse, Philips Res. Rep., 1969, 24, 131–144 CAS.
- C. H. Huang and T. M. Chen, J. Phys. Chem. C, 2011, 115, 2349–2355 CAS.
- B. M. Antipeuko, I. M. Bataev, V. L. Ermolaev, E. I. Lyubimov and T. A. Pricalova, Opt. Spectrosc., 1970, 29, 177–180 Search PubMed.
- P. I. Paulose, G. Jose, V. Thomas, N. V. Unnikrishnan and M. K. R. Warroer, J. Phys. Chem. Solids, 2003, 64, 841–846 CrossRef CAS.
- D. L. Dexter and J. H. Schulman, J. Chem. Phys., 1954, 21, 836–850 CrossRef PubMed.
- G. S. R. Raju, J. Y. Park, H. C. Jung, E. Pavitra, B. K. Moon, J. H. Jeong and J. H. Kim, J. Mater. Chem., 2011, 21, 6136–6139 RSC.
| This journal is © The Royal Society of Chemistry 2015 |

