
 Open Access Article
 This Open Access Article is licensed under a
 Creative Commons Attribution 3.0 Unported Licence
Island-type growth of Au–Pt heterodimers: direct visualization of misfit dislocations and strain-relief mechanisms†
C. A.
García-Negrete
*a,
B. R.
Knappett
b,
F. P.
Schmidt
c,
T. C.
Rojas
a,
A. E. H.
Wheatley
b,
F.
Hofer
c and
A.
Fernández
*a
aInstituto de Ciencia de Materiales de Sevilla (CSIC e Univ. Sevilla), CIC Cartuja, Avda. Américo Vespucio nr. 49, 41092 Sevilla, Spain. E-mail: asuncion@icmse.csic.es; cagarcian@unal.edu.co
bDepartment of Chemistry, University of Cambridge, Lensfield Road, Cambridge CB2 1EW, UK
cInstitute for Electron Microscopy and Nanoanalysis, Graz University of Technology, Steyrergasse 17, 8010 Graz, Austria
First published on 15th June 2015
Abstract
Structural and analytical characterization related to the formation mechanism of Au–Pt heterodimers from polyhedral Pt nanocrystals is reported. The observation of specific lattice strain effects and the emergence of misfit dislocations point to the relevance of the Stranski–Krastanov growth mode as a means of explaining the previously reported dimerisation reaction between Au and Pt. Two size-dependent strain relief mechanisms were identified. For dimers grown from 4.7 nm seeds, the mechanism is related to bulk lattice strain accumulation at {111} planes along with lattice relaxation effects on other crystalline planes. However, for dimers grown from 11.2 nm seed sizes, the formation of misfit dislocations proved to be a highly efficient mechanism by which to release interface mismatch strain. Nanoscale chemical mapping at Au–Pt interfaces also revealed Au–Pt alloying to be unlikely under the mild temperature conditions employed in this work for Au–Pt heterodimer synthesis.
Introduction
Heterostructured materials with a topologically defined distribution of their compositions are receiving a great deal of scientific attention due to their unique catalytic1–3 and multifunctional properties.4–7 Appropriate combinations of building blocks have led to a new generation of nanoparticles such as heterodimers (HDs), wherein two chemically distinct components are joined together through a small solid–solid interface.8 A broad range of metals, metal oxides and semiconductors can be used to produce HDs through wet chemical approaches; however HD synthesis can be more complicated than that of monomeric nanocrystals, and some of the fundamental processes that control their formation, such as heterogeneous nucleation, particle growth, and ripening, are incompletely understood.9 Moreover, heterostructured nanoparticles can exhibit lattice mismatch and strain,10,11 which in most cases directly affect their intricate structures and their physical properties. Hence, marked effects on both catalytic properties12–14 and bandgap structures15 have been found in different nanoparticle types and attributed to lattice strain.Au–Pt heterostructures are currently relevant for fuel cell technology, where they have shown the ability to be used as enhanced nanocatalysts towards preferential carbon monoxide oxidation in the presence of hydrogen16 as well as in formic acid17 and methanol oxidation.18 In order to tune Au–Pt heterostructures for specific applications, a complete understanding of their formation mechanism as well as the effects of lattice strain on their intricate structures are needed. We previously showed that preferentially exposed facets of Pt seeds played a crucial role in modulating Au–Pt HD formation.19 More recently, it was reported that intermediate core/shell heterostructures with a coherent lattice structure are formed first at the expense of lattice stress in the seed, with the relief of lattice strain in the shell then taking place through the slip of {111} Au atomic layers at the seed/Au interface.20 Though the formation of line defects were also discussed in the same study,20 the observation of misfit dislocations or other extended defects was not reported. Here, we study the epitaxial growth of Au on Pt seeds with sizes of 4.7 nm and 11.2 nm respectively. Both types of Pt nanocrystal had polyhedral shapes (cubeoctahedral and octahedral) and this made it easier to follow the shape transformations that took place during Au–Pt HD formation. Through X-ray diffraction (XRD) and aberration-corrected scanning transmission electron microscopy (STEM) studies of the HDs formed, we have identified lattice strain accumulation on specific crystallographic planes as well as strain-release mechanisms. Consistent with the recent suggestion that the Stranski–Krastanov growth mode operates for Au on Pt nanocrystals,20 the emergence of misfit dislocations in Au–Pt HDs formed from 11.2 nm seeds was corroborated. In addition, the nanoscale chemical characterization of heterodimers and intermediates in their formation is presented and discussed from a mechanistic point of view, the understanding of which is fundamental to the rational design of metallic heterostructures for multifunctional applications.
Experimental section
Chemicals
Platinum(II) acetylacetonate (Pt(acac)2, 98%) was purchased from Acros Organics and used as received. Cobalt carbonyl moistened with 1–10% hexane (Co2(CO)8, 90%), manganese carbonyl (Mn2(CO)10, 98%), Gold(III) chloride trihydrate (HAuCl4·3H2O, 99%), oleylamine (OAm, 70%), oleic acid (OA, 99%), 1,2-tetradecanediol (TDD, 90%), benzyl ether (98%), 1,2-dichlorobenzene anhydrous (DCB, 99%), 2-propanol anhydrous (99.5%), chloroform anhydrous (≥99%)and hexane anhydrous (95%) were purchased from Sigma-Aldrich and used as received.Synthesis
A standard 3-neck round bottom flask equipped with a condenser and a controlled temperature oil bath was used. Prior to synthesis flasks were flushed and all solutions were degassed with nitrogen.Preparation of Pt seeds
The synthesis of octahedral Pt seeds was performed according to ref. 21. Briefly, a precursor mixture was prepared by dissolving 0.08 g Pt(acac)2 in 10 mL of benzyl ether, 7.36 mL of oleylamine and 1.25 mL of OA under N2 atmosphere. A solution of 20.5 μmol of Mn2(CO)10 in 1 mL of chloroform was then rapidly injected into the precursor mixture at 160 °C, and the resulting mixture was heated to 220 °C. After 30 min, the solution was left to cool and octahedral nanocrystals were isolated by adding ethanol or isopropanol followed by centrifugation. The obtained product was redispersed in hexane for further use. Similarly, the preparation of cubeoctahedral Pt seeds was performed according to ref. 19. Briefly, a solution containing 450 μL of OAm, 83 mg of TDD and 10 mL of DCB was added to a flask at room temperature under nitrogen and with continuous stirring. 3 mL of a solution of 40 mg of Pt(acac)2 (0.10 mmol) in DCB was then added and the temperature slowly increased over ∼35 min to 180 °C. At this temperature, 100 μL of DCB containing a trace amount of Co2(CO)8 (2 μmol) was added. The resulting solution was then boiled for a further 30 min before being gradually left to cool to room temperature. After washing with 50 mL of CHCl3/isopropanol 1![[thin space (1/6-em)]](https://www.rsc.org/images/entities/char_2009.gif) :4, followed by centrifugation, the Pt seeds were re-dispersed in 10 mL of hexane for further use.
:4, followed by centrifugation, the Pt seeds were re-dispersed in 10 mL of hexane for further use.
Preparation of Au–Pt heterodimers
Au–Pt heterodimers were prepared according to ref. 2 and 19. First, a precursor mixture was prepared by mixing 0.1 g of HAuCl4·3H2O and 2 mL of OAm with 20 mL of chloroform at room temperature under an N2 atmosphere. After mixing, the previously prepared 10 mL of Pt seeds were added and the resulting mixture stirred for different time intervals at a defined temperature. When octahedral Pt seeds were used, the dimerisation reaction was undertaken at 60 °C for 5 hours, while in cases where cubeoctahedral seeds were used the reaction was performed at room temperature for 48 hours. The dimers were precipitated through the addition of three parts by volume of ethanol or isopropanol followed by centrifugation at 4000 rpm for 30 min. The obtained solids were redispersed in hexane for further use.Characterization
Electron microscopy (EM) characterization was performed using two instruments: X-ray spectroscopy (EDX) and high angle annular dark field (HAADF)-STEM analyses of intermediate species as well as TEM were performed in an FEI Tecnai G2F30 S-Twin microscope (0.2 nm point resolution) operated at 300 kV and equipped with a HAADF Fischione detector (0.16 nm point resolution) and an INCA X-Max 80 silicon drift detector (SDD) for EDX. Bright field (BF-) and HAADF-STEM imaging as well as EDX mapping of HD samples were performed using a probe-corrected FEI Titan 3 G2 60-300 microscope with an X-FEG Schottky field emission electron source operated at 300 kV. The microscope was equipped with a Gatan Imaging Filter (GIF) Quantum and a FEI Super-X EDS detector, consisting of four separate silicon drift detectors. Gatan Digital Micrograph software was used to acquire images and perform further image processing. For sample preparation, 5 μL of dimer or seed dispersed in hexane was pipetted onto an ultrathin carbon/holey carbon film on 400 mesh Cu grid (TedPella no. 01824). X-ray diffraction measurements were performed using Cu Kα radiation in a PANalytical X'PERT PRO diffractometer in a Bragg–Brentano configuration in the 2θ range 20–90°, with a pass velocity of 0.05°. For lattice strain analysis, the fourth peaks with highest intensity from all experimental XRD patterns were considered independently using PANalytical X'pert high score plus software. The measured half-widths were corrected for instrumental broadening with reference to a pure-strain free silicon powder. UV-Vis characterization was performed in a Perkin Elmer Lambda XLS.Results and discussion
Evolution of Pt nanocrystals towards Au–Pt heterodimers
Two types of Au–Pt HD were prepared using a modified seed-mediated growth method employing chloroform media2,19 and using oleylamine as both reductant and capping agent. Different temperatures and reaction times were used depending on the Pt seed type (see Experimental section). As shown in Fig. 1a and b the Pt nanocrystal seeds were found to have polyhedral shapes corresponding to cubeoctahedra and octahedra respectively. While the cubeoctahedron is an Archimedean solid with both eight {111} and six {100} facets, the octahedron is a Platonic one with eight {111} preferentially exposed surfaces. Representative TEM images of the prepared polyhedral Pt nanocrystals are shown in the Fig. 1a and b. Detailed HRTEM studies of HDs of the types shown in Fig. 1c and d have been recently performed.19 However, the mechanism leading to their binary particle shape is not completely understood. In order to elucidate the initial stages of the dimerization reaction between Au and Pt, we selected the Au overgrowth on Pt cubeoctahedra as a model system. This overgrowth process can be performed at room temperature,19 rendering both quick sampling from the reaction medium and UV-Vis spectroscopic analysis feasible. Fig. 2 shows UV-Vis extinction spectra for aliquots taken from the reaction medium at different overgrowth times. After two hours a weak peak centered at 554 nm (black curve in Fig. 2) was found. The peak can be related to the surface plasmon resonance (SPR) of gold.22,23 This became more pronounced after 18 hours with a peak position at 546 nm (orange curve in Fig. 2). The maximum wavelength of the SPR band slightly blue-shifted (inset in Fig. 2) with increasing reaction time. The blue shift was also observed under similar synthesis procedures,22 with the authors attributing the blue-shift to charge transfer from Pt to Au. Additionally, a red-shift in the SPR band is to be expected when larger Au domains are allowed to grow on the seed.22 However, as revealed by previous TEM analyses,19 no significant increase in the size of the overgrown Au domain was observed for the cubeoctahedral sample after reaction periods longer than 48 hours.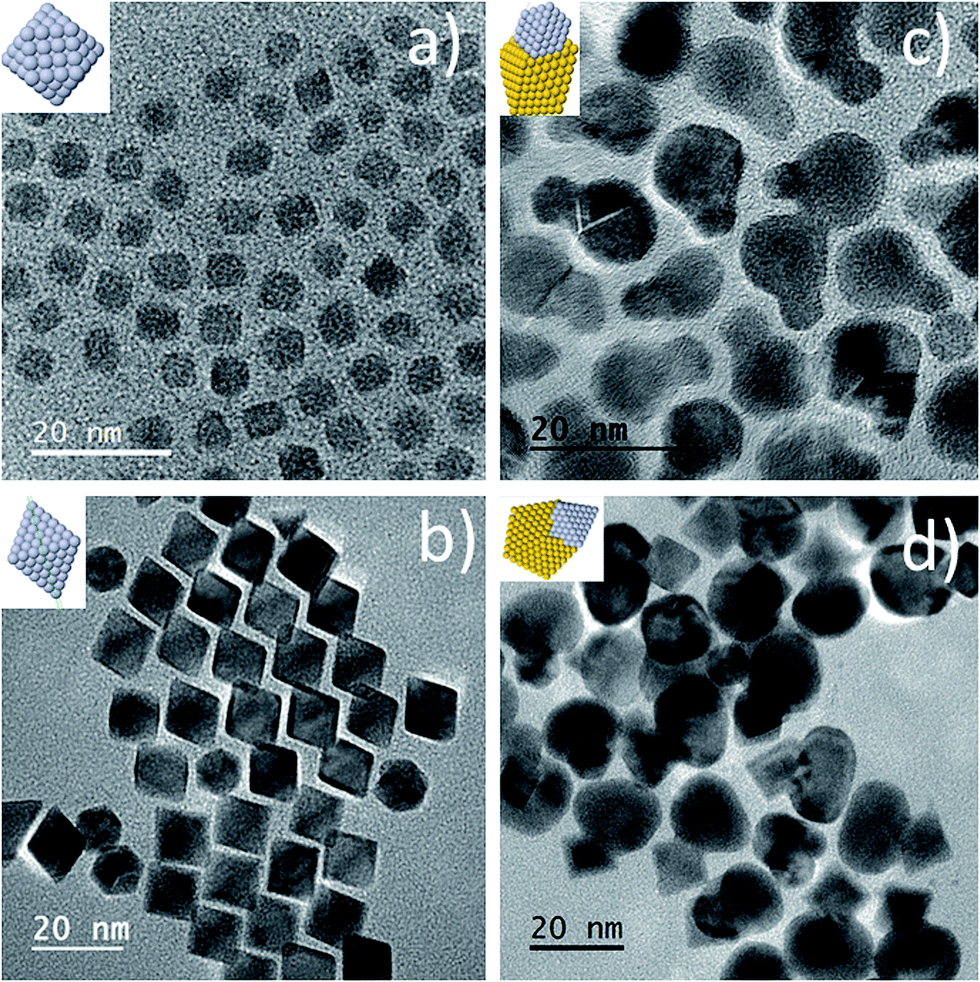 | ||
| Fig. 1 Representative TEM images of (a) Pt cubeoctahedra, (b) Pt octahedra, (c) cubeoctahedrally-derived HDs and (d) octahedrally-derived HDs. | ||
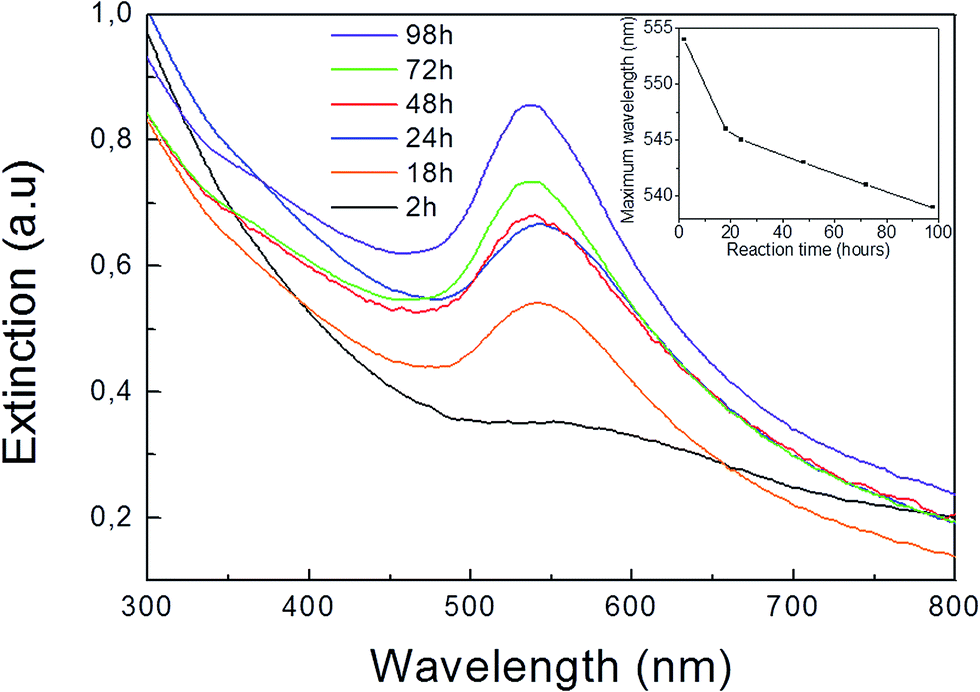 | ||
| Fig. 2 UV-Vis extinction spectra of a sample taken from the reaction between HAuCl4·3H2O and preformed Pt cubeoctahedra at different reaction times. Inset: plot of maximum wavelength of the SPR band vs. reaction time. | ||
Considering the above, we tried to identify the key structural changes attached to heterodimer formation at overgrowth periods of less than 48 h. HAADF-STEM analyses of a sample taken from the reaction medium at 2 h revealed some interesting insights. Firstly, less abundantly occurring bigger particles (approx. 20 nm) were found in the sample, as shown in the HAADF-STEM image in Fig. 3a. Further EDX analyses (ESI, Fig. S1†) allowed us to identify Au as the main component of these bigger particles, while Pt was the dominant metal detected in the large number of smaller particles present. Thus, the weak SPR signal observed at the initial stages of the reaction can be attributed to the presence of a small number of larger Au particles. Secondly, some Pt particles had started to develop an overgrown island-type domain (Fig. 3a–c and S1 from ESI†). This observation can be understood in terms of the Stranski–Krastanov growth model (Fig. 3d). According to this, the overgrowth phase forms a 2D layer on the substrate if its thickness (t) is smaller than the critical thickness (tc). Under such conditions the overgrowth phase is strained in order that it coherently adopts the crystal lattice of the substrate (pseudomorphism), allowing minimization of lattice mismatch and interface energy.20,24 However, if t exceeds tc, the strain energy in the overgrown layer increases so that a transition from the pseudomorphic 2D layer to a 3D island of overgrowth phase can be expected.20 Excess strain must be released in order to support 3D overgrowth,25–27 and an efficient mechanism through which to release this strain is the formation of dislocations (see below). Structural evidence for strain release mechanisms operating in Au–Pt HDs are shown in the next sections and are based on XRD and aberration-corrected STEM analyses.
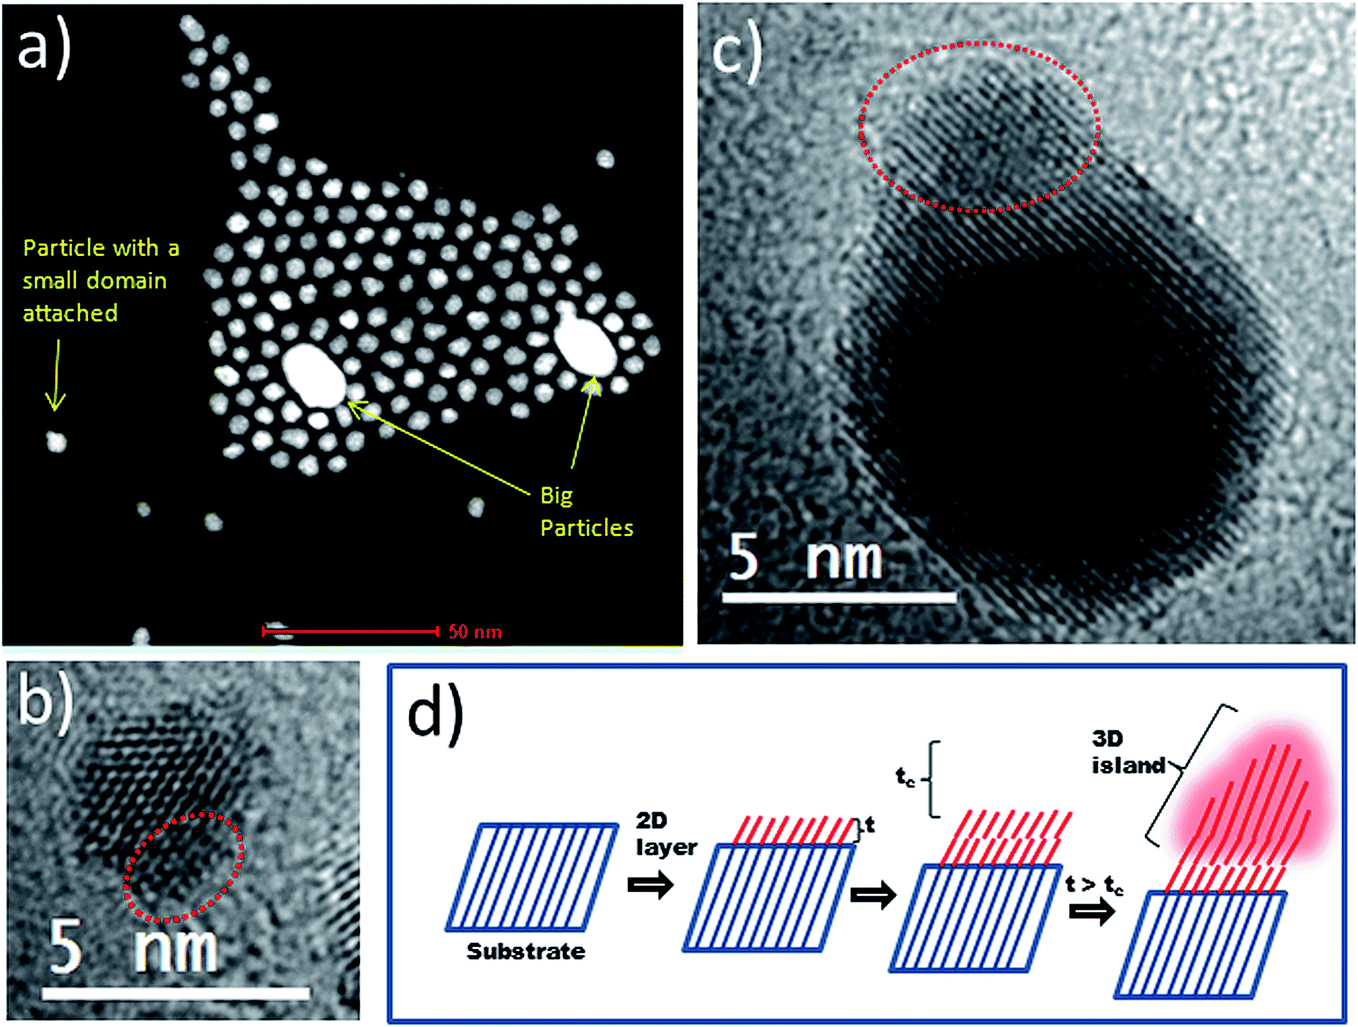 | ||
| Fig. 3 (a) HAADF-STEM image and (b) HRTEM image of a sample taken after two hours from the room temperature reaction between HAuCl4·3H2O and preformed Pt cubeoctahedra. (c) HRTEM image of a sample taken after two hours from the reaction between HAuCl4·3H2O and preformed Pt octahedra at 60 °C. Areas marked as red insets in TEM images highlight the presence of an island-type overgrowth domain. (d) Schematic illustration of Stranski–Krastanov type growth where a 2D layer of a material is deposited on a substrate having a slightly different lattice parameter, with subsequent evolution of the 2D layer giving a 3D island at a thickness (t) above the critical one (tc). | ||
XRD analysis
Fig. 4 displays the XRD patterns of Pt seeds and Au–Pt HDs. XRD patterns of Pt seeds (plots a and c) were ascribed to cubic phase Pt (ICSD card. 01-087-0646). Peaks attributable to the main crystalline planes, such as {111}, {200}, {220} or {311}, were clearly distinguishable. On the other hand, for HD samples (plots b and d), two series of well-resolved Bragg reflections were found, which were ascribed to cubic phase Pt (ICSD card. 01-087-0646) and Au (ICSD card. 00-001-1172) respectively. The nicely resolved separations between peaks also evidenced the spacing mismatch between Au and Pt, which followed the order (111) < (200) < (220) < (311). Although trace amounts of Co and Mn were used in the synthesis of cubeoctahedral and octahedral Pt seeds respectively, XRD analysis did not reveal the presence of crystalline phases associated with Co or Mn species. Further analyses were performed to confirm whether 3d-transition metals were present or not in the nanocrystals, and these will be discussed in more detail in the following section.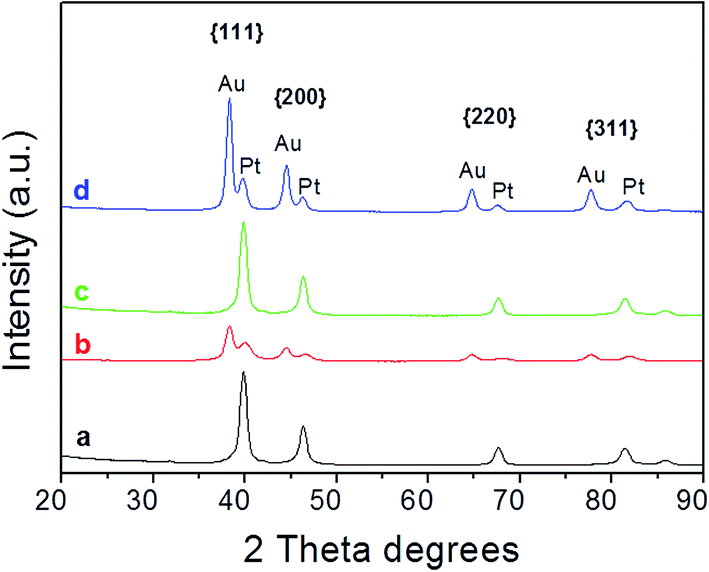 | ||
| Fig. 4 X-ray diffraction patterns of (a) Pt cubeoctahedra, (b) cubeoctahedrally-derived HDs, (c) Pt octahedra and (d) octahedrally-derived HDs. | ||
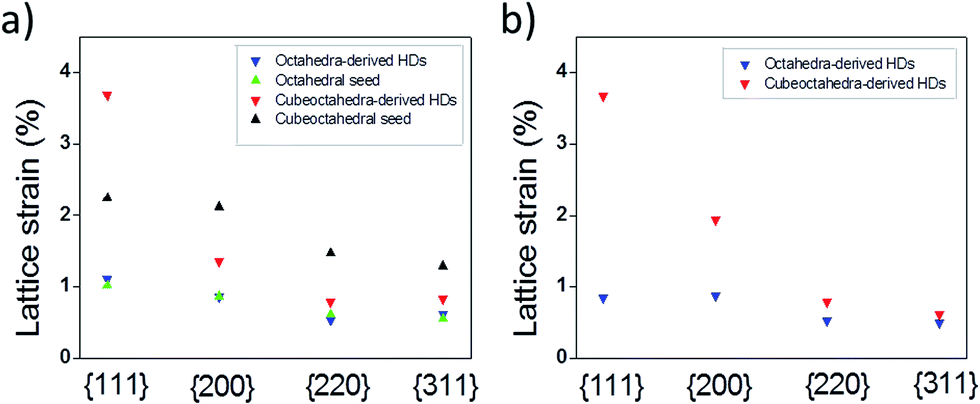
XRD data have allowed us to determine the bulk strain of nanocrystals by using the Hall–Williamson method. In this, the integral breadth of the diffraction peak is determined28,29 and related to broadening effects resulting from crystallite size and lattice strain via the mathematical procedures shown in the ESI (eqn 1 to 5†). Fig. 5a shows the lattice strain estimations for the Pt phase in HD and seed samples. It was found that some strain exists in the Pt seeds. The origin of this strain can be related to the inequivalence in coordination number of atoms found in nanosized metal particles; as the proportion of atoms with low coordination numbers increases as the particle size decreases is not surprising that octahedral seeds (green plot) show around 1% strain while cubeoctahedral seeds (black plot), with their lower particle sizes, exhibit greater strain. However, in the bi-metal system, as Au has a larger lattice constant than Pt, the latter metal can be subjected to tensile strain while Au would be under compression. As shown in Fig. 5a the Pt phases for octahedral samples show almost the same strain status. In other words, octahedra-derived HDs do not accumulate the expected tensile strain. In order to avoid lattice strain accumulation, the formation of dislocations is necessary (see below). On the other hand, a comparison of lattice strain results for cubeoctahedra-derived HDs (red plot) and cubeoctahedral seeds (black plot) revealed two interesting features. Firstly, a lattice strain accumulation at {111} planes. Secondly, a lattice relaxation effect; acting on the other crystalline planes, such as {200}, {220} and {311}. This leads us to conclude that cubeoctahedra-derived HDs can release the expected tensile strain through the formation of lattice distortions on (111) planes.
 | ||
| Fig. 5 Estimated bulk lattice strain for different crystallographic planes of Pt nanocrystals and their corresponding HDs. (a) Pt phases and (b) Au phases. | ||
Fig. 5b shows the lattice strain estimations for the Au phases of HD samples. Lattice strain values are clearly quite similar to those obtained for the Pt lattice in either HD sample. However, minor strain accumulates at the (200) planes for cubeoctahedra-derived HDs while a small relaxation effect is in evidence at the (111) planes for octahedra-derived ones. Considering the island sizes grown on cubeoctahedral and octahedral seeds as being small and large respectively, (Fig. 1c and d), it can be assumed that the compressive strain relief mechanism follows the trend reported30 for metal islands grown on flat substrate. According to this, for small island sizes the compressive strain can be relieved efficiently at the island edges through outward relaxation. However, at larger island sizes the accumulated strain is too large and dislocations form.30 The authors also found that the transition from pseudomorphism to dislocation emergence occurs gradually at island diameters of around 20 nm.30
Direct visualization of defects in HDs
To analyze the emergence of dislocations in HDs with large island sizes, we performed aberration-corrected STEM imaging. As shown in Fig. 6a, the representative HAADF-STEM image for octahedral-derived HDs reveals the conjunction of two nanodomains, where the uppermost domain exhibits the shape previously observed (Fig. 1b) for octahedral Pt seeds. Selected areas marked as insets in Fig. 6a (red and blue) in the HAADF-STEM image were used to obtain digital diffraction patterns, Fig. 6b and c, which were ascribed to cubic phase Pt and cubic phase Au respectively (for EDX mapping showing the element distribution in each domain of this structure type to be well defined and not due to alloying, see below). | ||
| Fig. 6 Structural characterization of Au–Pt HDs grown from 11.2 nm Pt seeds: (a) HAADF-STEM image. (b) and (c) Digital diffraction patterns from selected areas marked in the HAADF-STEM image. (d) A magnified HAADF-STEM image incorporating the bi-metal interface. (f) HAADF-STEM image after Fourier-filtered analysis using (111) reflections along with (g) a magnified area of the same. | ||
Fig. 6d shows a magnified image of the area within the black inset in Fig. 6a which is related to the bi-metal interface. The three-atom layer between the dotted white lines in Fig. 6d seems to sustain a good pseudomorphic relationship; it being known that a pseudomorphic shell of atoms forms during Stranski–Krastanov growth. In this growth regime, as the 2D layer thickness increases beyond the critical one, the strain energy in the overgrown layer increases and induces a transition from the pseudomorphic 2D layer to a 3D island of the overgrowth phase.20 However, the excess of strain that results must be released. As shown in Fig. 6e, Fourier-filtered analysis using the (11![[1 with combining macron]](https://www.rsc.org/images/entities/char_0031_0304.gif) ) reflection from the HAADF image allowed the identification of two misfit dislocations (marked by inverted “T” shapes). In the magnified area of the same image (Fig. 6f), one extra plane terminating at each dislocation is evidenced clearly. Therefore, the formation of misfit dislocations appears to represent an efficient way by which to release the interface mismatch strain in octahedrally-derived HDs. To the best of our knowledge, the presence of line defects for Au–Pt HDs has not previously been reported.
) reflection from the HAADF image allowed the identification of two misfit dislocations (marked by inverted “T” shapes). In the magnified area of the same image (Fig. 6f), one extra plane terminating at each dislocation is evidenced clearly. Therefore, the formation of misfit dislocations appears to represent an efficient way by which to release the interface mismatch strain in octahedrally-derived HDs. To the best of our knowledge, the presence of line defects for Au–Pt HDs has not previously been reported.
Nanoscale chemical mapping of HDs
Understanding the compositional nature of Au–Pt HDs is important for different reasons. First, the production of shape-defined Pt seeds normally requires the addition of large21,31 or trace32 amounts of a 3d-transition metal (M) such as Fe or Co. This vexes the question, if any M is present within the HD, where would it be localized? Moreover, it was previously proposed that M could have a major role in the mechanism by which Au–Pt HDs form,33 and so a further question arises. Is the presence of M strictly necessary for the formation of Au–Pt HDs? In order to answer the aforementioned questions we performed EDX mapping of HD samples by probe-corrected STEM analysis. The results obtained are shown in Fig. 7. The resulting maps clearly reveal the presence of two distinct metallic domains in each HD type. These are mainly composed of gold and platinum respectively. For the cubeoctahedrally-derived sample (Fig. 7a), clear Co signals were found and correlated with the Pt domain of the dimer. However, Mn was not detected in the corresponding octahedrally-derived HD sample (Fig. 7b). These results agree well with repeated EDX analyses on the octahedral seeds themselves, where the vast majority of attempts to detect Mn failed. In fact, only one EDX map from more than ten analyses performed on octahedral Pt seeds presented any observable Mn content (ESI, Fig. S2†). In contrast, EDX maps for Co-containing cubeoctahedral Pt seeds repeatedly revealed traces of the 3d metal (ESI, Fig. S3† shows a representative analysis). Taken together, these observations suggest that M does not play a major role in the mechanism by which Au–Pt HDs form. Rather, lattice strain (and the methods that exist for alleviating it) appears to have a dominant role, and this can be correlated with an Island-type growth mechanism.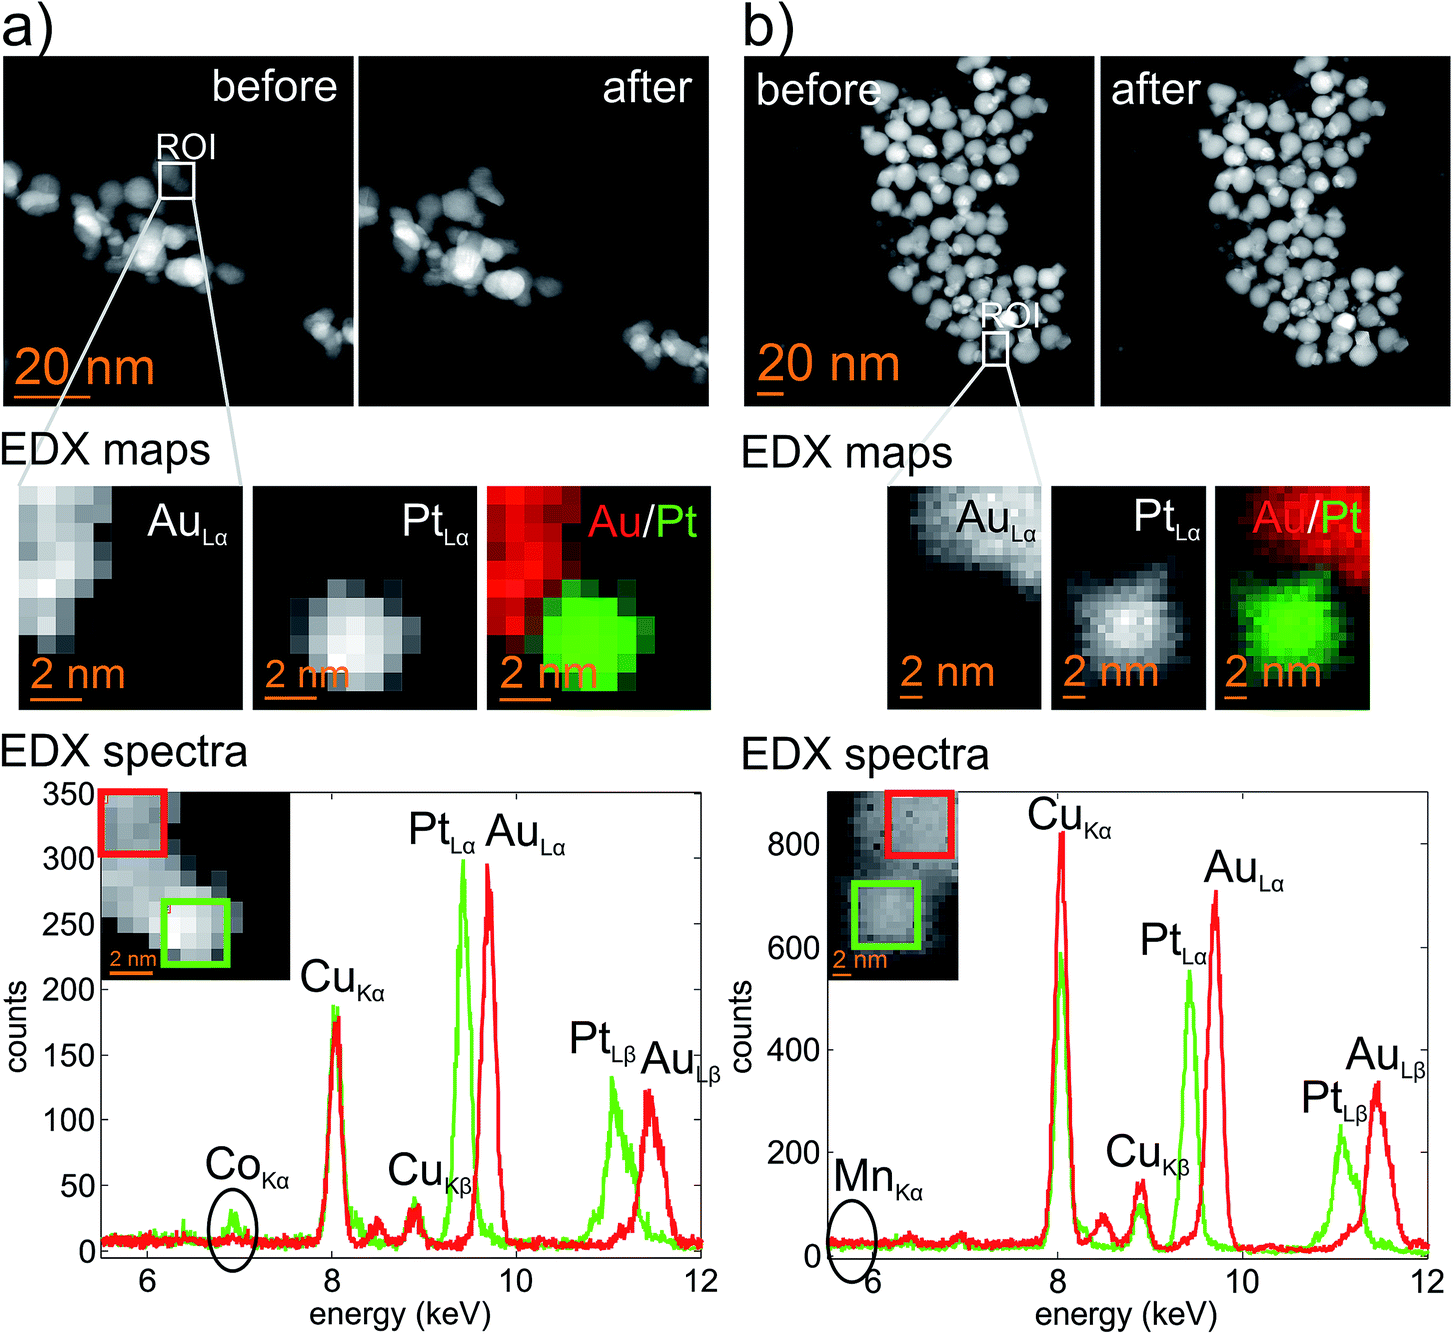 | ||
| Fig. 7 HAADF images before and after STEM-EDX analysis (top) combined with EDX elemental maps (middle) and EDX spectra (bottom) for cubeoctahedrally-derived HDs (a) and octahedrally-derived HDs (b). The elemental maps of Au and Pt are taken from the regions as marked in the HAADF images, while the spectra are extracted from the regions shown in the inset of the EDX spectra. | ||
Overall, it is interesting to note that the Pt distribution for each HD type retains the shape observed for the original Pt nanocrystals (Fig. 1a and b) while the corresponding Au distribution is well segregated and is contained within the overgrowth region. Thus, elemental analysis suggests that Au–Pt alloying is unlikely under the mild temperature conditions employed in this work. Moreover, recent studies based on extended X-ray absorption fine structure showed that neither Au–Pt nor Au–Co alloy phases form under similar synthetic conditions.20
Conclusions
The experimental observation of lattice strain effects and dislocation emergence here represent experimental evidence that substantiates the relevance of the Stranski–Krastanov mechanism to the growth of Au on Pt nanocrystals. For Au–Pt HDs grown from 4.7 nm seeds, bulk lattice strain accumulation at {111} planes along with lattice relaxation effects on other crystalline planes such as {200}, {220} and {311} provided a way to release the tensile strain, while strain accumulation on (200) planes of the island formed proved effective in releasing compressive strain. However, for Au–Pt HDs grown from 11.2 nm seeds, a highly efficient mechanism by which to release interface mismatch strain proved to be the formation of misfit dislocations. Taken together, these results contribute significantly to a better understanding of Au–Pt heterostructures and their formation and this, in turn, promises to help in the rational design of fuel cell catalysts and multifunctional devices.Acknowledgements
This work has received funding from the European Union within the 7th Framework Programme under Project Al-NanoFunc CT-REGPOT-2011-1-285895 and Grant Agreement no. 312483 (ESTEEM2). We acknowledge financial support from the CSIC (PIE 201460E018), the Spanish Ministry MINECO (project CTQ2012-32519), Junta de Andalucía (FEDER PE2009-FQM-4554, TEP217 and PE2012-TEP-862) and the Graz Centre for Electron Microscopy (ZFE Graz). Thanks go also to the UK Engineering and Physical Sciences Research Council for a studentship for B. R. Knappett (EP/J500380/1).Notes and references
- S. E. Habas, H. Lee, V. Radmilovic, G. A. Somorjai and P. Yang, Nat. Mater., 2007, 6, 692–697 CrossRef CAS PubMed.
- C. Wang, W. Tian, Y. Ding, Y. Q. Ma, Z. L. Wang, N. M. Markovic, V. R. Stamenkovic, H. Daimon and S. Sun, J. Am. Chem. Soc., 2010, 132, 6524–6529 CrossRef CAS PubMed.
- Y. Lee, M. A. García, N. A. F. Hull and S. Sun, Angew. Chem., Int. Ed., 2010, 49, 1271–1274 CrossRef CAS PubMed.
- H. Yu, M. Chen, P. Rice, S. Wang, R. L. White and S. Sun, Nano Lett., 2005, 5, 379–382 CrossRef CAS PubMed.
- C. Xu, B. Wang and S. Sun, J. Am. Chem. Soc., 2009, 131, 4216–4217 CrossRef CAS PubMed.
- T. Pellegrino, A. Fiore, E. Carlino, C. Giannini, P. D. Cozzoli, G. Ciccarella, M. Respaud, L. Palmirotta, R. Cingolani and L. Manna, J. Am. Chem. Soc., 2006, 128, 6690–6698 CrossRef CAS PubMed.
- J. Jiang, H. Gu, H. Shao, E. Devlin, G. C. Papaefthymiou and J. Y. Ying, Adv. Mater., 2008, 20, 4403–4407 CrossRef CAS.
- M. R. Buck, J. F. Bondi and R. E. Schaak, Nat. Chem., 2012, 4, 37–44 CrossRef CAS PubMed.
- X. Ye, D. R. Hickey, J. Fei, B. T. Diroll, T. Paik, J. Chen and C. B. Murray, J. Am. Chem. Soc., 2014, 136, 5106–5115 CrossRef CAS PubMed.
- C. Wang, Y. Wei, H. Jiang and S. Sun, Nano Lett., 2009, 9, 4544–4547 CrossRef CAS PubMed.
- N. Bhattarai, G. Casillas, A. Ponce and M. Jose-Yacaman, Surf. Sci., 2013, 609, 161–166 CrossRef CAS PubMed.
- J. Wu, L. Qi, H. You, A. Gross, J. Li and H. Yang, J. Am. Chem. Soc., 2012, 134, 11880–11883 CrossRef CAS PubMed.
- P. Strasser, S. Koh, T. Anniyev, J. Greeley, K. More, C. Yu, Z. Liu, S. Kaya, D. Nordlund, H. Ogasawara, M. F. Toney and A. Nilsson, Nat. Chem., 2010, 2, 454–460 CrossRef CAS PubMed.
- K. Chun-Hong, L. K. Lamontagne, C. N. Brodsky, C. Lien-Yang, J. Zhuang, B. T. Sneed, M. K. Sheehan and T. Chia-Kuang, ChemSusChem, 2013, 6, 1993–2000 CrossRef PubMed.
- A. Smith, A. M. Mohs and S. Nie, Nat. Nanotechnol., 2009, 4, 56–63 CrossRef CAS PubMed.
- S. Zhou, K. Mcllwrath, G. Jackson and B. Eichhorn, J. Am. Chem. Soc., 2006, 128, 1780–1781 CrossRef CAS PubMed.
- Z. Peng and H. Yang, Nano Res., 2009, 2, 406–415 CrossRef CAS.
- J. Zhu, J. Wu, F. Liu, R. Xing, C. Zhang, C. Yang, H. Yin and Y. Hou, Nanoscale, 2013, 5, 9141–9149 RSC.
- C. A. García-Negrete, T. C. Rojas, B. R. Knappett, D. A. Jefferson, A. E. H. Wheatley and A. Fernández, Nanoscale, 2014, 6, 11090–11097 RSC.
- S. G. Kwon, G. Krylova, P. J. Phillips, R. F. Klie, S. Chattopadhyay, T. Shibata, E. E. Bunel, Y. Liu, V. B. Prakapenka, B. Lee and E. V. Shevchenco, Nat. Mater., 2015, 14, 215–223 CrossRef CAS PubMed.
- Y. Kang, J. B. Pyo, X. Ye, R. E. Diaz, T. R. Gordon, E. A. Stach and C. B. Murray, ACS Nano, 2012, 7, 645–653 CrossRef PubMed.
- S. I. Lim, M. Varon, I. Ojea-Jimenez, J. Arbiol and V. Puntes, J. Mater. Chem., 2011, 21, 11518–11523 RSC.
- W. Shi, H. Zeng, Y. Sahoo, T. Y. Ohulchanskyy, Y. Ding, Z. L. Wang, M. Swihart and P. N. Prasad, Nano Lett., 2006, 6, 875–881 CrossRef CAS PubMed.
- J. W. Mathew and A. E. Blakeslee, J. Cryst. Growth, 1974, 27, 118–125 Search PubMed.
- Y. Ding, X. Sun, Z. L. Wang and S. Sun, Appl. Phys. Lett., 2012, 100, 111603 CrossRef.
- T. K. Saw, A. L. Rogach, F. Jackel, T. A. Klar and J. Feldman, Adv. Mater., 2010, 22, 1805–1825 CrossRef PubMed.
- F. Feng-Ru, L. De-Yu, W. Yuan-Fei, D. Sai, X. Zhao-Xiong, J. Zhi-Yuan and T. Zhong-Qun, J. Am. Chem. Soc., 2008, 130, 6949–6951 CrossRef PubMed.
- E. Puroshotam and N. G. Krishna, Bull. Mater. Sci., 2013, 36(6), 973–976 CrossRef.
- B. R. Rehani, P. B. Joshi, K. N. Lad and A. Pratap, Indian J. Pure Appl. Phys., 2006, 44, 157–161 CAS.
- K. Bromann, H. Brune, M. Giovannini and K. Kern, Surf. Sci., 1997, 388, L1107–L1114 CrossRef CAS.
- C. Wang, H. Daimon, Y. Lee, J. Kim and S. Sun, J. Am. Chem. Soc., 2007, 129, 6974–6975 CrossRef CAS PubMed.
- S. I. Lim, I. O. Jiménez, M. Varon, E. Casals, J. Arbiol and V. Puntes, Nano Lett., 2010, 10, 964–973 CrossRef CAS PubMed.
- G. Krylova, L. J. Giovanetti, F. G. Requejo, N. M. Dimitrijevic, A. Prakapenka and E. V. Shevchenko, J. Am. Chem. Soc., 2012, 134, 4384–4392 CrossRef CAS PubMed.
Footnote |
| † Electronic supplementary information (ESI) available: Further characterization data. See DOI: 10.1039/c5ra09808d |
| This journal is © The Royal Society of Chemistry 2015 |