Hydrothermal synthesis of bimodal mesoporous MoS2 nanosheets and their hydrodeoxygenation properties

Weiyan Wang*ab, Lu Lia, Kui Wua, Guohua Zhua, Song Tana, Wensong Lia and Yunquan Yang*ab
aSchool of Chemical Engineering, Xiangtan University, Xiangtan, Hunan 411105, P. R. China
bNational & Local United Engineering Research Center for Chemical Process Simulation and Intensification, Xiangtan University, Xiangtan 411105, P. R. China. E-mail: wangweiyan@xtu.edu.cn; yangyunquan@xtu.edu.cn

Received 23rd May 2015 , Accepted 8th July 2015

First published on 8th July 2015


Abstract

In this study, bimodal mesoporous MoS2 nanosheets were successfully synthesized by a hydrothermal method. The effect of pH value, pressure, time and temperature in the preparation process of MoS2 on its structure property and catalytic activity were studied in detail. Low pH value and pressure were beneficial for the preparation of a MoS2 nanosheet with a large surface area and narrow bimodal pore distribution, which exposed more effective active sites on the surface and provided suitable space for reactants and products to diffuse in less resistance. But the acceleration hydrolysis of CS(NH2)2 at the low pH value enhanced the formation rate of MoS2 and then weakened the nanosheet structure. In the HDO of p-cresol, MoS2 exhibited high catalytic activity, and the dominant route was direct deoxygenation. After 4 h, both the conversion and deoxygenation degree reached 99.9% at 300 °C, and toluene selectivity was 66.2%. The HDO reaction mechanism could be well explained by the Rim-Edge model. The higher conversion in the HDO of p-cresol on MoS2 depended on the larger surface area and greater number of big pores of the catalyst, while the higher direct deoxygenation activity of MoS2 depended on the greater number of layers in its stacks.

1. Introduction

Up to now, fossil fuels are still the major energy resource in our society. Unfortunately, their reserve was declining and their utilizations produced much greenhouse gas and other poisonous gases, resulting in some serious environmental pollution problems, which stimulated us to explore renewable resources.1 Bio-oil, derived from the fast pyrolysis of biomass under the conditions of isolated no oxygen and high temperature, has been considered as an ideal renewable substituted energy to reduce reliance on limited fossil fuels, because of its carbon neutrality, enormous potential to deliver many forms of energy and numbers of organic chemicals.2 However, the liquid fuel from lignin consisted of many oxygen-containing compounds such as phenols, alcohols and ketones, leading to the low heating value, high corrosiveness and immiscibility with petroleum fuels. Consequently, this liquid fuel was difficult to use directly as a supplement or replacement for gasoline or fossil diesel.3 To address this problem, hydrodeoxygenation (HDO) was a propitious technology to be adopted to remove the oxygen from bio-oil.

In the past decade, much effort has been devoted to the preparation of a high HDO activity catalyst.4–8 Several kinds of HDO catalysts have appeared, including sulphides,7,9–11 noble metals,12–14 non-noble metals,15–17 phosphides,18,19 borides,20,21 carbides22 and ionic liquids.23 Unfortunately, these catalysts had some disadvantages such as high cost, low activity or instability, which needed to be further improved. Sulphides were widely studied in hydrodesulfurization (HDS) reactions and exhibited high catalytic activity. Because of the similarity of HDS and HDO, sulphides were also employed for HDO reactions. However, the HDO activity of sulphides was closely related to its preparation method. For example, K. J. Smith et al.24 compared the commercial MoS2 with exfoliated MoS2 and MoS2 prepared by in situ decomposition of ammonium heptamolybdate or molybdenum naphthenate on the catalytic activity in the HDO of phenols and found that their activity changed with its preparation method. C. Wang et al.25 prepared Ni–Mo–W–S trimetallic sulfide catalysts by a mechanical activation method and obtained a conversion of 97.8% in the HDO of p-cresol over these catalysts at 300 °C for 5 h. B. Yoosuk et al.26 had prepared amorphous MoS2 from ammonium tetrathiomolybdate by the hydrothermal method and reported that the conversion in the HDO of phenol on the prepared MoS2 was 71% at 350 °C for 1 h. Recently, we had also adopted a hydrothermal method to prepare MoS2 using ammonium heptamolybdate and thiourea as raw materials, and verified that adding surfactant during its preparation had a positive influence on its surface area and HDO activity.27

Although an MoS2 catalyst with high surface area has been prepared by a hydrothermal method, its pore size distribution was very broad and displays a lot of small pores, which reduced its catalytic activity.26 The bimodal pore structure had been found to be a key feature in hydrotreating processes, where the smaller pores provided the high surface area to expose more active sites while the larger pores provided a suitable space to decrease the mass transfer resistance for bulky reactants and product molecules.28–30 Thus, a facile synthesis route for bimodal mesoporous MoS2 was very interesting. Inspired by the synthesis of MoS2 by a hydrothermal method,31–33 we changed the reaction conditions and successfully prepared bimodal mesoporous MoS2 nanosheets in this study. We concentrated on the effect of the preparation conditions such as pH value, reaction time and temperature on the structure of MoS2 and their catalytic activity in the HDO of p-cresol.

2. Experimental section

2.1 Catalyst preparation

All solvents and reagents were obtained from Sinopharm Chemical Reagent Co., Ltd in high purity (≥99%) and used without further purification. MoS2 catalysts were prepared by a hydrothermal method. The catalyst synthesis was carried out in a quartz reactor with a volume of 300 mL. Ammonium heptamolybdate (2.3 g) and thiourea (3.0 g) were dissolved in water and hydrochloric acid was added to adjust its pH value. Then, this mixed solution was added into the sealed reactor and heated for different amounts of time. After reaction, the resultant catalysts were separated and washed with water and ethanol several times. Finally, the resulting product was dried under vacuum at 60 °C for 8 hours and stored in a nitrogen environment. The corresponding names of the samples prepared under different conditions are listed in Table 1.
Table 1 Corresponding names of the samples prepared under different conditions
Samples Time (h) pH Pres. (MPa) Temp. (°C)
Mo-S-1 12 1.4 2.3 200
Mo-S-2 12 0.9 2.3 200
Mo-S-3 12 0.7 2.3 200
Mo-S-4 12 1.4 1.5 200
Mo-S-5 12 0.9 1.5 200
Mo-S-6 12 0.7 1.5 200
Mo-S-7 12 0.9 3.5 240
Mo-S-8 24 0.9 3.5 240
Mo-S-9 36 0.9 3.5 240


2.2 Catalyst characterization

X-ray diffraction (XRD) measurements were carried on a D/max 2550 18 kW rotating anode X-ray diffractometer with monochromatic Cu Kα radiation (λ = 1.5418 Å) radiation at voltage and current of 40 kV and 300 mA. The 2θ was scanned over the range of 5–90° at a rate of 10° min−1. The specific surface area was measured by a Quantachrome’s NOVA-2100e Surface Area instrument by physisorption of nitrogen at −196 °C. The samples were dehydrated at 300 °C using vacuum degassing for 12 h before determination. The scanning electronic microscopy (SEM) images of the catalysts were obtained on a JEOL JSM-6360 electron microscope. The micro-morphology of the prepared catalyst was measured by high resolution transmission electron microscopy (HRTEM) on a JEOL JEM-2100 transmission electron microscope with a lattice resolution of 0.19 nm and an accelerating voltage of 200 kV. The samples for the HRTEM study were prepared by ultrasonic dispersion in ethanol and subsequent deposition of the suspension on a “holey” carbon film supported on a copper grid. The samples were kept under inert atmosphere until the final process.

2.3 Catalyst activity measurement

The HDO activity tests were carried out in a 300 mL sealed autoclave. The prepared catalyst without any further treatment (0.60 g), p-cresol (13.50 g) and dodecane (86.20 g) were placed into the autoclave. Air in the autoclave was evacuated by pressurization–depressurization cycles with nitrogen and subsequently with hydrogen. The system was heated to 300 °C, then pressurized with hydrogen to 4.0 MPa and the stirring speed adjusted to 900 rpm. During the reaction, liquid samples were withdrawn from the reactor and analyzed by Agilent 6890/5973N GC-MS and 7890 gas chromatography using a flame ionization detector (FID) with a 30 m AT-5 capillary column. To separate the reaction products, the temperature in the GC oven was heated from 40 °C to 85 °C with a ramp of 20 °C min−1, held at 85 °C for 4.0 min, then heated to 200 °C at a rate of 20 °C min−1 and kept at 200 °C for 5.0 min. Internal standards (i.e., octane for methylcyclohexane, toluene and decane for p-cresol) were used to determine the product distribution and carbon balance. These experiments have been repeated twice at least and the results showed that the conversion and selectivity were within 3.0% of the average values. HYD/DDO is defined as (total selectivity of methylcyclohexane and 3-methylcyclohexene)/the selectivity of toluene; deoxygenation degree (D. D., wt%) is defined as [1-oxygen content in the final organic compounds/total oxygen content in the initial material] × 100%. Carbon balance is better than 96 ± 3% in this work.

3. Results and discussion

3.1 Synthesis of MoS2

G. R. Helz et al.34 found that the pH value significantly increased over the course of the reactions, owing to H2S consumption, and the step of formation of MoS3 was so slow that very little MoS3 was produced without acid catalysis. E. H. Lester et al.35 also reported that it is necessary to add acid to provide an acidic environment to produce MoS3. Y. Piao et al.31 also verified that the H+ ions from the hydrochloric acid play a catalytic role in the formation of MoS2 during the hydrothermal process. Consequently, according to the above previous reports31,34,35 and the experimental conditions for the preparation of MoS2 in this study, the formation of MoS2 involved a complex process and included four steps: (1) the hydrolysis of CS(NH2)2, (2) the formation of MoOxS4−x, (3) the formation of MoS3 and (4) the thermal decomposition of MoS3 to form MoS2. The reaction process for the synthesis of MoS2 was expressed as follows:
 
CS(NH2)2 + H2O → NH3 + CO2 + H2S (1)
 
(NH4)6Mo7O24 + H2S → MoOxS4−x + NH3 + H2O (2)
 
MoOxS4−x + H+ → MoS3 + H2O (3)
 
image file: c5ra09690a-t1.tif(4)

The overall reactions could be expressed as (5):

 
(NH4)6Mo7O24 + CS(NH2)2 + H+ + H2O → MoS2 + CO2 + NH3 (5)

3.2 Catalyst characterization

The crystal structure and phase purity of MoS2 catalysts prepared under different pressures and pH value are characterized by XRD. As shown in Fig. 1, the catalysts prepared under the same pH value but different pressure presented similar XRD patterns, indicating that the pressure had little effect on the crystal structure. All of the catalysts displayed some peaks at 2θ = 14°, 33°, 36° and 59°, matching well with the reflection peaks for the (002), (100), (103) and (110) planes of hexagonal structure of MoS2 (JCPDS card no. 37-1492).36,37 It is noteworthy that the (002) peak of these catalysts significantly broadened and its intensity decreased with pH value, suggesting its small crystallite size and a small number of layers in the direction of the z-axis perpendicular to the atomic layers, but the reaction pressure had little effect on the intensity of the peak at 2θ = 14°. Mo-S-1 and Mo-S-4 showed some diffraction peaks at 2θ = 20°, 27°, 43° and 55°, corresponding to MoO3,38 which meant that Mo was not completely converted into MoS2 under conditions of 200 °C, pH 1.4 and 12 h. When the pH value decreased to 0.9, no MoO3 was detected in the catalyst by XRD characterization. In addition, Mo-S-1, Mo-S-2, Mo-S-3 and Mo-S-4 showed a weak diffraction peak at 2θ = 9°. This peak was related to the diffraction of adjacent few-layered MoS2 sheets39 and the strong intensity of this peak in the XRD patterns of Mo-S-1 and Mo-S-4 might be resulted from the high pH value.
image file: c5ra09690a-f1.tif
Fig. 1 XRD patterns of MoS2 prepared under different pressures and pH values.

The specific surface area and pore size distribution of MoS2 catalysts were measured using the Brunauer–Emmett–Teller (BET) and Barrett–Joyner–Halenda (BJH) methods, respectively, as shown in Fig. 2 and S1 (ESI). The samples prepared at different pressures (2.3 MPa and 1.5 MPa) almost showed the same change trend on N2 adsorption–desorption isotherm and pore size distribution. According to the IUPAC classification,40 these three catalysts exhibited a type IV isotherm, characterizing a typical mesoporous material.41,42 The pore size distribution of Mo-S-5 and Mo-S-6 revealed these two catalysts possessed two kinds of mesoporous size, but the bimodal mesoporous peak for Mo-S-4 was not very obvious. Mo-S-6 showed a narrower pore size distribution than Mo-S-5. Most pores of Mo-S-6 were in the mesoporous range with two peaks centered at 2.5 nm and 9.1 nm, where the big pores might originate from the gap between the MoS2 particles. This indicated that a low pH value was beneficial to obtain bimodal mesoporous MoS2 with a narrow peak distribution.


image file: c5ra09690a-f2.tif
Fig. 2 Nitrogen adsorption–desorption isotherms (a) and pore size distribution (b) of Mo-S-4, Mo-S-5 and Mo-S-6.

The surface area, pore volume and pore diameter of MoS2 catalysts prepared under different pH values and pressures are listed in Table 2. The specific surface areas were measured to 64.5, 92.5 and 112.0 m2 g−1 for Mo-S-1, Mo-S-2 and Mo-S-3, respectively. This suggested that the specific surface area of MoS2 increased with the decrease in pH value. However, the specific surface areas of Mo-S-4, Mo-S-5 and Mo-S-6 were 97.7, 170.0 and 187.7 m2 g−1, respectively, which was higher than that of the catalyst prepared under 2.3 MPa at the same pH value. This showed that high pressure had a negative effect on the specific surface area of MoS2 due to the acceleration of particle aggregation at high pressure. The effect of pH value and pressure on the pore volume was not obvious. Mo-S-5 presented the highest pore volume (0.8 cm3 g−1). These samples also had micropores (Table 1S, ESI), but the mesopores were much more important than the micropores in terms of mass transfer resistance for p-cresol and product molecules. Moreover, compared with the total pore volume, the micropore volume was much smaller, and could be neglected.

Table 2 Physical properties of MoS2 prepared under different pressures and pH values
Catalysts Surface area (m2 g−1) Pore volume (cm3 g−1) Pore size (nm) Number of layers
Mo-S-1 64.5 0.2 2.3 4.5
Mo-S-2 92.5 0.5 2.4, 12.6 4.9
Mo-S-3 112.0 0.6 2.5, 10.6 5.0
Mo-S-4 97.7 0.4 2.6 4.6
Mo-S-5 170.0 0.8 2.7, 10.7 3.6
Mo-S-6 187.7 0.5 2.5, 9.1 4.1


Fig. 3 shows the morphologies of MoS2 synthesized at different pH values and pressures at 200 °C for 12 h. This MoS2 had a sheet-like shape due to the laminar growth habit of the molybdenum sulfide. Mo-S-1 presented some flower-like particles in the SEM image, which resulted from the retardation of growth along the (00l) direction at high pH values.43 After the pH value decreased, many secondary particles with smaller sizes made up of ultrathin nanosheets were formed and aggregated together, and the nanosheet shape of MoS2 synthesized at lower pH value became not as clear as that of Mo-S-1. This phenomenon could be explained by the following. According to the formation mechanism of MoS2, the acid accelerated the hydrolysis of CS(NH2)2 and the formation of MoOxS4−x and MoS3. Consequently, the formation rate of MoS2 was enhanced in a strong acidic environment, promoting the growth along the (00l) direction, and then weakened the nanosheet structure.


image file: c5ra09690a-f3.tif
Fig. 3 SEM images of MoS2 prepared under different pressures and pH values.

TEM characterization was employed to further study the microstructure of these prepared MoS2 nano-sheets, as shown in Fig. 4. Their TEM images displayed some random groups of parallel dark thread-like fringes with 2–9 layers in the stacks. The interlayer separation between the MoS2 layers was about 0.61 nm, which was consistent with the theoretical spacing for (002) planes of the hexagonal MoS2 structure.31,32 The average layer numbers of MoS2 were statistically analyzed and are listed in Table 2. The average numbers of layers in the stacks of Mo-S-1, Mo-S-2, Mo-S-3, Mo-S-4, Mo-S-5 and Mo-S-6 were 4.5, 4.9, 5.0, 4.6, 3.6 and 4.1, respectively, but there was not any clear regularity for the number of layers with the change in pressure and pH value.


image file: c5ra09690a-f4.tif
Fig. 4 TEM images of MoS2 prepared under different pressures and pH values.

3.3 HDO activity of MoS2 in the HDO of p-cresol

To compare commercial MoS2 (Mo-S-C) with the prepared MoS2 on the catalytic activity, we recorded the change of conversion and product selectivity versus reaction time in the HDO of p-cresol on these two catalysts at 300 °C, as shown in Fig. 5. The oxygen-free products were toluene, methylcyclohexane and 3-methylcyclohexene, and no oxygen-containing compound was detected in the products, showing their high deoxygenation activity. It had reported that the HDO of phenols on sulfides proceeded with two parallel routes, including direct deoxygenation (DDO) and hydrogenation–dehydration (HYD).3,26 Toluene and methylcyclohexane were the final products for these two routes and 3-methylcyclohexene acted as an intermediate in the HYD route. Fig. 5 indicated that both methylcyclohexane and toluene concentrations increased with p-cresol conversion, but toluene concentration was much larger than the total concentration of methylcyclohexane and methylcyclohexane during the whole reaction, suggesting that the DDO was the dominant route in the HDO of p-cresol on a MoS2 catalyst, which agreed well with the previous investigations.25–27 Fig. 5 also obviously showed that Mo-S-1 had a higher HDO activity than Mo-S-C. After reaction at 300 °C for 10 h, the conversion of p-cresol on Mo-S-C was only 29.8% with a deoxygenation degree of 26.7%, but the conversion and deoxygenation degree on Mo-S-1 were 88.1% and 86.4%, respectively, demonstrating the superiority of this method for the preparation of MoS2 catalyst.
image file: c5ra09690a-f5.tif
Fig. 5 The changes of p-cresol conversion and product selectivity versus reaction time on (a) Mo-S-C and (b) Mo-S-1 at 300 °C.

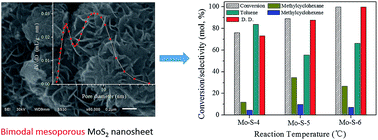
The conversion, product distribution, HYD/DDO and degree of deoxygenation in the HDO of p-cresol on these catalysts prepared at different pH values and pressures at 300 °C for 4 h are listed in Table 3. The results indicated that the preparation conditions of MoS2 had a great influence on its activity. The p-cresol conversion on these catalysts increased in the order of Mo-S-1 (48.3%) < Mo-S-2 (75.5%) < Mo-S-3 (93.5%) and Mo-S-4 (76.1%) < Mo-S-5 (89.1%) < Mo-S-6 (99.9%). Due to the high deoxygenation activity of MoS2, there was no oxygen-containing compound in the products and the deoxygenation degree presented the same change trend as the conversion. That is, both the conversion and deoxygenation degree increased with the pH value but decreased with the pressure in catalyst preparation. For the product distribution, toluene selectivity was the highest. The HYD/DDO value on all these prepared catalysts was lower than 1.0, especially on the catalysts prepared at high pressure, suggesting that the dominant HDO reaction route on these catalysts was DDO and the product distribution changed with the catalyst preparation conditions. Among these six catalysts, Mo-S-6 exhibited the highest HDO activity. Both the conversion and deoxygenation degree in the HDO of p-cresol at 300 °C for 4 h reached to 99.9%.

Table 3 Effects of pH values and pressures in the catalyst preparation on the structure of MoS2 and their catalytic activity in the HDO of p-cresol at 300 °C for 4 h
Catalysts Mo-S-1 Mo-S-2 Mo-S-3 Mo-S-4 Mo-S-5 Mo-S-6
Conversion (mol%) 48.3 75.5 93.5 76.1 89.1 99.9
[thin space (1/6-em)]
Products distribution (mol%)
Methylcyclohexane 11.4 10.7 9.8 11.8 34.7 26.6
3-Methylcyclohexene 6.9 3.8 3.1 4.4 9.8 7.2
Toluene 81.7 85.5 87.1 83.8 55.5 66.2
HYD/DDO 0.22 0.17 0.15 0.19 0.80 0.51
D. D., wt% 44.6 72.6 92.5 73.3 87.7 99.9


As expected, the different conversions on these catalysts were related to their structure properties, which could be explained as follows. Firstly, the N2 physisorption results showed that the surface area increased with the decrease in pH value. The larger surface area of the catalyst contributed more effective active sites for the HDO reaction. Consequently, the conversion on the catalyst with larger surface area was higher. However, according to the results reported by B. Yoosuk,26 the HDO catalytic activities of MoS2 catalysts might not be directly related to its surface area. As shown in Table 3, the conversions on Mo-S-5 and Mo-S-6 were 89.1% and 99.9%, respectively. Here, the surface areas of these two catalysts were very close. But the pore size distribution showed that Mo-S-6 possessed narrower bimodal peaks and more big pores than Mo-S-5. These big pores had appropriate channels, which minimized the mass transfer resistance for p-cresol and product molecules and then enhanced the HDO activity. This similar result had also been reported in a previous study,28 which concluded that the catalyst with a bimodal mesoporous structure presented a the higher HDS activity than the catalyst with a mono-modal structure.

Table 3 shows that the selectivity of toluene produced by the DDO route on Mo-S-4, Mo-S-5 and Mo-S-6 was 83.8%, 55.5% and 66.2%, respectively. But what led to this difference? This mainly depended on its microstructure. The Rim-Edge model, proposed by Daage M. et al.,44 was a generally accepted model to reveal the relation between product distribution and the microstructure of the MoS2 catalyst. In this model, MoS2 was described as stacks of several layers, the top and bottom layers were defined as rim sites and the others were defined as edge sites. Daage M. et al.44 claimed that the direct desulfurization (DDS) reaction proceeded on both the rim and edge sites, while the hydrogenation reaction only occurred on the rim site in the HDS of dibenzothiophene. Associating the average number of layers in the stack of MoS2 in Table 2 with the toluene selectivity in Table 3, HYD/DDO was the lowest on Mo-S-3, with an average layer number of 5.0, but the highest on Mo-S-5 with an average layer number of 3.6. Hence, the larger the average layer number of MoS2, the higher the toluene selectivity in the HDO of p-cresol, which was consistent with the Rim-Edge model. The two separate routes (DDO and HYD) in the HDO of p-cresol on MoS2 catalysts were related to the two different adsorptions (orientation adsorption and co-planar position adsorption) of p-cresol on MoS2 active sites at the beginning.10,45 Therefore, it could conclude that rim sites adsorbed p-cresol molecules via the co-planar position, while the edge sites adsorbed p-cresol molecules via vertical orientation, producing methylcyclohexane and toluene as the final products after the HDO reaction.

It was reported that the HDO reaction temperature played a significant role in phenol conversion and product distribution, and high temperature was beneficial to the DDO route while low temperature was favorable for the hydrogenation route.7,27,46 Consequently, the effect of the reaction temperature on the conversion and product distribution was studied using the HDO of p-cresol on Mo-S-7, as shown in Fig. 6. p-Cresol conversion increased with reaction temperature and the deoxygenation degree increased from 62.9% at 275 °C to 90.2% at 325 °C, which indicated that the HDO of p-cresol was controlled by kinetics. But this did not mean that the degree of deoxygenation would increase with reaction temperature all the time, because there existed an exothermic reversible reaction equilibrium in this HDO reaction, according to the thermodynamic calculation.46 For the product distribution, the total selectivity of methylcyclohexane and methylcyclohexene produced by the HYD route was increased firstly and then decreased when the reaction temperature was raised from 275 °C to 325 °C. This change in selectivity could be explained using the following reasons. The Gibbs free energy for the hydrogenation of p-cresol to 4-methylcyclohexanol was calculated to be −0.7, 1.5 and 3.8 kcal mol−1 at 275, 300 and 325 °C, respectively. This suggested that the hydrogenation of p-cresol became harder with the increase of reaction temperature, leading to the decline in HYD route selectivity. On the other hand, this hydrogenation reaction was related to the hydrogen absorbed on the catalyst. Although the total pressure was fixed at 4.0 MPa with hydrogen, the solubility of hydrogen in the solvent decreased with temperature and then decreased the available H2 on the catalyst surface.47 Maybe the required H2 on the catalyst surface for the hydrogenation of p-cresol at 300 °C is sufficient, but it became insufficient when the temperature increased to 325 °C, and then lowered the methylcyclohexane selectivity.


image file: c5ra09690a-f6.tif
Fig. 6 The effect of reaction temperature on the conversion and product distribution in the HDO of p-cresol on Mo-S-7.

To further study the effect of surface area, pore size distribution and layers in the stack of MoS2 catalyst on its activity, we prepared MoS2 catalysts at 240 °C for different times and then applied them into the HDO of p-cresol. The surface area of MoS2 catalysts and their catalytic activities are shown in Table 4. The surface area increased firstly and then decreased with preparation time. Mo-S-8 had the highest surface area (217.0 m2 g−1). This suggested that appropriate preparation time was helpful to obtain MoS2 with a large surface area. The conversion on Mo-S-7 was 70.0% at 300 °C for 5 h, which increased to 89.3% on Mo-S-8 and then decreased to 62.9% on Mo-S-9. This trend of conversion on MoS2 was in agreement with its surface area, meaning that higher surface area was beneficial to enhance the catalyst activity. However, comparing with MoS2 prepared at 200 °C such as Mo-S-5, Mo-S-8 had a higher surface area but exhibited almost the same conversion in the HDO of p-cresol. This suggested that the high conversion might be related to other factors, except the surface area. Fig. 7 displays the comparison of Mo-S-5 and Mo-S-8 on pore size distribution. Mo-S-8 had a bimodal mesoporous structure, but its large pore peak was very broad, being in the range 4.2 nm to 220 nm. In contrast, Mo-S-5 exhibited a narrow large pore distribution peak. Hence, the narrow large pore size distribution of MoS2 was also an important factor for its catalytic activity in the HDO of p-cresol.

Table 4 Surface area of MoS2 prepared at different times and their catalytic activities in the HDO of p-cresol at 300 °C for 5 h
Catalysts Mo-S-7 Mo-S-8 Mo-S-9
Surface area (m2 g−1) 183.6 217.0 135.2
Conversion (mol%) 70.0 89.3 62.9
[thin space (1/6-em)]
Products distribution (mol%)
Methylcyclohexane 28.1 12.5 29.9
3-Methylcyclohexene 7.5 3.0 1.4
Toluene 66.0 84.5 68.7
HYD/DDO 0.54 0.18 0.46
D. D., wt% 67.3 87.8 59.6


image file: c5ra09690a-f7.tif
Fig. 7 Comparison of Mo-S-5 and Mo-S-8 on the pore size distribution.

Table 4 shows that Mo-S-8 had the highest direct deoxygenation activity. The toluene selectivity on Mo-S-8 was up to 84.5% and the corresponding HYD/DDO was only 0.18. The above discussion concluded that the product distribution was related to the layer number in the stacks of the MoS2 structure. To further verify this conclusion, MoS2 catalysts prepared with different times were characterized by HRTEM and their images are presented in Fig. 8. All the samples displayed the characterization of the hexagonal MoS2 structure, but the layer number in the stacks of MoS2 decreased in the order of Mo-S-8 > Mo-S-9 ≈ Mo-S-7. The toluene selectivity in the HDO of p-cresol on Mo-S-7 and Mo-S-9 was 66.0% and 68.7%, respectively, which was lower than that on Mo-S-8. This verified that the higher direct deoxygenation activity of MoS2 depended on the greater number of layers in its stacks again.


image file: c5ra09690a-f8.tif
Fig. 8 HRTEM images of MoS2 catalysts prepared by different times.

Until now, the unsupported MoS2 catalyst had been synthesized by several preparation methods such as mechanical activation method, in situ decomposition of soluble Mo precursors, exfoliation method and hydrothermal method, resulting in different HDO activities. In the HDO of p-cresol, Wang et al.48 had reported that the conversion on Mo-W-S prepared by the mechanical activation method was only 50% under the conditions of a p-cresol/MoS2 weight ratio of 13.9, 300 °C, 3.0 MPa pressure and 5 h. Yang et al.46 had reported that p-cresol conversion on MoS2 derived from the in situ decomposition of ammonium heptamolybdate tetrahydrate or exfoliated MoS2 was 52% and 75% under the conditions of a p-cresol/MoS2 weight ratio of 14.4, 350 °C, 2.8 MPa pressure and 7 h, respectively. B. Yoosuk et al.49 had reported that the conversion in the HDO of phenol on MoS2 synthesized by the hydrothermal method using ammonium tetrathiomolybdate as a raw material was 71% under the conditions of a phenol/MoS2 weight ratio of 4, 350 °C, 2.8 MPa pressure and 1 h. However, in this study, MoS2 was prepared from ammonium heptamolybdate by a hydrothermal method. After optimizing the synthesis conditions such as temperature, pH value, reaction time and pressure, MoS2 with a bimodal mesoporous nanosheet was prepared and exhibited high HDO activity. p-Cresol conversion reached 99.9% with a deoxygenation degree of 99.9% under the conditions of a p-cresol/MoS2 weight ratio of 22.5, 300 °C, 4.0 MPa pressure and 4 h. In addition, this method was easy to operate and repeat, where thiourea was used to substitute the poisonous gas H2S. Moreover, the raw materials for the preparation of MoS2 were common and cheap. All of these indicated the superiority of this method for the preparation of MoS2 with high HDO activity. For the HDO reaction, it was inevitable that the produced water caused the exchange of edge sulfur atoms at the reaction temperature, changing the nature of the MoS2 edge sites and then decreasing the HDO activity.50,51 This disadvantage might be overcome by preventing contact of the water with the catalyst. An effective way is to improve the hydrophobicity of the sulphide catalyst. These details are still under investigation.

4. Conclusion

Bimodal mesoporous MoS2 nanosheets with high HDO activity were prepared by optimizing the synthesis conditions such as pH value, pressure, reaction time and temperature. The pH value played an important role in the preparation of MoS2. The MoO3 phase was detected in the sample when the pH value was 1.4. The (002) plane of MoS2 broadened and its intensity decreased with the decrease in pH value. A low pH value was beneficial to obtain MoS2 with a narrow bimodal peak distribution and large specific surface area. High pressure had a negative effect on its specific surface area due to the accelerated aggregation of MoS2 particles. In the HDO of p-cresol, the deoxygenation degree and HYD/DDO were 99.9% and 0.51, respectively. The high deoxygenation degree depended on both the high surface area and the narrow large pore distribution of the MoS2 catalyst. The relation between product distribution and the microstructure of the catalyst in the HDO of p-cresol on MoS2 could be well explained by the Rim-Edge model, where the rim site adsorbed p-cresol molecular via co-planar position while edge site adsorbed p-cresol molecular via vertical orientation. The more layers in the MoS2 stack, the higher the direct deoxygenation activity it exhibited.

Acknowledgements

This work was supported by National Natural Science Foundation of China (No. 21306159, 21376202), Scientific Research Fund of Hunan Provincial Education Department (15B234) and Specialized Research Fund for the Doctoral Program of Higher Education (20124301120009).

Notes and references

  1. C. Liu, H. Wang, A. M. Karim, J. Sun and Y. Wang, Chem. Soc. Rev., 2014, 43, 7594–7623 RSC.
  2. J. Zakzeski, P. C. A. Bruijnincx, A. L. Jongerius and B. M. Weckhuysen, Chem. Rev., 2010, 110, 3552–3599 CrossRef CAS PubMed.
  3. H. Wang, J. Male and Y. Wang, ACS Catal., 2013, 3, 1047–1070 CrossRef CAS.
  4. G.-H. Wang, J. Hilgert, F. H. Richter, F. Wang, H.-J. Bongard, B. Spliethoff, C. Weidenthaler and F. Schüth, Nat. Mater., 2014, 13, 293–300 CrossRef CAS PubMed.
  5. Y. Hong, H. Zhang, J. Sun, K. M. Ayman, A. J. R. Hensley, M. Gu, M. H. Engelhard, J.-S. McEwen and Y. Wang, ACS Catal., 2014, 4, 3335–3345 CrossRef CAS.
  6. N. Ota, M. Tamura, Y. Nakagawa, K. Okumura and K. Tomishige, Angew. Chem., 2015, 127, 1917–1920 CrossRef PubMed.
  7. W. Wang, L. Li, K. Wu, K. Zhang, J. Jie and Y. Yang, Appl. Catal., A, 2015, 495, 8–16 CrossRef CAS PubMed.
  8. Y. Liu, L. Chen, T. Wang, X. Zhang, J. Long, Q. Zhang and L. Ma, RSC Adv., 2015, 5, 11649–11657 RSC.
  9. V. N. Bui, D. Laurenti, P. Afanasiev and C. Geantet, Appl. Catal., B, 2011, 101, 239–245 CrossRef CAS PubMed.
  10. Y. Romero, F. Richard and S. Brunet, Appl. Catal., B, 2010, 98, 213–223 CrossRef CAS PubMed.
  11. Y. Wang, H. Lin and Y. Zheng, Catal. Sci. Technol., 2014, 4, 109–119 CAS.
  12. J. Sun, A. M. Karim, H. Zhang, L. Kovarik, X. S. Li, A. J. Hensley, J.-S. McEwen and Y. Wang, J. Catal., 2013, 306, 47–57 CrossRef CAS PubMed.
  13. Y. K. Lugo-Jose, J. R. Monnier, A. Heyden and C. T. Williams, Catal. Sci. Technol., 2014, 4, 3909–3916 CAS.
  14. L. Wang, H. Wan, S. Jin, X. Chen, C. Li and C. Liang, Catal. Sci. Technol., 2015, 5, 465–474 CAS.
  15. C. Zhao, S. Kasakov, J. He and J. A. Lercher, J. Catal., 2012, 296, 12–23 CrossRef CAS PubMed.
  16. P. M. Mortensen, D. Gardini, H. W. P. de Carvalho, C. D. Damsgaard, J.-D. Grunwaldt, P. A. Jensen, J. B. Wagner and A. D. Jensen, Catal. Sci. Technol., 2014, 4, 3672–3686 CAS.
  17. R. G. Kukushkin, O. A. Bulavchenko, V. V. Kaichev and V. A. Yakovlev, Appl. Catal., B, 2015, 163, 531–538 CrossRef CAS PubMed.
  18. J. Chen, H. Shi, L. Li and K. Li, Appl. Catal., B, 2014, 144, 870–884 CrossRef CAS PubMed.
  19. A. Infantes-Molina, E. Gralberg, J. A. Cecilia, E. Finocchio and E. Rodriguez-Castellon, Catal. Sci. Technol., 2015, 5, 3403–3415 CAS.
  20. W. Wang, Y. Yang, H. Luo, H. Peng and F. Wang, Ind. Eng. Chem. Res., 2011, 50, 10936–10942 CrossRef CAS.
  21. W. Wang, Z. Qiao, K. Zhang, P. Liu, Y. Yang and K. Wu, RSC Adv., 2014, 4, 37288–37295 RSC.
  22. S. A. W. Hollak, R. W. Gosselink, D. S. van Es and J. H. Bitter, ACS Catal., 2013, 3, 2837–2844 CrossRef CAS.
  23. N. Yan, Y. Yuan, R. Dykeman, Y. Kou and P. J. Dyson, Angew. Chem., Int. Ed., 2010, 49, 5549–5553 CrossRef CAS PubMed.
  24. Y. Q. Yang, C. T. Tye and K. J. Smith, Catal. Commun., 2008, 9, 1364–1368 CrossRef CAS PubMed.
  25. C. Wang, D. Wang, Z. Wu, Z. Wang, C. Tang and P. Zhou, Appl. Catal., A, 2014, 476, 61–67 CrossRef CAS PubMed.
  26. B. Yoosuk, D. Tumnantong and P. Prasassarakich, Chem. Eng. Sci., 2012, 79, 1–7 CrossRef CAS PubMed.
  27. W. Wang, K. Zhang, Z. Qiao, L. Li, P. Liu and Y. Yang, Ind. Eng. Chem. Res., 2014, 53, 10301–10309 CrossRef CAS.
  28. X. Liu, X. Li and Z. Yan, Appl. Catal., B, 2012, 121–122, 50–56 CrossRef CAS PubMed.
  29. M. S. Rana, J. Ancheyta, S. K. Maity and P. Rayo, Catal. Today, 2005, 109, 61–68 CrossRef CAS PubMed.
  30. Y. Wang, J. Wu and S. Wang, RSC Adv., 2013, 3, 12635–12640 RSC.
  31. S.-K. Park, S.-H. Yu, S. Woo, J. Ha, J. Shin, Y.-E. Sung and Y. Piao, CrystEngComm, 2012, 14, 8323–8325 RSC.
  32. Z. Wang, T. Chen, W. Chen, K. Chang, L. Ma, G. Huang, D. Chen and J. Y. Lee, J. Mater. Chem. A, 2013, 1, 2202–2210 CAS.
  33. C. Wang, H. Lin, Z. Xu, H. Cheng and C. Zhang, RSC Adv., 2015, 5, 15621–15626 RSC.
  34. B. E. Erickson and G. R. Helz, Geochim. Cosmochim. Acta, 2000, 64, 1149–1158 CrossRef CAS.
  35. P. W. Dunne, A. S. Munn, C. L. Starkey and E. H. Lester, Chem. Commun., 2015, 51, 4048–4050 RSC.
  36. P. Afanasiev, C. Geantet, I. Llorens and O. Proux, J. Mater. Chem., 2012, 22, 9731–9737 RSC.
  37. Y. Tang, D. Wu, Y. Mai, H. Pan, J. Cao, C. Yang, F. Zhang and X. Feng, Nanoscale, 2014, 6, 14679–14685 RSC.
  38. Y. Tian, X. Zhao, L. Shen, F. Meng, L. Tang, Y. Deng and Z. Wang, Mater. Lett., 2006, 60, 527–529 CrossRef CAS PubMed.
  39. X. Wang, Z. Zhang, Y. Chen, Y. Qu, Y. Lai and J. Li, J. Alloys Compd., 2014, 600, 84–90 CrossRef CAS PubMed.
  40. M. Kruk and M. Jaroniec, Chem. Mater., 2001, 13, 3169–3183 CrossRef CAS.
  41. A. Prabhu, A. Al Shoaibi and C. Srinivasakannan, Mater. Lett., 2015, 146, 43–46 CrossRef CAS PubMed.
  42. A. Prabhu, A. Al Shoaibi and C. Srinivasakannan, Mater. Lett., 2014, 136, 81–84 CrossRef CAS PubMed.
  43. P. Sun, W. Zhang, X. Hu, L. Yuan and Y. Huang, J. Mater. Chem. A, 2014, 2, 3498–3504 CAS.
  44. M. Daage and R. R. Chianelli, J. Catal., 1994, 149, 414–427 CrossRef CAS.
  45. H. Wan, R. Chaudhari and B. Subramaniam, Top. Catal., 2012, 55, 129–139 CrossRef CAS.
  46. Y. Yang, H. a. Luo, G. Tong, K. J. Smith and C. T. Tye, Chin. J. Chem. Eng., 2008, 16, 733–739 CrossRef CAS.
  47. F. Faglioni and W. A. Goddard, J. Chem. Phys., 2005, 122, 014704–014718 CrossRef PubMed.
  48. C. Wang, Z. Wu, C. Tang, L. Li and D. Wang, Catal. Commun., 2013, 32, 76–80 CrossRef CAS PubMed.
  49. B. Yoosuk, D. Tumnantong and P. Prasassarakich, Fuel, 2012, 91, 246–252 CrossRef CAS PubMed.
  50. O. I. Şenol, T. R. Viljava and A. O. I. Krause, Catal. Today, 2005, 106, 186–189 CrossRef PubMed.
  51. M. Badawi, J. F. Paul, S. Cristol, E. Payen, Y. Romero, F. Richard, S. Brunet, D. Lambert, X. Portier, A. Popov, E. Kondratieva, J. M. Goupil, J. El Fallah, J. P. Gilson, L. Mariey, A. Travert and F. Maugé, J. Catal., 2011, 282, 155–164 CrossRef CAS PubMed.

Footnote

Electronic supplementary information (ESI) available. See DOI: 10.1039/c5ra09690a

This journal is © The Royal Society of Chemistry 2015
Click here to see how this site uses Cookies. View our privacy policy here.