Gold nanoparticles deposited on fluorine-doped tin oxide surface as an effective platform for fabricating a highly sensitive and specific digoxin aptasensor

H. Bagheri*a, R. P. Talemib and A. Afkhamic
aChemical Injuries Research Center, Baqiyatallah University of Medical Sciences, Tehran, Iran. E-mail: h.bagheri82@gmail.com; h_bagheri82@hotmail.com
bFaculty of Chemistry, Kharazmi University, Tehran, Iran
cFaculty of Chemistry, Bu-Ali Sina University, Hamedan, Iran

Received 19th May 2015 , Accepted 29th June 2015

First published on 30th June 2015


Abstract

In this paper we used a modified fluorine-doped tin oxide (FTO) as the substrate of a novel aptasensor for electrochemical determination of digoxin. For this purpose, a selective thiolated digoxin aptamer was immobilized onto the gold nanoparticles deposited FTO (GNPs/FTO) surface. Cyclic voltammetry (CV), electrochemical impedance spectroscopy, scanning electron microscopy (SEM) and atomic force microscopy (AFM) were used for the characterization of modified surfaces. The aptasensor response was based on a decrease in the methylene blue (MB) current, as an electrochemical probe, after incubating with digoxin. Digoxin can be determined in a linear concentration range from 0.02 to 0.2 μg L−1 by differential pulse voltammetry (DPV). The detection limit of the proposed aptasensor was 0.01 μg L−1. Also, the fabricated aptasensor was applied to determine digoxin in urine and blood plasma samples with satisfactory results. Furthermore, high sensitivity and specificity, low detection limit and fast response, can make it possible to determine trace amounts of digoxin for routine clinical analysis.

Introduction

Aptasensors are essentially biosensors based on aptamers as recognition elements. In recent years, there has been great interest in the development of aptasensors.1 This is because the aptamers have high affinity and specificity to their target molecules. Furthermore, they have numerous advantages, such as easy chemical modification, good stability, convenient synthesis and high thermal stability.1 Therefore, they would be extremely useful to fabricate aptamer based biosensors for the detection of various analytes with different signal transducers, such as optical,2–4 mass-dependant,5–7 colorimetric,8–10 and electrochemical systems.11,12 Among various aptasensors, due to high sensitivity and specificity as well as simple instrumentation, only electrochemical aptasensor has been proved as a suitable method for detection of analytes.

A critical step while preparing an aptasensor is the immobilization of aptamer on the surface of a sensing device. The amount of immobilized aptamer will influence on accuracy, sensitivity, and stability of an aptasensor directly. Various strategies have been adapted for signal generation, amplification, and development of novel and sensitive electrochemical aptasensors.13–16 These methods include nanoparticle based aptasensors for signal amplification,17–19 signal-on measurement by the conformational change of aptamers,20–22 and a target-induced displacement method.23–25

Nanomaterials, with unique physicochemical properties, have great utility in creating new recognition and transduction processes for chemical and biological sensors.26–28 Gold nanoparticles (GNPs) are the most extensively investigated nanomaterials, due to their distinct physical and chemical attributes.28

The advantages of GNPs have encouraged researchers to explore novel sensing strategies with improved sensitivity, stability and selectivity.29,30 A large number of approaches for supporting GNPs have been reported in literature. They have been supported either on the electrode surfaces31 or on other conducting or semiconducting supports such as FTO.32 GNPs have been used to modify FTO substrate leading to satisfactory simultaneous electrochemical detection of biomolecules such as guanosine and guanosine-5′-triphosphate in human blood samples at μmol L−1 level.33

Digoxin is a glycoside used in the treatment of congestive heart failure. In fact, it has been used for this for over 200 years and is still one of the most widely prescribed heart failure drugs. Strict control of digoxin therapy is necessary, because there is a thin line separating between therapeutic and toxic levels (0.05–0.2 μg L−1).34,35 The accurate detection of digoxin in biological fluids such as blood and urine is not an easy task due to its low concentration and generally complex biological matrices. Different techniques have been used to determine digoxin in blood and urine including the enzyme-multiplied immunoassay technique,36 fluorescence polarisation immunoassay,37 high performance liquid chromatography (HPLC) and radioimmune assay (RIA)38 or fluorescence detection and LC/MS39 or LC/MS/MS assay.40

Some of these methods are relatively tedious and have been largely replaced by RIA which is more practical. Although, RIA is sensitive and commonly used in clinical and non-clinical studies, it has specificity problems such as cross-reactions with digoxin metabolites and endogenous digoxin-like substances are known to occur.41 Therefore, the development of a sensitive and selective method for its determination is highly desirable for analytical applications and in researches in the field of clinical studies.

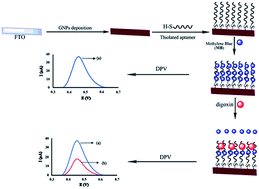
The aim of the present study was to develop a novel electrochemical aptasensor to measure digoxin based on a thiol-terminated digoxin aptamer that its sequence has been studied previously.42 The fabricated aptasensor could be considered as a simple system in comparison with most reported aptasensors because it does not need any prelabeling step. In addition, GNP/FTO is prepared through a simple and rapid one-step mixing procedure without need to any complicated and costly synthetic strategies. To detect digoxin, DPV technique was used as an analytical method. MB as an electrochemical probe, can be easily intercalated into the immobilize aptamer and variation in its peak current measured by DPV. In the presence of digoxin, the decrease in the MB current was due to complex formation between aptamer and digoxin that desorbs the MB from aptamer surface. The proposed aptasensor showed high sensitivity, selectivity with acceptable repeatability, reproducibility and good biocompatibility. Its high sensitivity is due to specific and relatively strong interaction between immobilized aptamer and digoxin. The whole aptasensor fabrication process is schematically demonstrated in Fig. 1.


image file: c5ra09402j-f1.tif
Fig. 1 Schematic illustration of the fabrication steps of the electrochemical digoxin biosensor. The DPVs are for accumulated methylene blue (MB) at FTO/GNPs/Ap, before (a) and after (b) incubation with 0.1 μg L−1 of digoxin drug.

Experimental

Reagents

The thiolated digoxin aptamer with following sequence42 was purchased from Aminsan company (Tehran, Iran).

5′-S–H–AGCGAGGGCGGTGTCCAACAGCGGTTTTTTCAC GAGGAGGTTGGCGGTGG-3′.

Analytical reagent grade chemicals and double distilled water (DDW) were used for preparing all aqueous solutions. Potassium nitrate, sodium chloride, magnesium chloride, K3Fe(CN)6, K4Fe(CN)6, hydrogen tetrachloroaurate (HAuCl4·3H2O), mercaptohexanol, potassium monohydrogen phosphate, potassium di-hydrogen phosphate, trisodium citrate and MB were obtained from Merck company (Germany).

Instrumentation

The pH values were controlled with a pH/mV meter (Metrohm-827, Switzerland) supplied with a combined electrode. Voltammetric measurements were carried out with an EmStat (Electrochemical Sensor Interface) using the PS Trace software from Palm Instruments BV (Netherlands) and electrochemical impedance spectroscopy (EIS) measurements were carried out on an Autolab 302N electrochemical workstation (Switzerland). The conventional three-electrode system which was composed of an Ag/AgCl (3.0 M KCl) as reference electrode, a platinum wire (Azar Electrode, Iran) as the counter electrode and a working electrode (modified and unmodified) were used. FTO coated glass slides, whose sheet resistance was ca. 15 Ω sq−1 were purchased from Dyesol Company (Australia). SEM was obtained by a TESCAN scanning electron microscope (Czech). AFM images of the FTO and FTO/GNPs were observed by a microscope (Multimode Nanoscope 3D, Veeco Instruments Inc., USA) in the tapping mode in air using standard Si3N4 cantilevers.

Fabrication of aptasensor

Firstly, FTO substrate was cleaned with ethanol and DDW successively. GNPs/FTO was prepared according to the literature.43 For this purpose, the FTO substrate was immersed into 25 mL solution of HAuCl4 0.01% (w/v) in a beaker, and subsequently 2.5 mL aqueous solution of sodium citrate 0.01% (w/v) was added into the beaker. Then, the reaction mixture was heated at 75 °C for 30 min for preparing a GNPs deposited FTO substrate. In the next step, the FTO/GNPs surface was incubated at 10−6 mol L−1 aptamer solution for another 2 h to covalently immobilize the 5′-S–H–aptamer. Then, surface of aptasensor was washed with PBS and denoted as FTO/GNPs/Ap. Afterward, the sensor surface was washed with DDW and subsequently was back-filled by spotting 50 μL of a 0.01 mol L−1 aqueous solution of mercaptohexanol onto the modified surface with incubation for 30 min. This step was performed in order to improve the organization of the sensing surface by reorienting the thiolated aptamer for optimal and efficient operation by removing those non-specifically physisorbed onto the surface. Then, the sensor was thoroughly washed by DDW.

Accumulation of MB onto aptamer surface

MB was firstly accumulated onto the aptasensor surface by immersing the FTO/GNPs/Ap into the stirred solution containing 20 μmol L−1 MB and 20 mmol L−1 NaCl for 10 min. After accumulation of MB, the electrode surface was thoroughly rinsed with high ionic strength rinsing buffer solution (10 mmol L−1 phosphate buffer solution (pH 7.0), containing 10 mmol L−1 KCl, 10 mmol L−1 MgCl2, and 100 mmol L−1 NaCl). In order to determine digoxin, 10 mL digoxin solutions in different concentrations were incubated onto the sensing surface. After 45 min, the surface was rinsed with rinsing buffer to remove nonspecific adsorption of digoxin. The peak current of accumulated MB was measured as a function of the digoxin concentration.

Preparation of real samples

Human urine samples were obtained from volunteer who had not taken digoxin and stored in a refrigerator at 4 °C immediately after collection (from the Rasht Health Centre). Ten milliliters of the sample was centrifuged for 5 min at 5000 rpm. The supernatant was diluted 5.0 times with phosphate buffer solution (PBS) pH 7.0. The solution was transferred into the voltammetric cell to be analyzed without any further pretreatment. The standard addition method was used for the determination of digoxin in urine real sample.

In order to precipitate proteins of plasma samples, 1.0 mL of the sample was treated with 20 mL perchloric acid (HClO4, 20% v/v). Then, the mixture was vortexed for a further 30 s and then was centrifuged at 1000 rpm for 20 min. The solution was diluted five times with the PBS (pH 7.0) and was transferred into a voltammetric cell. Once more, the standard addition method was applied for the determination of digoxin contents.

In this section, all experiments were performed in compliance with the relevant laws and institutional guidelines. In addition, informed consent was obtained for any experimentation with human subjects and the experiments were approved and conducted according to the guidelines of Iranian Committee of Bioethics, National Committee for Ethics in Science and Technology.

Electrochemical measurements

The modified FTO surfaces obtained during the aptasensor fabrication were electrochemically characterized using EIS and CV based our previous work. EIS measurements were performed in 1.0 mmol L−1 K3Fe(CN)6/K4Fe(CN)6 (1[thin space (1/6-em)]:[thin space (1/6-em)]1) mixture containing 0.1 mol L−1 KNO3. The EIS measurements were performed with the frequency range from 104 to 0.1 Hz at the formal potential of the system, E° = 0.182 V. DPV measurements were performed using 0.1 mol L−1 PBS (pH 7.0) solution as the supporting solution. The DPV parameters were pulse amplitude 50 mV, pulse width 50 ms, and with scan rate of 20 mV s−1. To detect digoxin, MB accumulated FTO/GNPs/Ap was immersed in a solution containing a series of different concentration of digoxin and the MB current was measured using DPV method.

Results and discussion

Characterization of modified surfaces

Fig. 2A and B shows typical SEM images of a bare FTO and an FTO surface after modifying with GNPs in a direct chemical deposition. It can be seen that many quasi-spherical GNPs are deposited on the FTO electrode surface with a quite symmetric distribution. The average diameter of these quasi-spherical nanoparticles is about 40 nm. The GNPs on the FTO electrode were quite stable and could withstand a repeated rinsing with DDW. No evident changes in the surface morphology and electrochemical behavior of the FTO/GNPs surfaces were observed after storage in an airtight container for 2 months.
image file: c5ra09402j-f2.tif
Fig. 2 SEM image of a bare FTO (A), FTO/GNPs surface (B) and AFM images of bare FTO (C) and FTO/GNPs (D).

AFM studies could furnish the morphological characteristic of FTO and FTO/GNPs surfaces. In quantitative analyses of AFM images, the Rrms (surface roughness) is a useful parameter for comparative analysis. Fig. 2C and D illustrates the three dimensional view of the tapping mode image of the bare FTO (C) and FTO/GNPs (D) surfaces. From AFM measurements, the Rrms of the FTO/GNPs film (1.17 nm) is less than that of the bare FTO film (1.85 nm). The results confirm the morphological change of the FTO film after the modification, which might contribute to the creation of a new interface.44

According to the Randles–Sevcik equation:45

Ipc = (2.69 × 10⁵)n3/2AD1/2C*v1/2
where Ipc is the reduction peak current (A), n is the electron transfer number, A is the electroactive surface area (cm2), D is the diffusion coefficient of K4[Fe(CN)6] in the solution (cm2 s−1), C* is the concentration of K4[Fe(CN)6] (mol cm−3), and v is the scan rate (V s−1), the electroactive surface area of different surfaces can be calculated. By exploring the redox peak current with the scan rate, the average electroactive area of bare FTO and FTO/GNPs surfaces were calculated 0.496 and 0.801 cm2, respectively. These results indicated that the presence of GNPs greatly improved the effective area of the electrode. Furthermore, the surface densities of the immobilized aptamer on the electrode surface at the presence and absence of the GNPs were calculated using a chronocoulometric method according to a previously reported procedure.27 The surface densities of 8.4 × 10¹⁵ and 2.2 × 10¹⁴ molecule per cm2 at the presence and absence of the GNPs showed that they have a great effect on the immobilization of the aptamer.

EIS can provide valuable information on the change in impedance behavior of the surface.46,47 Thus, EIS technique was employed to investigate the interface properties of FTO, FTO/GNPs, and FTO/GNPs/Ap surfaces. The Nyquist plots are shown in Fig. 3A. The Randles model48 was used as an equivalent circuit to describe the data of electrochemical impedance measurements. The fitting of the measured spectra is shown in (Fig. 3A-inset), where good agreement can be observed over the entire range of measured frequencies. The general equivalent electric circuit (Randles) includes the ohmic resistance of the electrolyte solution (RΩ), the Warburg impedance (W) resulting from ion diffusion from the bulk electrolyte to the electrode interface, the double layer (Cdl), and the charge-transfer resistance (Rct), which are admitted to exist when the electrolyte solution contains a redox probe. To our knowledge, the diameter of the semicircle in the Nyquist plots equals the electron transfer resistance (Rct). This resistance controls the electron-transfer kinetics of the redox probe at the electrode interface. As is evident from Fig. 3A, for the bare FTO surface (a), a small value of Rct was observed. This result showed that there was a little resistance against charge transfer at the bare FTO surface. In the case of FTO/GNPs surface, a significant decrease in Rct value was observed in comparison with the FTO. This means that in the FTO/GNPs the electron transfer process between the solution and the modified surface is facilitated due to the presence of GNPs. Conversely, addition of thiolated aptamer onto the FTO/GNPs surface increased the Rct value from 1.0 to 8.1 kΩ. This behavior is attributed to the strong binding of the immobilized aptamer molecules with GNPs which impedes the charge carriers in the surface.


image file: c5ra09402j-f3.tif
Fig. 3 EIS (A) and CVs (B) of 1.0 mmol L−1 [Fe(CN)6]3−/4− recorded on bare FTO (a), FTO/GNPs (b), and FTO/GNPs/Ap (c) in 0.1 mol L−1 KNO3.

CVs were also used to monitor the fabrication process. CVs at the bare FTO and the different modified surfaces in 1.0 mmol L−1 [Fe(CN)6]3−/4− were shown in Fig. 3B. A couple of well-defined redox peaks could be observed at the bare FTO (curve a). The peak currents at the FTO/GNPs (curve b) increased dramatically in comparison with those of curve a. The reason was that GNPs with large specific surface area and good conductivity could act as tiny conduction centers which facilitate the transfer of electrons, so it could accumulate much more [Fe(CN)6]3−/4− on the modified surface. The immobilization of thiolated aptamer on modified surface induced a decrease of peak current, indicating that the aptamer has been successfully immobilized on the surface and the peak current decrease could be well assigned to the repellence of [Fe(CN)6]3−/4− by the negatively charged phosphate backbone of aptamer (curve c). CV results were consistent with the observations of EIS experiments, which further confirmed the successful construction of the aptasensor.

Optimization of some factor of aptasensor fabrication

As shown in Fig. 4A, the peak current increased dramatically with aptamer concentration increasing from 10−8 to 10−6 mol L−1, and the peak current intensity tended to be stable beyond 10−6 mol L−1. Therefore, 10−6 mol L−1 was the saturated concentration of aptamer and was selected to be the optimized concentration of aptamer. The reduction reaction of MB was influenced by the pH value of the supporting electrolyte. Based on physiological conditions, pH values from 6.0 to 9.0 were tested and the results shown in Fig. 4B suggested the best performance was obtained in the PBS buffer solution with a pH value of 7.0.
image file: c5ra09402j-f4.tif
Fig. 4 The DPV peak current of MB for the FTO/GNPs electrode after various aptamer concentrations used for immobilization (A), the DPV peak current of MB for the FTO/GNPs/Ap electrode at various pHs of supporting electrolyte (B), at different accumulation times of MB (C), and after different incubation times with 0.1 μg L−1 of digoxin (D). DPV parameters were 25 mV pulse amplitude, pulse width 50 ms, and a scan rate of 20 mV s−1. Error bars show the standard deviations of measurements taken from three independent experiments.

Also, accumulation time of MB could influence on the responses of the aptasensor. Fig. 4C revealed that aptasensor response increased rapidly with increasing accumulation time from 1 to 10 min, then after 10 min it reached to equilibrium so, 10 min was selected as the reaction time between the sensing interface with MB molecules. To optimize the digoxin incubation time, the proposed aptasensor was incubated with digoxin at various incubation times (20 to 60 min). The plot in Fig. 4D told us that the current response decreased with the incubation time from 10 to 40 min and reached a plateau after 40 min. This result indicated that the formation of aptamer–digoxin complex is complete after 40 min. Thus, 40 min was chosen as the optimum incubation time between the aptamer and digoxin.

DPV determination of digoxin

The aptasensor response toward digoxin was investigated by recording DPVs of FTO/GNPs/Ap. The Differential pulse voltammograms of the FTO/GNPs/Ap were recorded after incubation with different concentrations of digoxin in the optimized condition. As shown in Fig. 5A, the peak current of accumulated MB shows obvious decrease with increasing the digoxin concentration. This means that the MB-anchored aptamer is desorbed from the surface of aptasensor after reaction with the target digoxin. As seen in Fig. 5B, the peak currents of accumulated MB onto the biosensor surface was linear with the concentration of digoxin as regression equation I (μA) = −136.55X (μg L−1) + 35.34 (R2 = 0.998) in a range of 0.02–0.2 μg L−1. A detection limit of 0.01 μg L−1 of the digoxin was estimated using 3s/m (where s is the standard deviation of the blank solution (n = 5) and m is the slope of calibration curve).
image file: c5ra09402j-f5.tif
Fig. 5 (A) Differential pulse voltammograms of MB in PBS (pH 7.0, 20 mmol L−1 NaCl) on FTO/GNPs/Ap before (a) and after incubation with different concentrations of digoxin. Concentrations of digoxin from (b) to (i) were 0.02, 0.05, 0.075, 0.1, 0.125, 0.15, 0.175, and 0.2 μg L−1, respectively. (B) The peak current of accumulated MB on the biosensor surface versus concentration digoxin. All measurements were carried out under the same conditions. (C) Selectivity analysis of the proposed aptasensor for digoxin toward some interference. The concentration of the digoxin was 0.02 μg L−1 and concentration of other interference were 10 μg L−1. Error bars show the standard deviations of measurements taken from three independent experiments.

The observed detection limit and the linear dynamic range for digoxin at the proposed aptasensor are comparable and even better than those obtained for other modified electrodes (Table 1). The high sensitivity of proposed aptasensor can be assigned to specific interaction between aptamer and digoxin and deposition of GNPs onto the FTO surface. GNPs provide an appropriate template for successful immobilization of aptamer through strong covalent interaction by a well-known Au–S bond.28 As a result, thiolated aptamer can be tightly grafted on the GNPs modified FTO surface.

Table 1 Comparison of the analytical parameters with other digoxin sensor
Ref. no. Detection method Limit of detection (μg L−1) Dynamic linear range (μg L−1)
49 Fluorescence 3.2 × 10⁻² 4.0 × 10⁻¹ to 2.7
50 Fluorescence 4.4 × 10⁻¹
51 CV 1.0 × 10⁻¹ 1.0 × 10⁻¹ to 99.9
52 Dispersive liquid–liquid microextraction 1.56 7.8–390.5
This work DPV 0.01 0.02–0.2


On the other hand, as we know, the most critical step while preparing a aptasensor is the immobilization of DNA aptamer on the surface of a sensing device. The amount of immobilized aptamer will influence the accuracy, sensitivity, selectivity, and life of aptasensor directly. Because of the high surface-to-volume ratio and excellent biological compatibility, GNPs can enlarge the sensing surface area to increase the amount of immobilized aptamer greatly, and the aptamer mixed with nano-materials can keep its biological activity well.28

Repeatability, reproducibility and stability of the aptasensor

The repeatability, reproducibility and stability of the proposed aptasensor were investigated by DPV measurements of 0.1 μg L−1 digoxin solution. The relative standard deviation (RSD%) for five successive assays of digoxin was 3.2%, showing good repeatability of the aptasensor. To characterize the reproducibility, five aptasensor fabricated independently were used to determine 0.1 μg L−1 of digoxin, and the RSD was 4.0%, revealed good reproducibility of the aptasensor. When the aptasensor was stored in a refrigerator, the modified electrode retained 98% its initial response after a week and 95% after 30 days. These results indicated that proposed aptasensor had good stability.

Selectivity of the digoxin biosensor

The selectivity is a very important factor for evaluating the applicability of the aptasensor in biological sample analysis. Tetracycline, narcotine, tebaine, pentazocine, morphine and codeine were employed to investigate the specificity of the aptasensor for the detection of digoxin. As shown in Fig. 5C, while incubating 0.02 μg L−1 digoxin induces a remarkable decrease in the peak current of MB, however, after incubating the aptasensor with 2 μg L−1 concentration (100-fold higher than that of digoxin) of tebaine, pentazocine, morphine, and codeine, no recognizable signal were observed. This can be ascribed to this fact that the binding event between digoxin and aptamer is based on the specific recognition between them but not on the other factors, such as nonspecific adsorption. Therefore, the proposed strategy has a sufficient specificity to digoxin against other drugs and digoxin could be identified with high selectivity.

Analytical application

In order to demonstrate the ability of the modified electrode to the determination of digoxin in real samples, digoxin in urine and blood plasma samples were examined. Indeed, the performance of as-prepared aptasensor was measured by studying the recovery of the sensor. In this regard, the samples were prepared as described in the sample preparation section. Then, known concentrations of digoxin were added into the same sample volume before their being centrifuged. After sample preparation, the digoxin in the spiked samples was measured simultaneously. As can be seen from Table 2 urine and blood plasma samples were spiked with 0.1 and 0.15 μg L−1 of digoxin. The recoveries (n = 3) of the measured samples by the aptasensor were between 103% and 106% and the standard deviations (RSD) (n = 3) are in the range of 0.002 and 0.003 (Table 2). The experimental results demonstrate that the ultrasensitive aptasensor can be used for rapid digoxin detection in urine and blood plasma samples.
Table 2 Analytical results of spiked urine and blood plasma samplesa
Sample Added digoxin (μg L−1) Found digoxin (μg L−1) Recovery (%)
a Values in parentheses are RSDs based on three replicates.
Urine
0.100 0.103 (±0.002) 103
0.150 0.156 (±0.003) 104
Blood plasma
0.100 0.104 (±0.002) 104
0.150 0.159 (±0.002) 106


Conclusion

No report has been presented yet in the literatures for the voltammetric detection of digoxin using an aptasensor. A highly sensitive and selective electrochemical aptasensor was developed for determination of digoxin. The proposed sensor was fabricated by the immobilization of a thiolated digoxin specific aptamer on the surface of GNPs/FTO substrate and MB was used as the redox probe for electrochemical sensing. Due to high surface-to-volume ratio and excellent biological compatibility of GNPs, they can enlarge the sensing surface area to increase the amount of immobilized aptamer greatly and enhance the sensitivity of the digoxin aptasensor. The cathodic peak current of MB linearly decreased by increasing digoxin concentration. The detect limit for digoxin was as low as 0.01 μg L−1 with a wide linear range from 0.02 to 0.2 μg L−1. The aptasensor was successfully applied to the serum and urine samples because of its high specificity, good stability and repeatability which could provide a promising platform for the fabrication of aptamer-based electrochemical biosensor. The present aptasensor involving no complicated steps is more suitable for practical and routine measuring of digoxin in clinical analysis with a broad linear range.

Acknowledgements

This research was supported by the Researches Office of the Baqiyatallah University of Medical Sciences. We thank Dr A. Shahriyari for his valuable suggestions.

References

  1. A. Erdem and G. Congur, Talanta, 2014, 128, 428–433 CrossRef CAS PubMed.
  2. M. Lee and D. R. Walt, Anal. Biochem., 2000, 282, 142–146 CrossRef CAS PubMed.
  3. T. G. McCauley, N. Hamaguchi and M. Stanton, Anal. Biochem., 2003, 319, 244–250 CrossRef CAS.
  4. N. Li and C. M. Ho, J. Am. Chem. Soc., 2008, 130, 2380–2381 CrossRef CAS PubMed.
  5. M. Liss, B. Petersen, H. Wolf and E. Prohaska, Anal. Chem., 2002, 74, 4488–4495 CrossRef CAS.
  6. M. Minunni, S. Tombelli, A. Gullotto, E. Luzi and M. Mascini, Biosens. Bioelectron., 2004, 20, 1149–1156 CrossRef CAS PubMed.
  7. S. J. Lee, Anal. Chem., 2008, 80, 2867–2873 CrossRef CAS PubMed.
  8. C. D. Medley, Anal. Chem., 2008, 8, 1067–1072 CrossRef PubMed.
  9. J. W. Liu and Y. Lu, Angew. Chem., 2006, 45, 90–94 CrossRef CAS PubMed.
  10. M. N. Stojanovic and D. W. Landry, J. Am. Chem. Soc., 2002, 124, 9678–9679 CrossRef CAS PubMed.
  11. I. Willner and M. Zayats, Angew. Chem., 2007, 46, 6408–6418 CrossRef CAS PubMed.
  12. Y. S. Kim, S. J. Lee and M. B. Gu, BioChip J., 2008, 2, 175–182 Search PubMed.
  13. K. Ikebukuro, C. Kiyohara and K. Sode, Biosens. Bioelectron., 2005, 20, 2168–2172 CrossRef CAS PubMed.
  14. S. Centi, G. Messina, S. Tombelli, I. Palchetti and M. Mascini, Biosens. Bioelectron., 2008, 23, 1602–1609 CrossRef CAS PubMed.
  15. J. Wang, A. Munir, Z. Li and H. S. Zhou, Talanta, 2010, 81, 63–67 CrossRef CAS PubMed.
  16. J. Zheng, G. F. Cheng, P. G. He and Y. Z. Fang, Talanta, 2010, 80, 1868–1872 CrossRef CAS PubMed.
  17. P. He, L. Shen, Y. Cao and D. Li, Anal. Chem., 2007, 79, 8024–8029 CrossRef CAS PubMed.
  18. B. Li, Y. Wang, H. Wei and S. Dong, Biosens. Bioelectron., 2008, 23, 965–970 CrossRef CAS PubMed.
  19. A. Numnuam, K. Y. Chumbimuni-Torres, Y. Xiang, R. Bash, P. Thavarungkul, P. Kanatharana, E. Pretsch, J. Wang and E. Bakker, Anal. Chem., 2008, 80, 707–712 CrossRef CAS PubMed.
  20. Y. Xiao, B. D. Piorek, K. W. Plaxco and A. J. Heeger, Angew. Chem., 2005, 44, 5456–5459 CrossRef CAS PubMed.
  21. Y. Xiao, B. D. Piorek, K. W. Plaxco and A. J. Heeger, J. Am. Chem. Soc., 2005, 127, 17990–17991 CrossRef CAS PubMed.
  22. B. R. Baker, R. Y. Lai, M. S. Wood, E. H. Doctor, A. J. Heeger and K. W. Plaxco, J. Am. Chem. Soc., 2006, 128, 3138–3139 CrossRef CAS PubMed.
  23. J. A. Hansen, J. Wang, A. N. Kawde, Y. Xiang, K. V. Gothelf and G. Collins, J. Am. Chem. Soc., 2006, 128, 2228–2229 CrossRef CAS PubMed.
  24. Z. S. Wu, M. M. Guo, S. B. Zhang, C. Rui, J. H. Jiang, G. L. Shen and R. Q. Yu, Anal. Chem., 2007, 79, 2933–2939 CrossRef CAS PubMed.
  25. K. Feng, C. Sun, Y. Kang, J. Chen, J. Jiang, G. Shen and R. Yu, Electrochem. Commun., 2008, 10, 531–535 CrossRef CAS PubMed.
  26. M. H. Mashhadizadeh and R. P. Talemi, Spectrochim. Acta, Part A, 2014, 132, 403–409 CrossRef CAS PubMed.
  27. M. H. Mashhadizadeh and R. P. Talemi, Anal. Methods, 2014, 6, 8956–8964 RSC.
  28. M. H. Mashhadizadeh and R. P. Talemi, Chin. Chem. Lett., 2015, 26, 160–166 CrossRef CAS PubMed.
  29. I. Mannelli and M. P. Marco, Anal. Bioanal. Chem., 2010, 398, 2451–2469 CrossRef CAS PubMed.
  30. K. Saha, S. S. Agasti, C. Kim, X. N. Li and V. M. Rotello, Chem. Rev., 2012, 112, 2739–2779 CrossRef CAS PubMed.
  31. M. H. Mashhadizadeh and R. P. Talemi, Anal. Chim. Acta, 2011, 692, 109–115 CrossRef CAS PubMed.
  32. J. Lin, L. Zhang and S. Zhang, Anal. Biochem., 2007, 370, 180–187 CrossRef CAS PubMed.
  33. R. N. Goyal, M. Oyama and A. Tyagi, Electrochim. Acta, 2008, 53, 7838–7844 CrossRef PubMed.
  34. G. S. Francis, Circ.: Heart Failure, 2008, 1, 208–209 CrossRef PubMed.
  35. A. Ahmed, F. B. Waagstein, B. Pitt, M. White, F. Zannad, J. B. Young and S. H. Rahimtoola, Am. J. Cardiol., 2009, 103, 82–87 CrossRef CAS PubMed.
  36. P. B. Eriksen and O. Andersen, Clin. Chem., 1995, 23, 169–176 Search PubMed.
  37. W. H. Porter, V. M. Haver and B. A. Bush, Clin. Chem., 1984, 30, 1826–1829 CAS.
  38. B. Shapiro, G. J. Kollman and W. I. Heine, Semin. Nucl. Med., 1975, 5, 205–220 CrossRef CAS.
  39. G. Paniagua, P. Fernández, J. S. Durand and C. Pérez-Conde, Anal. Bioanal. Chem., 2003, 375, 1020–1023 Search PubMed.
  40. M. Yao, H. Zhang, S. Chong, M. Zhu and A. R. Morrison, J. Pharm. Biomed. Anal., 2003, 32, 1189–1197 CrossRef CAS.
  41. A. Tracqui, P. Kintz, B. Ludes and P. Mangin, J. Chromatogr. B: Biomed. Sci. Appl., 1997, 692, 101–109 CrossRef CAS.
  42. Z. Kiani, M. Shafiei, P. Rahimi Moghaddam, A. A. Karkhane and S. A. Ebrahimi, Anal. Chim. Acta, 2012, 748, 67–72 CrossRef CAS PubMed.
  43. E. Al-Harbi, M. A. Aziz, M. Oyama, A. M. El-Naggar, N. Al Zayed, A. Wojciechowski and I. V. Kityk, J. Mater. Sci.: Mater. Electron., 2013, 24, 2422–2425 CrossRef CAS PubMed.
  44. G. Ben Assayag, C. Farcau, P. Benzo, L. Cattaneo, C. Bonafos, B. Pecassou, A. Zwick and R. Carles, Nucl. Instrum. Methods, 2012, 272, 214–217 CrossRef CAS PubMed.
  45. A. J. Bard and L. R. Faulkner, Electrochemical Methods, Wiley, New York, 2nd edn, 2001 Search PubMed.
  46. H. Bagheri, A. Afkhami, P. Hashemi and M. Ghanei, RSC Adv., 2015, 5, 21659–21669 RSC.
  47. M. H. Mashhadizadeh and R. P. Talemi, Talanta, 2013, 103, 344–348 CrossRef CAS PubMed.
  48. R. P. Talemi and M. H. Mashhadizadeh, Talanta, 2015, 131, 460–466 CrossRef CAS PubMed.
  49. G. P. Gonzales, P. F. Hernando and J. S. D. Algeria, Anal. Chim. Acta, 2009, 638, 209–212 CrossRef PubMed.
  50. A. S. Emrani, S. M. Taghdisi, N. M. Danesh, S. H. Jalalian, M. Ramezani and K. Abnous, Anal. Methods, 2015, 7, 3814–3818 RSC.
  51. J. Zhang, M. Li, P. Xu, Sh. Jiang, Y. Liu, Y. Chen, L. Liu and Z. Sha, Mater. Sci. Eng., 2013, 178, 1191–1194 CrossRef CAS PubMed.
  52. M. C. Cheng, K. M. Chi and S. Y. Chang, Talanta, 2013, 115, 123–128 CrossRef CAS PubMed.

This journal is © The Royal Society of Chemistry 2015
Click here to see how this site uses Cookies. View our privacy policy here.