
 Open Access Article
 This Open Access Article is licensed under a Creative Commons Attribution-Non Commercial 3.0 Unported Licence
Introducing nanoscaled surface morphology and percolation barrier network into mesoporous silica coatings
E.
Albert
a,
P.
Basa
b,
A.
Deák
c,
A.
Németh
d,
Z.
Osváth
c,
G.
Sáfrán
c,
Z.
Zolnai
c,
Z.
Hórvölgyi
*a and
N.
Nagy
*c
aBudapest University of Technology and Economics, Department of Physical Chemistry and Materials Science, H-1521 Budapest, Hungary. E-mail: zhorvolgyi@mail.bme.hu; Fax: +36 1 463 3767; Tel: +36 1 463 2911
bSemilab Semiconductor Physics Laboratory Co. Ltd., H-1117 Budapest, Hungary
cHungarian Academy of Sciences, Centre for Energy Research, Institute of Technical Physics and Materials Science, H-1525 Budapest, Hungary. E-mail: nagyn@mfa.kfki.hu; Fax: +36 1 392 2226; Tel: +36 1 392 2602
dHungarian Academy of Sciences, Wigner Research Centre for Physics, Institute for Particle and Nuclear Physics, H-1525 Budapest, Hungary
First published on 3rd July 2015
Abstract
Mesoporous silica thin films were patterned at the sub-micron scale utilizing the ion hammering effect in order to combine the advantages of mesoporous character and surface morphology, while preserving the interconnected pore system or creating laterally separated porous volumes surrounded by nonpermeable compact zones. Porous silica coatings were prepared by a sol–gel method with an ordered and disordered pore system using micellar templates. A hexagonally ordered Langmuir–Blodgett type monolayer of silica spheres was applied as a mask against Xe+ ion irradiation. The ion energy was chosen according to Monte-Carlo simulations to achieve structures with high lateral contrast between irradiated and unirradiated, i.e., masked areas. The disordered pore system proved to be more resistant against ion bombardment. Although the created surface morphologies were similar, the main character of the pore system could be tailored to be interconnected or separated by controlling the ion fluence. Confocal fluorescence images and ellipsometric porosimetry measurements confirmed that the contribution of transition zone between the intact masked and damaged regions to the porosity is negligible. Furthermore, the majority of the porous volume can be preserved as an interconnected pore system by the application of low ion fluence. By increasing the fluence value, however, separated porous volumes can be created at the expense of the total pore volume.
Introduction
Combination of different material systems and structures is a requirement in materials science and technology for creating advanced materials with unique properties.1 The continuous scientific interest in porous materials is well-justified by their potential and realized applications in several fields besides the numerous emerging questions in fundamental research. The inorganic sol–gel materials attracted especially great attention in the last few decades due to their unique properties. Among them mesoporous silica is utilized as low-k2,3 and low refractive index material,4 antireflective5 and self-cleaning coating,6 functional membrane7,8 as well as in the field of catalysis,9,10 sensorics,11,12 drug delivery,13,14 and corrosion protection15,16 in monolith, thin film, or particulate forms.Starting in the last decade the fabrication of nanomaterials17 and surfaces with designed morphologies is still one of the most popular fields in nanotechnology. Surface nanostructures play determining roles in related topics like catalysis,18,19 sensorics,20,21 antibacterial,22,23 superhydrophobic,24,25 and superhydrophilic26,27 surfaces. Besides precise but low throughput and typically area-limited serial methods, different bottom-up approaches gained importance since they are able to create the primary surface structure in a single step on macroscopically large areas. To achieve this, the key moment is the self-assembly of various objects – mainly macromolecules and solid nanoparticles. Researchers created a huge variety of surface pattern types following several strategies, combining different techniques and methods in creative and smart ways – as it was reviewed expansively among others28,29 by Prof. Whitesides' group.30,31 Self-organization of colloidal nanospheres offers an easily achievable masking alternative with a wide range of control over area and dot size – called nanosphere lithography (NSL).32,33 Although NSL is a quite long time established method and ion irradiation-induced colloidal particle shaping as well as ion–nanoparticle interactions have been studied several times,34–37 the utilization of particulate layers as mask against ion implantation or irradiation is not popular yet. Nevertheless, NSL combined with ion implantation has been successfully applied to create laterally periodic doping patterns in Si wafers38 and to form Si surface patterns by local ion-swelling during ion implantation through ordered particulate mask.39–41
Ion-beam techniques are rarely used on porous materials. So far, implantation of doping ions into porous titania was applied to change its optical and electronic properties42 and irradiation with swift heavy ions was used to improve its photocatalytic activity.43 Investigation of several aspects of interactions of H+ and He+ ions with porous silicon can be found in the literature44–47 particularly due to its importance in MEMS as sacrificial layer.48 Recently high energy heavy ions induced radiation damage buildup in mesoporous silica was also investigated.49 It has been demonstrated that ion irradiation-induced anisotropic deformation is universal phenomenon in amorphous structures. The process is assumed to be accompanied by the relaxation of irradiated material due to atomic rearrangements in regions with a local free volume. A conspicuous appearance of the effect is that small objects like colloidal silica particles and amorphous Si pillars change their shape drastically due to irradiation-induced deformation (also called ion hammering) even at low ion energies in the 100 keV range.34 On the other hand, as related phenomenon, it was shown that ion bombardment is suitable to survey along the ion track the irradiation-induced densification in porous samples. Previous works indicated that compaction in this case is caused mainly by the collision cascades.46 Consequently the production of sharp buried compact layers in porous materials as vertical patterning has been proposed. We show that, in addition, the lateral patterning of porous structures become also feasible. We also pay attention to the effect of the original nature (ordered or random) of the pore network on the modified structure – a feature yet disregarded.
In this study we aimed to combine the advantages of mesoporous character and surface morphology at the sub-micron scale preserving the interconnected pore system or creating separated porous volumes bordered by nonpermeable compact zones as a result of ion bombardment. Mesoporous silica thin films were prepared by sol–gel method with ordered and disordered pore system using molecular templates. Hexagonally ordered Langmuir–Blodgett films of spherical silica particles were applied as mask against ion irradiation. The ion energy was chosen according to Monte-Carlo simulations to achieve high lateral contrast in ion transmittance taking into consideration the layer thicknesses. The surface morphology was created by the ion hammering effect, i.e., the bombarding ions densified the material where they could penetrate through the particulate mask. The effect of the applied ion fluence was studied on the resulted surface morphology and pore structure in comparison to the original character of the pore system.
Experimental
Materials
Tetraethyl-orthosilicate (TEOS, for synthesis, >99%, Merck), absolute ethanol (EtOH, a.r., >99.7%, Reanal), hydrochloric acid (HCl, purum, 37%, Fluka), and deionized water (18.2 MΩ cm, purified with a Millipore Simplicity 185 filtration system) were used as starting materials for silica precursor sol synthesis. In order to prepare mesoporous silica coatings cetyltrimethylammonium bromide (CTAB, cationic surfactant, 99+%, Acros Organics) or Pluronic PE 10300 triblock copolymer (Pluronic, non-ionic surfactant, BASF, Ludwigshafen Germany) templates were used during precursor sol synthesis.Silicon (Si) wafers (Siegert, (100), p-type, 1–30 Ω cm, prime grade) and microscope glass slides (76 × 26 × 1 mm, Thermo Scientific, Menzel-Gläser) were used as solid substrates of the coatings. Substrates were cleaned before layer deposition using 2-propanol (2-PrOH, a.r., >99.7%, Reanal) and deionized water (18.2 MΩ cm).
For nanoparticle synthesis tetraethyl-orthosilicate (98% GC-grade, Merck; TEOS), absolute ethanol (a.r. 99.7%, Reanal) and ammonium hydroxide (25% aqueous solution of NH3, a.r., Reanal) were used as received. For the Langmuir film experiments chloroform (ultra-resi analyzed, 99.8%, Baker), and deionized water (18.2 MΩ cm), purified with a Millipore Milli-Q filtration system were used.
The impregnation experiments were carried out using Rhodamine 6G (R6G, 95%, Sigma-Aldrich) dye.
Synthesis of precursor sols
Silica precursor sols were prepared by the acid catalyzed, controlled hydrolysis of tetraethyl-orthosilicate in ethanolic media. 0.1 M aqueous solution of hydrochloric acid was used as catalyst. In case of precursor sol of compact silica coatings the molar ratios for TEOS![[thin space (1/6-em)]](https://www.rsc.org/images/entities/char_2009.gif) :EtOH:H2O:HCl were 1:18.6:5.5:0.001. The mixture was stirred for 1 hour at room temperature. Porous silica coatings were prepared from precursor sols containing surfactant templates: 1.5 g CTAB or 2 g Pluronic surfactant was dissolved in 22 mL EtOH, similarly as presented by Vaishnavi et al.50 In both cases EtOH, TEOS and 0.1 M HCl were mixed in another beaker. In case of precursor sols of porous coatings the same molar ratios were applied as for the preparation of precursor sol of compact coatings. Both mixtures were stirred for 30 minutes at room temperature and for additional 30 minutes after mixing the two solutions.
:EtOH:H2O:HCl were 1:18.6:5.5:0.001. The mixture was stirred for 1 hour at room temperature. Porous silica coatings were prepared from precursor sols containing surfactant templates: 1.5 g CTAB or 2 g Pluronic surfactant was dissolved in 22 mL EtOH, similarly as presented by Vaishnavi et al.50 In both cases EtOH, TEOS and 0.1 M HCl were mixed in another beaker. In case of precursor sols of porous coatings the same molar ratios were applied as for the preparation of precursor sol of compact coatings. Both mixtures were stirred for 30 minutes at room temperature and for additional 30 minutes after mixing the two solutions.
Preparation of coatings
All types of coatings were deposited onto (100) Si wafers. For spectrometric analysis microscope glass slides were also used as solid substrates for layer deposition. Glass slides and Si wafers were erased with 2-PrOH impregnated cotton, then rinsed with 2-PrOH and distilled water. Substrates were dried at room temperature before layer deposition. Sol–gel coatings on glass and Si substrates were prepared from the precursor sols by the dip-coating method (dip coater built in MTA MFA, Hungary). Cleaned and dried substrates were immersed into the precursor sol and pulled out with a constant speed. The resulted layer thickness can be adjusted by choosing appropriate withdrawal speed according to the Landau–Levich equation. To ensure the comparability of the samples with different porosity the solid content was kept constant by controlling the layer thicknesses of the different samples. Withdrawal speeds were 20 cm min−1 for compact silica coating, 18 cm min−1 for CTAB-templated porous silica layer deposition, and 16 cm min−1 in the case of Pluronic-templated porous silica coating formation.The deposited films were annealed in a drying oven (Nabertherm B170) at 450 °C for 1 hour with a heating rate of 20 °C min−1.
Synthesis of silica particles and preparation of Langmuir–Blodgett films
The silica particles were prepared according to Stöber's method51 by controlled hydrolysis of tetraethyl-orthosilicate. The diameter of prepared silica particles was 500 nm with standard deviation of about 7%. To spread the nanoparticles at the air–water interface in a Langmuir-trough (KSV 2000), the particles dispersed in ethanol were diluted with chloroform (1:2 volume ratio) and sonicated for 10 minutes right before spreading. The nanoparticles were spread at the water–air interface using a Hamilton syringe. When chloroform evaporated (ca. 10 minutes) the particles were compressed with a barrier speed of 0.4 cm2 s−1. As the surface pressure reached the value of 1 mN m−1, the compression speed was lowered to 0.2 cm2 s−1. The Langmuir–Blodgett (LB) films were prepared by vertical withdrawal (4 mm min−1) at the surface pressure of ca. 13.5 mN m−1, i.e. at 80% of the collapse pressure (17 mN m−1) of the Langmuir film.
Ion irradiation
Ion irradiation of 15 × 30 mm2 rectangular Si supported samples with a tilt of 7° with respect to the surface normal was performed at room temperature with 200 keV Xe+ ions at fluences of 0.1, 0.5, and 1 × 1016 cm−2 through LB masks of silica particles with the diameter of 500 nm in the Heavy Ion Cascade Implanter operated at the Institute for Particle and Nuclear Physics of the Wigner Research Centre for Physics in Budapest. For all fluence values a part of all samples was uncovered by the LB film and also a part of the samples was masked with a metal plate. The ion beam with typically millimetre dimensions was x-y scanned across the full sample surface in order to achieve good homogeneity of irradiation within the exposed area. The current density for the scanning beam was ∼70 nA cm−2. The normalized depth distribution for the bombarding ions in the silica spheres along the z-axis (perpendicular to the sample surface) was determined from full-cascade SRIM simulations.52 The result of calculation is represented in Fig. 1 for a masking silica particle with diameter of 500 nm and density53 of 2.06 g cm−3 for 200 keV Xe+ ions with the fluence of 1016 cm−2. The main steps of sample preparation are summarized in Fig. 2 for clarity. | ||
| Fig. 1 Schematic view of 200 keV Xe+ ion bombardment with the fluence of 1016 cm−2 through a silica sphere with diameter of 500 nm. The solid line shows the ion profile resulted by SRIM simulations. | ||
 | ||
| Fig. 2 Schematics of the key step of sample preparation: ion irradiation with 200 keV Xe+ through an ordered monolayer of silica spheres then removal of the particles. | ||
Characterization methods
The obtained transmittance curves were analyzed in terms of thin layer optical models. Transmittance spectra of coatings were fitted with a homogeneous layer model54 supposing perpendicular angle of incidence and identical homogeneous layers on both sides of the transparent substrate. The fitting procedures provided effective refractive index and layer thickness values. As the glass substrate had weak absorption, the transmittance spectra were corrected before fitting to eliminate this effect.54,55 The fitting procedure used a Levenberg–Marquardt algorithm.56 The porosity of coatings was estimated using the Lorentz–Lorenz formula.57–59
Results and discussion
Optical properties
For optical characterization of the samples transmittance spectra were measured on uncoated glass substrates and on all types of silica coatings supported by glass substrates. Three parallel sample sets were prepared in each case. Fig. 3 shows the representative transmittance curves of the different types of samples and the transmittance of the bare glass substrate as well. The silica coatings show higher transmittance than their uncoated glass substrates for the whole studied wavelength range. It is attributed to the lower effective refractive index value of the investigated coatings (see Table 1) than that of their bare glass substrate (nglass = 1.519). | ||
| Fig. 3 Transmittance spectra of the uncoated glass substrate, the CTAB- and Pluronic-templated SiO2 samples. | ||
| Sample | Results of fitting | Porosity [%] (Lorentz–Lorenz) | |
|---|---|---|---|
| Effective refractive index | Layer thickness [nm] | ||
| Pluronic-templated SiO2 | 1.3154 (±0.0018) | 238 (±3) | 29 (±0.5) |
| CTAB-templated SiO2 | 1.3457 (±0.0008) | 204 (±3) | 22 (±0.5) |
The optical parameters of both types of silica coatings were determined applying fitting procedures. The layer thickness and effective refractive index values are presented in Table 1. The reduced chi-square values of the fitting were in the range of 10−7 to 10−8, and the coefficient of determination (R2) values were above 0.999 which indicated a good agreement between measured and calculated spectra. The porosity values calculated in view of the effective refractive indices of the coatings and refractive index of the bulk silica (nbulk = 1.460) and air (nair = 1) are also listed in Table 1.
Surface morphology by AFM measurements
Following the ion bombardment of the porous silica coatings the ordered particulate LB mask was removed mechanically. The existence of ion-induced surface structures was obvious at once thank to the white light diffraction on the resulted morphology which was observable even by naked eye. These surface structures were analysed by AFM. The measurements confirmed the occurrence of the expected ion hammering effect. For both type of samples and all applied fluence values remarkable steps can be measured where the edges of the LB masks were located, as represented in Fig. 4(a). Furthermore, the analysis revealed that the silica particles proved to be non-transparent around their centres for the 200 keV Xe+ ions in all cases, as expected from the Monte-Carlo simulations (see Fig. 1). The evidence can be seen in Fig. 4(b) where the upper level of resulted columnar structure is equivalent to the original surface level of the porous silica coating (which was masked by an additional metal plate). The aspect ratio of resulted morphology, i.e., the depth of the canyons compared to their width proved to be too high to accurately characterize them using commercial AFM tips even in case of the lowest fluence. Fig. 5 shows the typical measured surface morphology for Pluronic and CTAB-templated silica coatings irradiated with Xe+ fluences of 0.1, 0.5, and 1 × 1016 cm−2, respectively. The created surface structures are very similar to each other since the LB mask provided high contrast in all cases. It can be observed that the edges of the columns are slightly rounded where the Xe+ ions could pass through the edge of the silica spheres. Because of the high aspect ratio of the structure the maximum value of the z-scale depends on the largest distance between two columns and on the actual tip geometry. | ||
| Fig. 4 3D representations of surface morphology measured by AFM on Pluronic-templated silica coatings after ion irradiation with fluences of (a) 1015 cm−2 and (b) 1016 cm−2, respectively. The measurements were carried out (a) where the edge of the particulate LB mask was located and (b) at the border of irradiated and unirradiated regions of the LB film (the right side was masked by an additional metal plate). | ||
 | ||
| Fig. 5 Columnar surface morphology measured by AFM on (a–c) Pluronic and (d–f) CTAB-templated silica coatings irradiated with Xe+ ions through LB mask of silica particles with fluences of 0.1, 0.5, and 1 × 1016 cm−2, respectively. Please note that the maximum value of z-scale depends on the largest distance between two columns and on the actual tip geometry. | ||
It is worth to mention that the surface of the sol–gel layers uncoated with the LB mask both before and after ion bombardment were also characterized. The surfaces proved to be smooth in all cases, the determined RMS values are in the range of 0.23–0.25 nm measured on a 5 × 5 μm2 area before and after the ion irradiation, independently from the type of template molecules and the applied ion fluences.
Ion irradiation-induced step heights by profilometry
In case of all samples a part of the surface area was irradiated using a metal plate as mask instead of the particulate LB film. The step heights between the irradiated and unirradiated areas resulted by ion-hammering were measured by a profiler in ten line scans along the created step on each samples. Typical measured profiles are shown in Fig. 6. The resulted average step height values and their standard deviation are collected in Table 2. Comparing the results it can be established that the densification of the Pluronic-templated porous silica coatings reaches its maximum as low as the fluence of 1015 cm−2, while for CTAB-templated coatings the step height is near to its maximum at the lowest fluence and the degree of densification is significantly higher than for the Pluronic-templated samples, as it can be seen from the calculated thickness changes in Table 2. It is worth noting that the porosity of the CTAB-type samples was found to be lower, see Table 1. | ||
| Fig. 6 Typical ion irradiation-induced step profiles measured by a profiler on (a) Pluronic-templated and (b) CTAB-templated silica coatings irradiated with different Xe+ fluences. | ||
| Sample | Average step height and thickness change at different ion fluences | ||
|---|---|---|---|
| 1015 cm−2 | 5 × 1015 cm−2 | 1016 cm−2 | |
| Pluronic-templated SiO2 | 121 ± 1 nm | 114 ± 1 nm | 115 ± 1 nm |
| 51 ± 0.4% | 48 ± 0.4% | 48 ± 0.4% | |
| CTAB-templated SiO2 | 118 ± 1 nm | 127 ± 3 nm | 125 ± 1 nm |
| 58 ± 0.5% | 62 ± 1.5% | 61 ± 0.5% | |
HRTEM analysis of the pore structure
Fig. 7 shows the HRTEM images of the pore structure of original, unirradiated Pluronic- and CTAB-templated porous silica coatings. The plan view HRTEM image of Pluronic-type silica revealed disordered arrangement of interconnected pores that appear with dark contrast features as shown in Fig. 7(a) due to the over-focused imaging.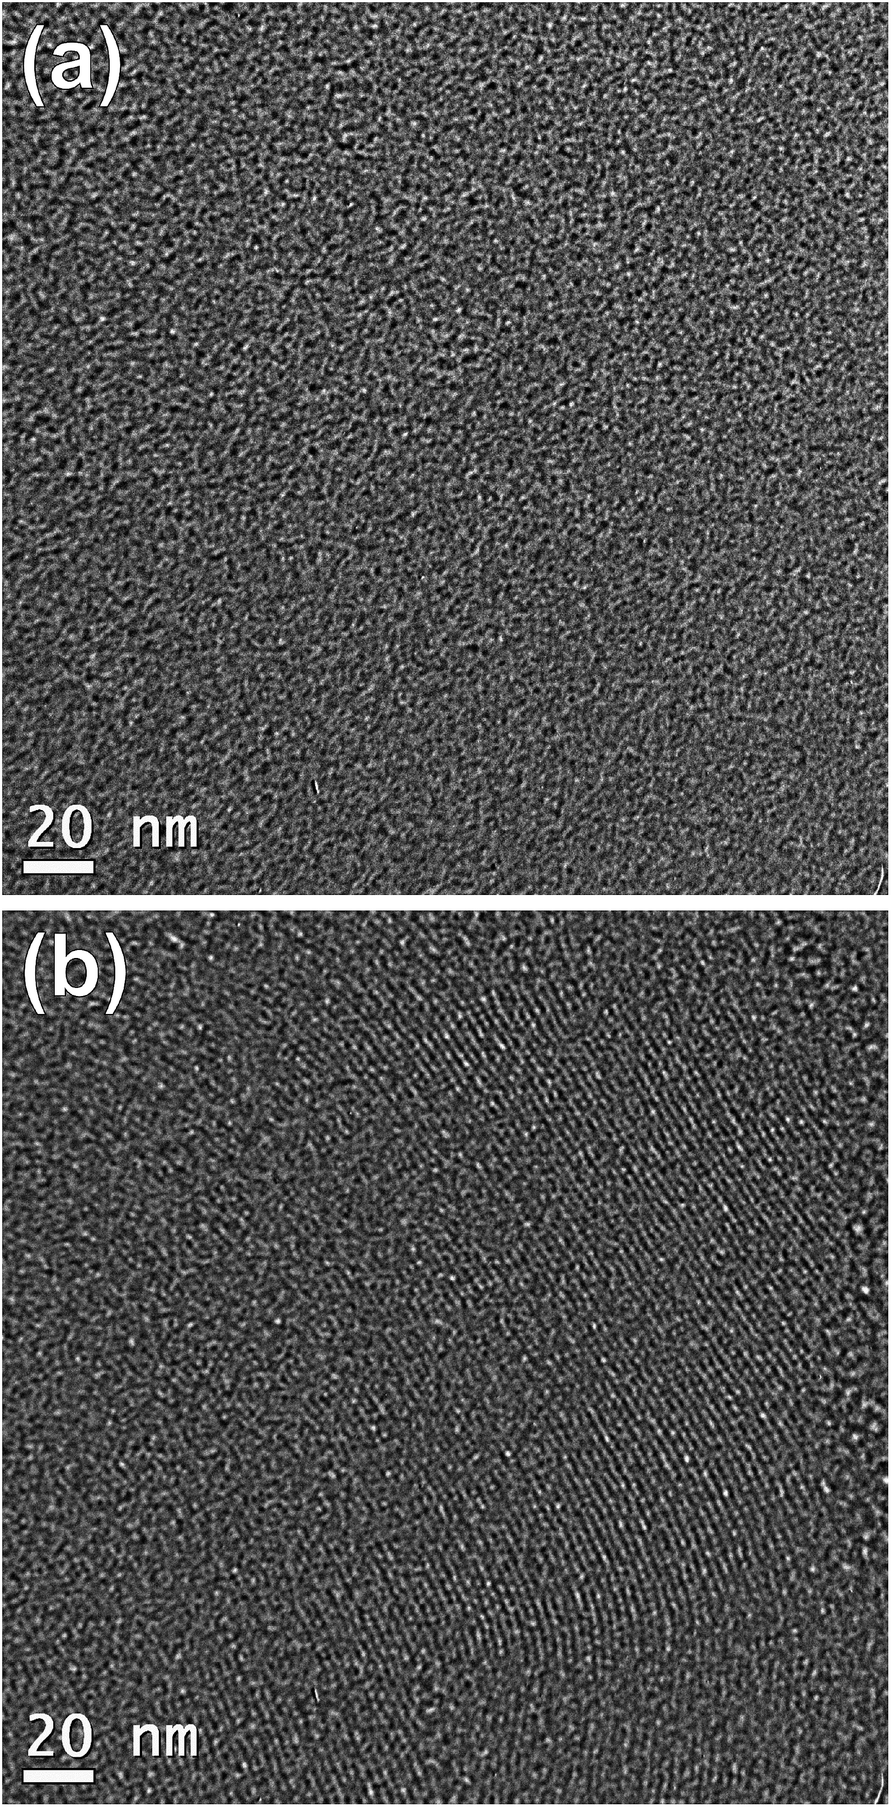 | ||
| Fig. 7 HRTEM images of unirradiated (a) Pluronic- and (b) CTAB-templated porous silica coatings. | ||
The plan view image of the CTAB-templated sample in Fig. 7(b) represents a typical area of an ordered, hexagonally close-packed pore structure appearing with bright contrast. The different pore structures were analysed by Fast Fourier Transformation (FFT). The distance between the pore-centres was found to be 7.5 nm and 3.6 nm for Pluronic- and CTAB-templated coatings, respectively. More detailed analysis of such pore structures was reported previously.16
Pluronic- and CTAB-templated silica samples irradiated with Xe+ fluences of 1 × 1015 cm−2 and 1 × 1016 cm−2 were prepared for cross-sectional HRTEM analysis. Although the resulted surface structures were very similar in the AFM images, see Fig. 5(a–f), HRTEM revealed important differences. Fig. 8(a) shows two structured porous Pluronic-templated silica coatings, side by side, in cross-sectional view. The thickness of the silica coatings was measured to be 244 nm at the positions where the silica spheres perfectly masked the ion irradiation.
 | ||
| Fig. 8 Cross-sectional HRTEM images of Pluronic-templated silica coatings irradiated with Xe+ fluences of (a and b) 1015 cm−2 (denoted as “P1”) and (a, c and d) 1016 cm−2 (“P3”) through the particulate mask. The inset shows the EELS image of the same area as in (b). Note that the plane of cross section does not necessarily intersect the axis of the porous columns. | ||
“P1” label denotes the silica coating bombarded with the fluence of 1015 cm−2. In the face of it “P3” nominates the sample irradiated with the highest fluence. A spectacular difference is not the most important: for the lowest Xe+ fluence the implanted ions created small bubbles between the porous columns, while for the highest fluence they were accumulated and formed big bubbles. Taking a closer look it can be seen that the pore structure is intact inside the columns and in the central area of the top surface where the silica spheres masked perfectly the bombarding ions at both fluence values. The original, disordered pores can be seen in Fig. 8(b) as bright features inside the column while the densified parts appear as dark regions where the ions destroyed the pore structure through the ion-hammering effect. In these regions – i.e. near the surface between and at the edges of the columns – the silica became dense, no pores can be found. In deeper regions, where the ions stopped, small bubbles were formed. They give remarkable contrast in the EELS image in the inset of Fig. 8(b). The pore structure remained interconnected near the silica–Si interface and shallow amorphized areas can be observed in the Si substrate. Contrarily, the border regions between the porous columns are fully densified in case of the highest fluence as can be seen in Fig. 8(c and d). The intact pore structure of the masked volumes is separated by dark, non-porous regions and the large bubbles formed by the implanted atoms are also surrounded by dense silica. Furthermore, the amorphized areas are significantly deeper in the silicon substrate. The most important feature is that the interconnected or separated character of the pore system can be tailored by the ion fluence while the created surface morphology is essentially the same in both cases.
For CTAB-templated samples the results are similar from several points of view as can be seen in Fig. 9(a). Here “C1” and “C3” denote the silica coating irradiated with the fluences of 1015 cm−2 and 1016 cm−2, respectively. The original layer thickness was measured to be 209 nm. The ordered pore structure is intact where the silica spheres masked perfectly the ion-bombardment, as it is well observable in case of the lowest fluence in Fig. 9(b). Here the dark, densified region is thicker than for the Pluronic-templated sample. The small Xe-bubbles are not so characteristic but they still can be found near the silicon surface. Though the ordered pore system was destroyed here, the material is not perfectly dense, since the pores can be still seen as bright features. The amorphized regions are deeper in the silicon substrate due to the lower original layer thickness. The effect of the ion fluence can be well recognized in Fig. 9(c). In case of the highest fluence big Xe-bubbles were formed similarly to the Pluronic-templated coatings. Furthermore, the ordered pore structure remained intact in a much smaller volume compared to the CTAB-templated sample implanted with lower fluence (“C1”) or to the Pluronic-type coating irradiated with the same fluence (“C3”). In Fig. 9(d) the collapse of the pore system and the densification of the silica can be well observed. The ordered porous volumes are fully separated by the regions exposed to ion-hammering while the original pore structure reaches the surface at the centre of the column. The amorphized silicon pits are also deeper in this case. The FFTs of marked regions in Fig. 9(b) and (d) verify the intact (I) and degraded (II) structure of the mesopore system in the masked and irradiated regions, respectively. The period of lattice fringes represented in the magnified images was determined by FFT analysis of the marked ordered regions.
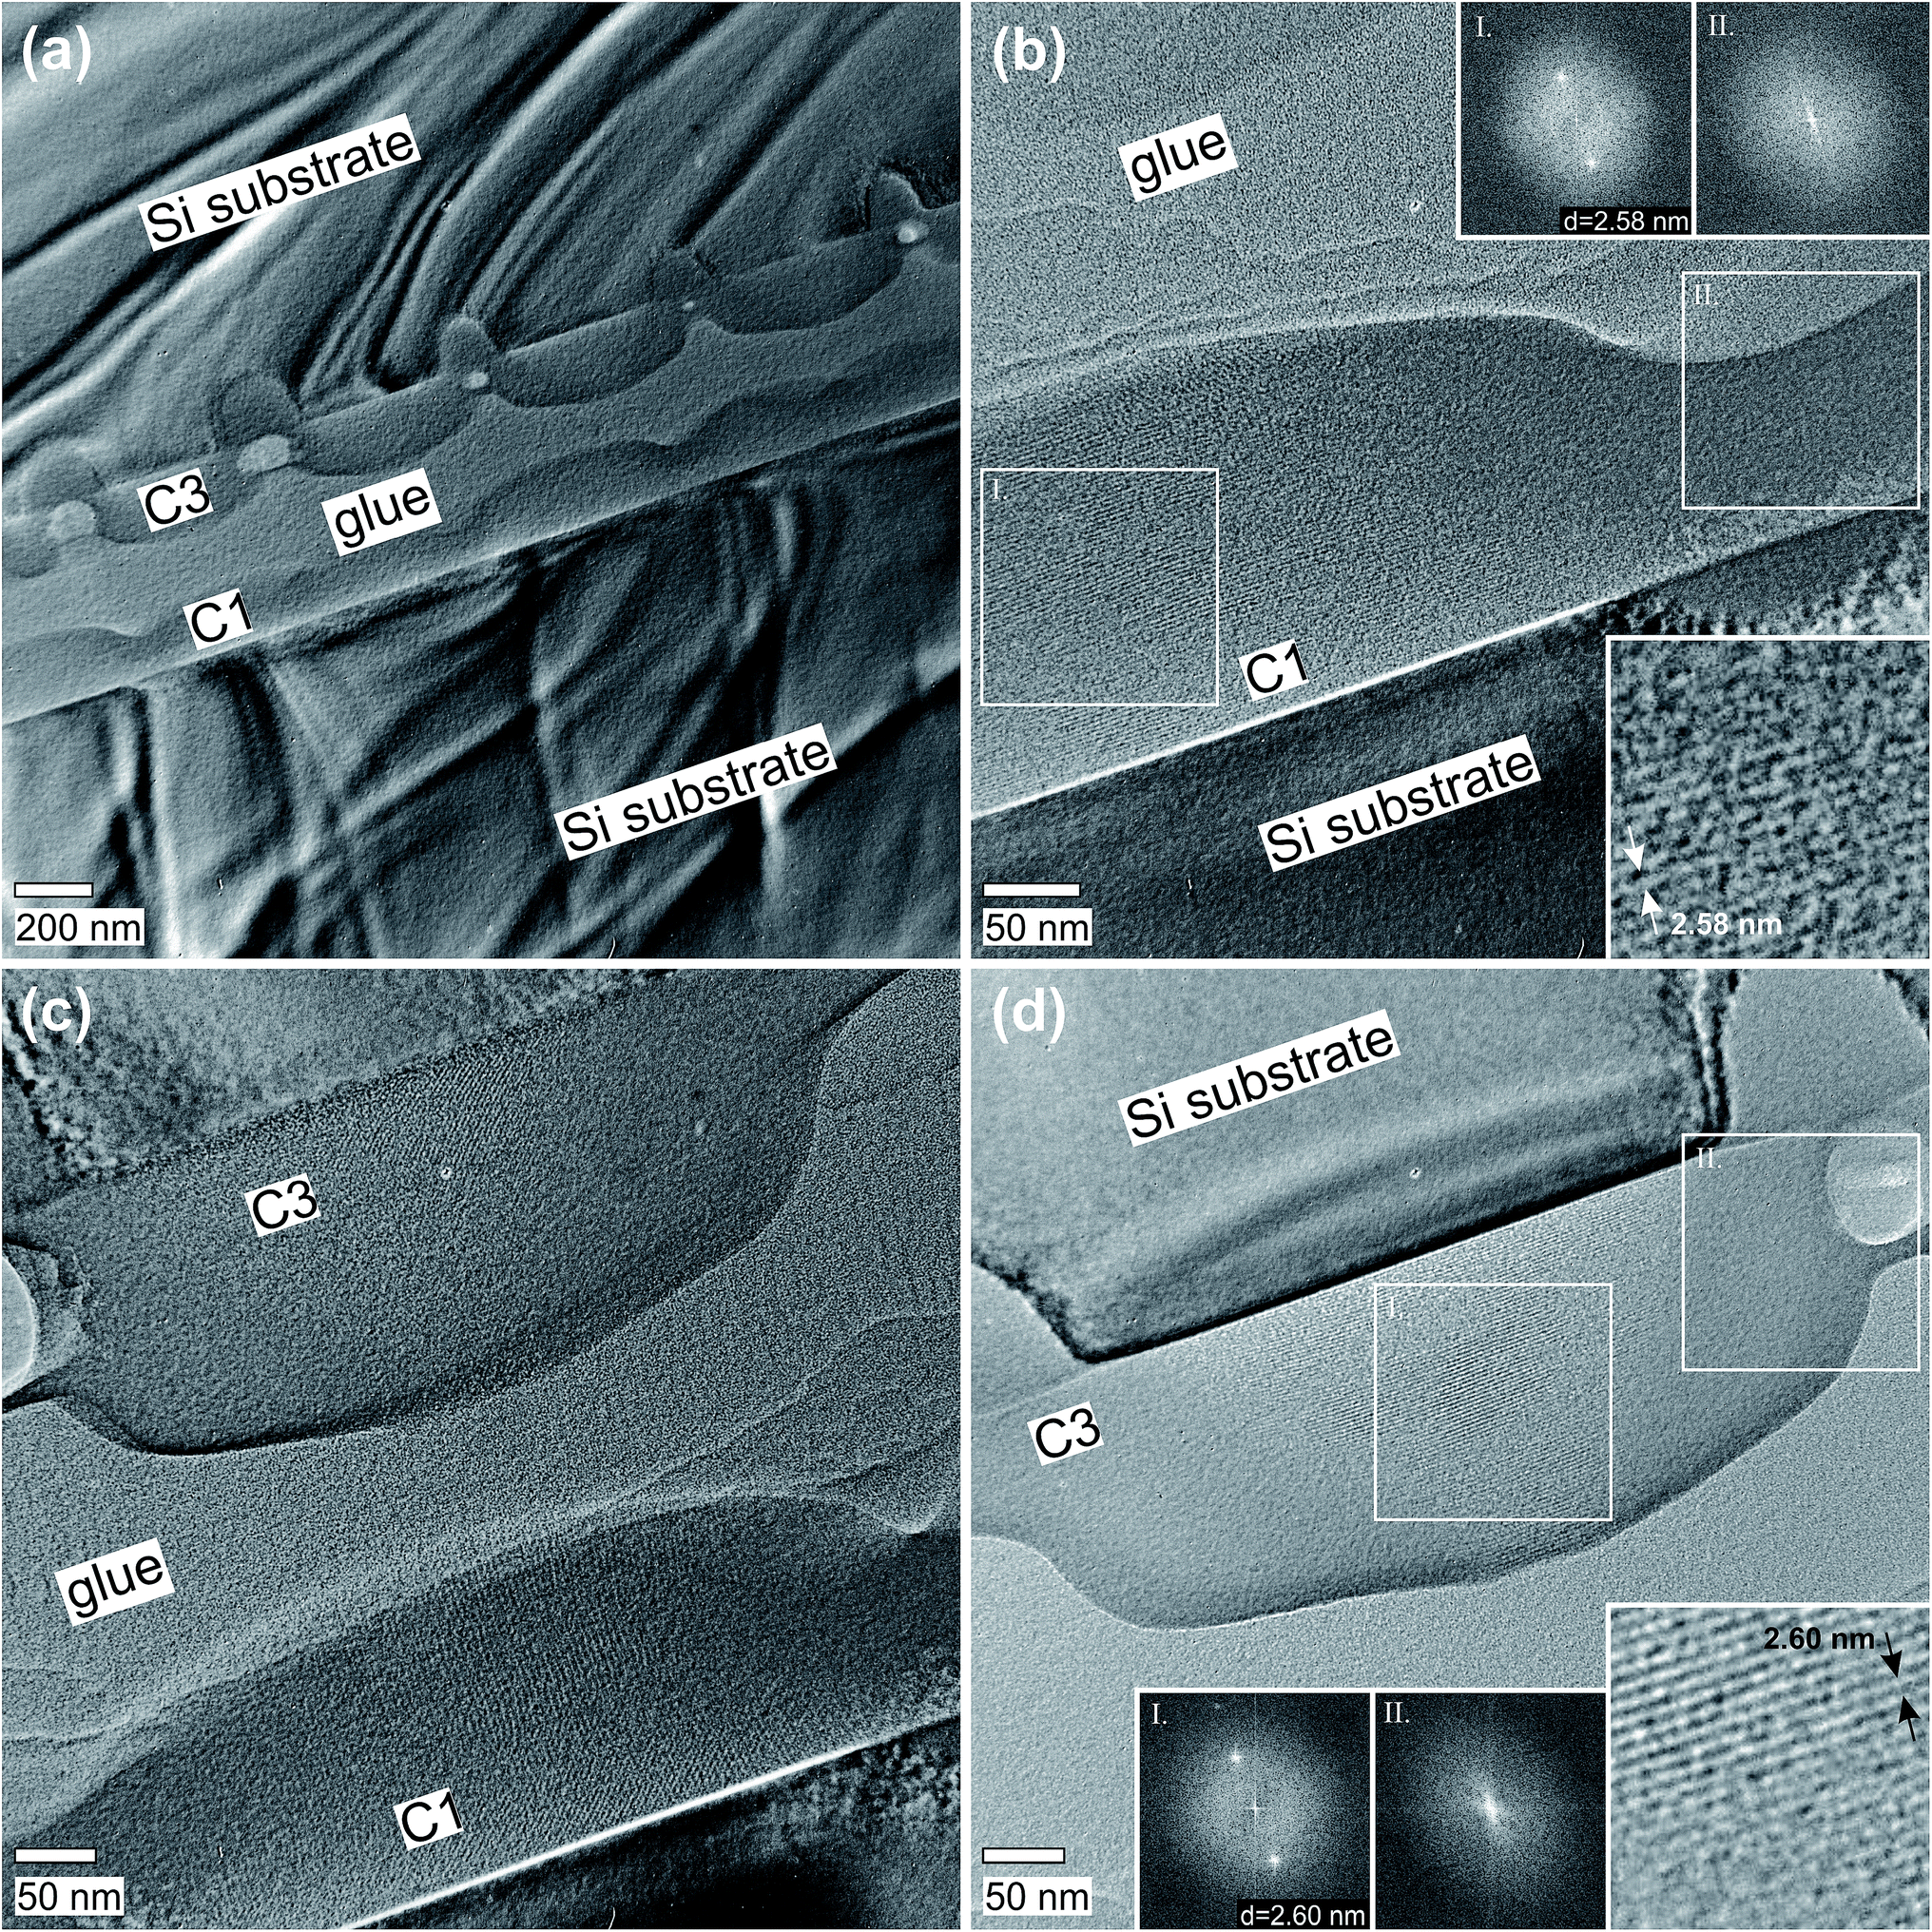 | ||
| Fig. 9 Cross-sectional HRTEM images of CTAB-templated silica coatings irradiated with Xe+ fluences of (a–c) 1015 cm−2 (denoted as “C1”) and (a, c and d) 1016 cm−2 (“C3”). The insets in (b) and (d) show the magnified transition area of the same image between the intact, ordered and the destructed, densified pore structure, and the FFTs of marked regions. | ||
Comparing the results of the two different molecular templates it is obvious that the disordered Pluronic-templated pore system proved to be more resistant against Xe-bombardment, as it was expected from the results of profilometry. For example, the extension of the densified volume for “P1” in Fig. 8(b) and for “C3” in Fig. 9(c) is very similar despite the fact that the difference in fluence is one decade.
Confocal fluorescent imaging
The structured mesoporous coatings were impregnated with 10−4 M aqueous Rhodamine 6G solution. In addition a compact silica sol–gel coating (prepared without any molecular template) was similarly treated as reference sample to verify the availability of the structured pore system. Fig. 10 shows the recorded fluorescent images for Pluronic- and CTAB-templated silica samples irradiated with Xe+ fluences of 1015 cm−2 and 1016 cm−2. Areas of 5 μm × 5 μm were scanned and the confocal fluorescent images were composed from the integrated fluorescent intensity peaks which were measured point by point. Although the narrow densified regions could not be resolved perfectly, the masked, intact porous regions can be clearly seen as bright areas.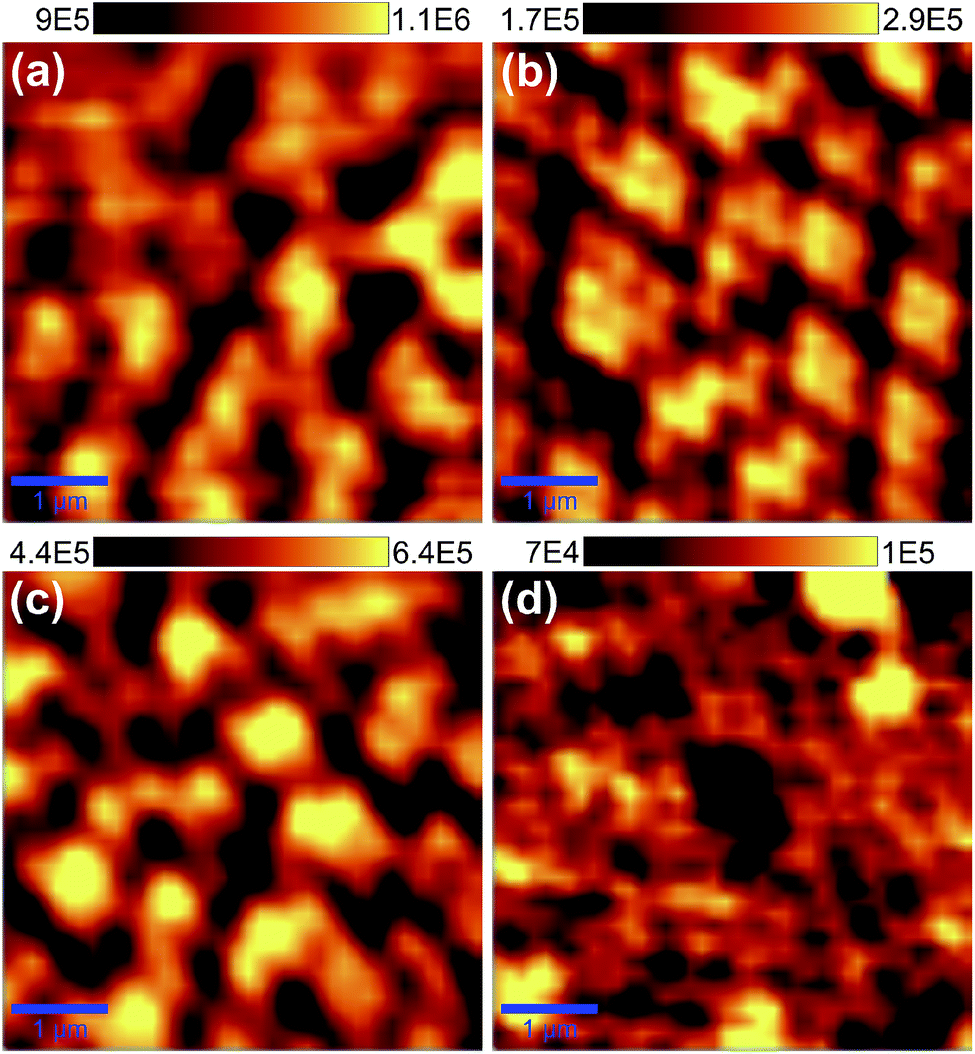 | ||
| Fig. 10 Confocal fluorescent images of (a and b) Pluronic and (c and d) CTAB-templated silica coatings irradiated with Xe+ ions to fluences of 1015 cm−2 and 1016 cm−2, respectively. The upper scale bars show the collected CCD counts. | ||
Comparing the results of Pluronic-type coatings it can be observed that the fluorescent intensity is much higher in case of lowest fluence (Fig. 10(a)), see the upper scale bar for the collected CCD counts. On the other hand, the structure prepared with the highest fluence (Fig. 10(b)) has definitely more contrast while the fluorescent intensity is significantly lower. These findings are in close agreement with the expectations based on the HRTEM analysis in Fig. 8(b) and (d). The fluorescent images of Pluronic-templated coating irradiated with the highest fluence (Fig. 10(b)) and the CTAB-type sample bombarded with the lowest (Fig. 10(c)) fluence are very similar in their contrast and intensity due to the analogous degree of densification shown in the HRTEM images in Fig. 8(d) and 9(c), respectively. As shown in Fig. 9(d), the volume of the intact pore system of the CTAB-type coating irradiated with the highest Xe+ fluence is the smallest. It is in accordance with the fluorescent result in Fig. 10(d). The fluorescent intensities are the lowest and they are close to the values of 4.9 × 10⁴ to 6.1 × 10⁴ measured on the compact silica coating. (Its plain image is not shown.) The fluorescent spectra averaged for each point of the confocal images are shown in Fig. 11 for better comparison of all above-mentioned R6G-treated silica coatings. The measured fluorescent intensities confirm our statements above.
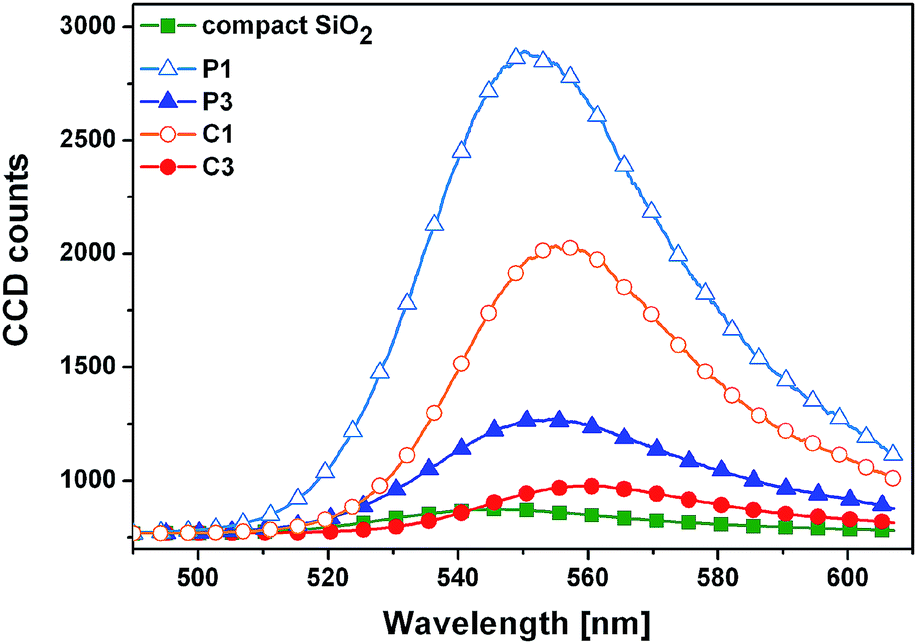 | ||
| Fig. 11 Averaged confocal fluorescent spectra measured on Pluronic- (denoted as “P1” and “P3”) and CTAB-templated (“C1” and “C3”) silica coatings irradiated with ion fluences of 1015 cm−2 (“P1”, “C1”) and 1016 cm−2 (“P3”, “C3”) and impregnated with 10−4 M aqueous Rhodamine 6G solution. A compact silica sol–gel coating was prepared without any molecular template and it was immersed into the same solution for comparison. | ||
Analysis of the pore systems by ellipsometric porosimetry
The nanopatterned porous silica samples were also measured by ellipsometric porosimetry for the quantification of the ratio of available pores and to characterize the pore systems after ion irradiation. The adsorption and desorption isotherms presented in Fig. 12 were taken at 294 K using toluene as adsorptive material. The normalized pore radius distributions were determined by using the modified Kelvin equation and they are shown in the insets of Fig. 12. The sorption isotherms of the Pluronic-templated samples are similar in shape to type IV in IUPAC classification terms64 referring the mesoporous character of the coatings. | ||
| Fig. 12 Toluene adsorption–desorption isotherms at 294 K of (a and b) Pluronic and (c and d) CTAB-templated silica coatings irradiated with Xe+ ions with fluences of 1015 cm−2 and 1016 cm−2, respectively, measured by ellipsometric porosimetry. The insets show the normalized pore radius distributions. | ||
The hysteresis loop is of type H2, according to IUPAC classification. It corresponds to materials with interconnected pore system and non-uniform pore sizes.
The hysteresis cycle is quite small which implies that there are not very narrow pore openings, i.e., the pore size distribution is not wide. In case of CTAB-type samples the isotherms are characterized by the sharp step of capillary condensation and no hysteresis can be seen. It is typical for highly uniform cylindrical mesopores with small pore radius. The measured sorption isotherms are almost the same as those which were taken on the original, unirradiated porous silica coatings.16 This fact implies that the pore systems were preserved in the intact regions and collapsed fully where the ions pass through and lost their energy, i.e., the contribution of the transition zones to the porosity – e.g. by presence of micropores – is missing or negligible. For example, the structure in which mesopores and micropores exist together would result in H4 type hysteresis loop.
The measured porosity and pore radius values were collected in Table 3. The porosity of Pluronic-templated coating irradiated with the lowest fluence is somewhat higher than the value determined from optical measurements for the original coating (Table 1). This discrepancy is caused by the different measurement conditions: the transmittance measurements were carried out at room temperature in air while before porosimetry the samples were heated up to 448 K for 20 min in vacuum. The tendency in the porosity change corresponds to the expectations based on the HRTEM and fluorescent measurements. The resulted porosity values underline that by the application of the lowest fluence the high fraction of the porous volume can be preserved as an interconnected pore system besides the fabrication of surface patterns. For higher fluences, however, separated porous volumes can be prepared at the expense of the total pore volume.
| Sample | Xe+ fluence | Porosity [%] | r ads [nm] | r des [nm] |
|---|---|---|---|---|
| Pluronic-templated SiO2 | 1015 cm−2 | 37.9 | 1.5 | 1.5 |
| 1016 cm−2 | 14.2 | 1.5 | 1.4 | |
| CTAB-templated SiO2 | 1015 cm−2 | 20.5 | 0.8 | 0.8 |
| 1016 cm−2 | 7.86 | 0.7 | 0.7 |
Conclusions
The main purpose of the present study was to combine the advantageous properties of mesoporous character and surface morphology at the sub-micron scale preserving the interconnected pore system or creating separated nonpermeable porous volumes. Mesoporous silica thin coatings were prepared by sol–gel method with ordered and disordered pore system using Pluronic PE 10300 and CTAB as molecular templates. Hexagonally ordered Langmuir–Blodgett films of spherical silica particles were transferred on the top of the porous silica coatings and applied as mask against ion irradiation. Monte-Carlo simulations were carried out to choose the energy of the Xe+ ions in order to achieve a high lateral contrast in ion transmittance through the masking silica particles. The surface morphology was created utilizing the ion hammering effect, i.e., the bombarding ions densified the sol–gel layer where they could reach its surface through the openings of the particulate mask.The aspect ratio of resulted morphology was proved to be high; the created surface structures were very similar irrespectively of the type of template molecules and ion fluences applied. The densification of both types of porous silica coatings almost reached its maximum already at the lowest fluence. For CTAB-templated coatings the degree of densification was significantly higher than in the Pluronic-templated ones.
The HRTEM analysis revealed that the pore structure remained intact where the silica spheres were non-transparent for the bombarding ions. For Pluronic-templated silica samples with disordered pore system the pore structure remained interconnected near the Si substrate surface at the lowest fluence. Contrarily, at the highest fluence, the regions surrounding the intact porous columns were fully densified thus forming non-porous border zones. Therefore, the interconnected or the separated character of the pore system can be tailored by the applied ion fluence, while the created surface morphology is essentially the same in both cases. In case of CTAB-templated coatings with ordered pore structure the results were similar. The densified regions are thicker, while the intact porous volumes are smaller than in the Pluronic-templated case irradiated with the same fluence. Comparing the two different molecular templates the disordered Pluronic-templated pore system proved to be more resistant against Xe-bombardment.
The nanopatterned mesoporous coatings were impregnated with aqueous Rhodamine 6G solution and confocal fluorescent measurements were carried out to verify the accessibility of the structured pore system. The Pluronic-type structures prepared with the highest fluence had definitely more contrast while the fluorescent intensity was significantly lower. This is in close agreement with the expectations based on HRTEM analysis. The fluorescent images of Pluronic-templated coatings exposed to the highest fluence and the CTAB-type sample bombarded with the lowest fluence showed similar contrast and intensity due to the similar degree of densification.
The nanopatterned porous silica samples were characterized by ellipsometric porosimetry to quantify the ratio of available pores and to characterize the pore systems after ion irradiation. The results confirmed that the pore systems were either preserved in the intact regions or fully collapsed in the irradiated zones, therefore, the contribution of transition zone to the porosity – e.g. by the presence of micropores – is missing or negligible. The tendency in porosity change fulfils the expectations: the resulted porosity values confirm that for the lowest fluence the majority of the porous volume can be preserved as an interconnected pore system besides the fabrication of surface patterns. In case of higher fluences separated porous volumes can be realized at the expense of the total pore volume.
Acknowledgements
E. Albert's research work was supported by the European Union and the State of Hungary, co-financed by the European Social Fund in the framework of TÁMOP-4.2.4.A/2-11/1-2012-0001 “National Excellence Program”. A. Deák and Z. Osváth acknowledge the János Bolyai Research Fellowships of HAS. Z. Osváth acknowledges the funding from the People Programme (Marie Curie Actions) of the European Union's Seventh Framework Programme under REA grant agreement no. 334377. The financial support of the National Development Agency (Hungarian-Romanian Bilateral Co-operation, SOLGELCOR, TéT_12_RO-1-2013-0011, 664/2013), and European Union's Seventh Framework Programme (Grant No. 310250) is gratefully acknowledged. The research work has been accomplished in the framework of the "BME R+D+I project”, supported by the grant TÁMOP 4.2.1/B-09/1/KMR-2010-0002. Partial support from the Hungarian Research Grant (OTKA K 112114 and OTKA PD 105173) is highly appreciated.References
- K. Ariga, Q. Ji, J. P. Hill and A. Vinu, Soft Matter, 2009, 5, 3562 RSC.
- K. Maex, M. R. Baklanov, D. Shamiryan, F. Lacopi, S. H. Brongersma and Z. S. Yanovitskaya, J. Appl. Phys., 2003, 93, 8793 CrossRef CAS.
- B. D. Hatton, K. Landskron, W. J. Hunks, M. R. Bennett, D. Shukaris, D. D. Perovic and G. A. Ozin, Mater. Today, 2006, 9, 22 CrossRef CAS.
- F. Gillemot, A. Brunet-Bruneau, E. Bourgeat-Lami, T. Gacoin and J. P. Boilot, Chem. Mater., 2010, 22, 2822 CrossRef.
- J. Sun, C. Zhang, C. Zhang, R. Ding and Y. Xu, RSC Adv., 2014, 4, 50873 RSC.
- X. Li, X. Du and J. He, Langmuir, 2010, 26, 13528 CrossRef CAS PubMed.
- Y. Sakamoto, K. Nagata, K. Yogo and K. Yamada, Microporous Mesoporous Mater., 2007, 101, 303 CrossRef CAS.
- Y. Yamauchi and T. Kimura, Chem. Commun., 2013, 49, 11424 RSC.
- C. M. A. Parlett, D. W. Bruce, N. S. Hondow, A. F. Lee and K. Wilson, ACS Catal., 2011, 1, 636 CrossRef CAS.
- N. Pal and A. Bhaumik, RSC Adv., 2015, 5, 24363 RSC.
- M. Xue and J. I. Zink, J. Phys. Chem. Lett., 2014, 5, 839 CrossRef CAS PubMed.
- S. Matsuura, T. Baba, M. Chiba and T. Tsunoda, RSC Adv., 2014, 4, 25920 RSC.
- X. Mei, D. Chen, N. Li, Q. Xu, J. Ge, H. Li, B. Yang, Y. Xu and J. Lu, Soft Matter, 2012, 8, 5309 RSC.
- S. Albarti, G. J. A. A. Soler-Illia and O. Azzaroni, Chem. Commun., 2015, 51, 6050 RSC.
- E. Volentiru, M. Nyári, G. Szabó, Z. Hórvölgyi and L. M. Mureşan, Period. Polytech., Chem. Eng., 2014, 58, 61 CrossRef CAS.
- E. Albert, N. Cotolan, N. Nagy, G. Sáfrán, G. Szabó, L. M. Mureşan and Z. Hórvölgyi, Microporous Mesoporous Mater., 2015, 206, 102 CrossRef CAS.
- A. K. Viswanath, J. Nanosci. Nanotechnol., 2014, 14, 1253 CrossRef CAS PubMed.
- J. Tian, Z. Zhao, A. Kumar, R. I. Boughton and H. Liu, Chem. Soc. Rev., 2014, 43, 6920 RSC.
- H. F. Zarick, W. R. Erwin, J. Aufrecht, A. Coppola, B. R. Rogers, C. L. Pint and R. Bardhan, J. Mater. Chem. A, 2014, 2, 7088 CAS.
- M. E. Stewart, C. R. Anderton, L. B. Thompson, J. Maria, S. K. Gray, J. A. Rogers and R. G. Nuzzo, Chem. Rev., 2008, 108, 494 CrossRef CAS PubMed.
- H. Y. Song, T. I. Wong, A. Sadovoy, L. Wu, P. Bai, J. Deng, S. Guo, Y. Wang, W. Knoll and X. Zhou, Lab Chip, 2015, 15, 253 RSC.
- E. P. Ivanova, J. Hasan, H. K. Webb, V. K. Truong, G. S. Watson, J. A. Watson, V. A. Baulin, S. Pogodin, J. Y. Wang, M. J. Tobin, C. Löbbe and R. J. Crawford, Small, 2012, 8, 2489 CrossRef CAS PubMed.
- W. S. Lee, Y. S. Park and Y. K. Cho, Analyst, 2015, 140, 616 RSC.
- B. Mockenhaupt, H. J. Ensikat, M. Spaeth and W. Barthlott, Langmuir, 2008, 24, 13591 CrossRef CAS PubMed.
- B. N. Sahoo and B. Kandasubramanian, RSC Adv., 2014, 4, 22053 RSC.
- J. P. Fernández-Blázquez, D. Fell, E. Bonaccurso and A. del Campo, J. Colloid Interface Sci., 2011, 357, 234 CrossRef PubMed.
- S. Nishimoto and B. Bhushan, RSC Adv., 2013, 3, 671 RSC.
- R. K. Smith, P. A. Lewis and P. S. Weiss, Prog. Surf. Sci., 2004, 75, 1 CrossRef CAS.
- J. Henzie, J. E. Barton, C. L. Stender and T. W. Odom, Acc. Chem. Res., 2006, 39, 249 CrossRef CAS PubMed.
- X. M. Zhao, Y. Xia and G. M. Whitesides, J. Mater. Chem., 1997, 7, 1069 RSC.
- B. D. Gates, Q. Xu, M. Stewart, D. Ryan, C. G. Willson and G. M. Whitesides, Chem. Rev., 2005, 105, 1171 CrossRef CAS PubMed.
- U. C. Fischer and H. P. Zingsheim, J. Vac. Sci. Technol., 1981, 19, 881 CrossRef CAS.
- J. C. Hulteen and R. P. V. Duyne, J. Vac. Sci. Technol., A, 1995, 13, 1553 Search PubMed.
- T. van Dillen, A. Polman, C. M. van Kats and A. V. Blaaderen, Appl. Phys. Lett., 2003, 83, 4315 CrossRef CAS.
- S. Klaumunzer, Nucl. Instrum. Methods Phys. Res., Sect. B, 2004, 215, 345 CrossRef CAS.
- J. K. N. Lindner, B. Gehl and B. Stritzker, Nucl. Instrum. Methods Phys. Res., Sect. B, 2006, 242, 167 CrossRef CAS.
- J. C. Cheang-Wong, U. Morales, E. Reséndiz, A. López-Suárez and L. Rodríguez-Fernández, Nucl. Instrum. Methods Phys. Res., Sect. B, 2008, 266, 3162 CrossRef CAS.
- N. Nagy, A. E. Pap, A. Deák, E. Horváth, J. Volk, Z. Hórvölgyi and I. Bársony, Appl. Phys. Lett., 2006, 89, 063104 CrossRef.
- J. K. N. Lindner, C. Seider, F. Fischer, M. Weinl and B. Stritzker, Nucl. Instrum. Methods Phys. Res., Sect. B, 2009, 267, 1394 CrossRef CAS.
- N. Nagy, Z. Zolnai, A. Deák, M. Fried and I. Bársony, J. Nanosci. Nanotechnol., 2012, 12, 6712 CrossRef CAS PubMed.
- N. Nagy, Z. Zolnai, E. Fülöp, A. Deák and I. Bársony, Appl. Surf. Sci., 2012, 259, 331 CrossRef CAS.
- K. Oyoshi, N. Sumi, I. Umezu, R. Souda, A. Yamazaki, H. Haneda and T. Mitsuhashi, Nucl. Instrum. Methods Phys. Res., Sect. B, 2000, 168, 221 CrossRef CAS.
- H. Rafik, I. Mahmoud, T. Mohamed and B. Abdenacer, Radiat. Phys. Chem., 2014, 101, 1 CrossRef CAS.
- F. Pászti, A. Manuaba, E. Szilágyi, É. Vázsonyi and Z. Vértesy, Nucl. Instrum. Methods Phys. Res., Sect. B, 1996, 117, 253 CrossRef.
- M. Fried, T. Lohner, O. Polgar, P. Petrik, É. Vazsonyi, I. Barsony, J. P. Piel and J. L. Stehle, Thin Solid Films, 1996, 276, 223 CrossRef CAS.
- A. Simon, F. Pászti, A. Manuaba and A. Z. Kiss, Nucl. Instrum. Methods Phys. Res., Sect. B, 1999, 158, 658 CrossRef CAS.
- E. Galeazzo, W. J. Salcedo, H. E. M. Peres and F. J. Ramirez-Fernandez, Sens. Actuators, B, 2001, 76, 343 CrossRef CAS.
- M. O. S. Dantas, E. Galeazzo, H. E. M. Peres, F. J. Ramirez-Fernandez and A. Errachid, Sens. Actuators, A, 2004, 115, 608 CrossRef CAS.
- S. Dourdain, X. Deschanels, G. Toquer, C. Grygiel, I. Monnet, S. Pellet-Rostaing and A. Grandjean, J. Nucl. Mater., 2012, 427, 411 CrossRef CAS.
- T. S. Vaishnavi, P. Haridoss and C. Vijayan, Mater. Lett., 2008, 62, 1649 CrossRef CAS.
- W. Stöber, A. Fink and E. J. Bohn, J. Colloid Interface Sci., 1968, 26, 62 CrossRef.
- http://www.srim.org .
- G. Tolnai, A. Agod, M. Kabai-Faix, A. L. Kovacs, J. J. Ramsden and Z. Hórvölgyi, J. Phys. Chem. B, 2003, 107, 11109 CrossRef CAS.
- E. Hild, A. Deák, L. Naszályi, Ö. Sepsi, N. Ábrahám and Z. Hórvölgyi, J. Opt. A: Pure Appl. Opt., 2007, 9, 920 CrossRef CAS.
- D. S. Hinczewski, M. Hinczewski, F. Z. Tepehan and G. G. Tepehan, Sol. Energy Mater. Sol. Cells, 2005, 87, 181 CrossRef CAS.
- W. H. Press, B. P. Flannery, S. A. Teukolsky and W. T. Vetterling, Numerical Recipes in C, The Art of Scientific Computing, Cambridge University Press, New York, 1988 Search PubMed.
- L. V. Lorenz, Ann. Phys. Chem., 1980, 11, 70 Search PubMed.
- H. A. Lorentz, Theory of Electrons, Teubner, Leipzig, Germany, 2nd edn, 1916 Search PubMed.
- D. Grigoriev, D. Gorin, G. B. Sukhorukov, A. Yashchenok, E. Maltseva and H. Möhwald, Langmuir, 2007, 23, 12388 CrossRef CAS PubMed.
- http://gwyddion.net .
- G. Sáfrán, N. Szász and E. Sáfrán, Microsc. Res. Tech., 2015, 78, 599 CrossRef PubMed.
- M. R. Baklanov, K. P. Mogilnikov, V. G. Polovinkin and F. N. Dultsev, J. Vac. Sci. Technol., B: Microelectron. Nanometer Struct.--Process., Meas., Phenom., 2000, 18, 1385 CrossRef CAS.
- K. P. Mogilnikov and M. R. Baklanov, Electrochem. Solid-State Lett., 2002, 5, F29 CrossRef CAS.
- S. J. Gregg and K. S. W. Sing, Adsorption, Surface area and Porosity, Academic Press, New York, 2nd edn, 1982 Search PubMed.
| This journal is © The Royal Society of Chemistry 2015 |