The efficient adsorption removal of Cr(VI) by using Fe3O4 nanoparticles hybridized with carbonaceous materials

Hongtao Gao*a, Shuang Lva, Jinbiao Doua, Miaomiao Konga, Dongmei Daia, Chongdian Sib and Guangjun Liu*b
aLaboratory of Inorganic Synthesis and Applied Chemistry, College of Chemistry and Molecular Engineering, Qingdao University of Science & Technology, Qingdao, 266042, P. R. China. E-mail: gaohtao@126.com; Tel: +86-0532-84022681
bDepartment of Chemistry and Chemical Engineering, Jining University, Qufu 273155, China

Received 30th May 2015 , Accepted 6th July 2015

First published on 6th July 2015


Abstract

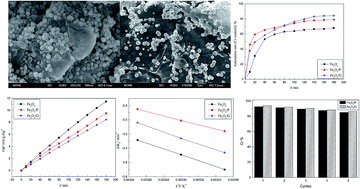
Fe3O4 nanoparticles hybridized with carbonaceous materials, such as pinecone and graphene, were successfully synthesized by a facile hydrothermal method, which could be applied for Cr(VI) removal in aqueous solution. The nanocomposites were characterized by X-ray diffraction (XRD), scanning electron microscopy (SEM) and N2 adsorption–desorption isotherms. Due to the combination of pinecone and graphene, both the surface properties and morphologies of Fe3O4 were modified. Fe3O4 spherical particles were distributed and firmly anchored on the loose surface of pinecone or wrinkled graphene layers. The specific surface area increased from 23.85 to 27.86 and 121.17 m2 g−1 for Fe3O4/P and Fe3O4/G, respectively. It enhanced the adsorption capacity for Cr(VI) of Fe3O4/P (62.5 mg g−1) and Fe3O4/G (78.5 mg g−1). Study of the kinetics and isotherms showed that the pseudo-second-order kinetic and Langmuir isotherm models fitted the adsorption data well. There were three steps in the adsorption process, namely an instantaneous adsorption step, intraparticle diffusion and a final equilibrium stage. The reaction rate decreased along with temperature increasing, which indicated that Cr(VI) adsorption was an exothermic process. The Ea values were 34.39, 25.77 and 34.92 kJ mol−1 for Fe3O4, Fe3O4/P and Fe3O4/G, respectively, which illustrated that the adsorption of Cr(VI) onto the surface of the nanocomposites was a physical process. In no more than 5 h, about 92.6% and 94% Cr(VI) were desorbed from the surface of Fe3O4/P and Fe3O4/G, respectively, which indicated that the adsorption–desorption process for Cr(VI) was reversible. The results demonstrated that Fe3O4/P and Fe3O4/G exhibited excellent adsorption performance in the removal of Cr(VI). It was proved that carbonaceous materials, such as pinecone or graphene, could enhance the adsorption performance of Fe3O4, and could be used as adsorbents to remove heavy metals in industrial effluents.

Introduction

Due to its high chemical toxicity, bio-accumulative effect, inability for self-purification, easy migration and transformation, heavy metal pollution has brought a serious threat to the ecological environment and human survival.1,2 Among the various heavy metals, chromium (Cr) is one of the most toxic pollutants generated by the electroplating, metal processing and textile industries. Cr(VI) is more hazardous than Cr(III) as it can diffuse as CrO42− or HCrO4 through cell membranes and oxidize biological molecules.3 At present, some physical and chemical methods, such as adsorption, ion exchange, dialysis, precipitation and extraction, have been used to remove heavy metal ions from wastewater.4,5 Among these methods, adsorption is one of the most economically favorable and effective technologies.

Recently, a variety of adsorbents have received much attention for the removal of Cr(VI). Metal–organic frameworks based on Cu–benzenetricarboxylates have been used for the adsorption of Cr(VI) from aqueous solution, whose maximum adsorption capacity was 48 mg g−1.6 The adsorption capacity of fly ash coated by chitosan for Cr(VI) was 36.22 mg g−1.7 A highly mesoporous melamine-formaldehyde resin showed enhanced adsorption capacity (66.65 mg g−1) and selectivity for Cr(VI).8 BaTiO3@SBA-15 nanocomposite was used as an adsorbent for the removal of Cr(VI)-contaminated water and it showed an adsorption capacity of 98.2 wt% within only 40 min contact time in a batch reactor.9

Fe3O4 nanoparticles with various controlled morphologies own some unique physicochemical properties, such as variable electronic structures, large specific surface area, and good adsorption ability. Moreover, due to its easy synthesis and magnetic property which makes it be easily separable, Fe3O4 magnetic nanoparticles have attracted much interest. Fe3O4 nanocrystals showed excellent electrochemical sensing performances toward heavy metal ions.10,11 Magnetic gelatin showed an excellent adsorption capacity to offer rapid Cr(VI) removal from water within 50 min.12 The adsorption efficiency of Fe3O4 magnetic particles for Cr(VI) was enhanced in the absence of ultrasound. Some strategies, such as combination with other metal oxide, structure and surface modification, have been adopted to improve adsorption efficiency and capacity of Fe3O4 for heavy metal contaminant. 3-Aminopropyltriethoxysilane was used to regulate the surface of magnetic Fe3O4 to enhance the adsorption efficiency of metal ions.13 Easily separable humic acid coated magnetite nanoparticles were employed for effective adsorption and reduction of toxic Cr(VI) to nontoxic Cr(III).14

The properties of Fe3O4 could be modified by combining with carbon materials. Magnetic iron oxide chitosan composites have been widely used for the treatment of water polluted with metal and organic materials.15 Pine bark waste was used to prepare magnetic biochar composite for adsorption removal of Pb(II) and Cd(II).16 The maximum adsorption capacity of magnetic chitosan nanoparticles was calculated as 55.80 mg g−1, for removal of Cr(VI) from aqueous solution.3 G. Yang reported a novel nitrogen-functionalized magnetic ordered mesoporous carbon, which was proved to be a superior adsorbent for simultaneous removal of lead and phenol contamination from water.17 Iron oxide nanoparticles-doped carboxylic ordered mesoporous carbon was proved to be excellent treatment agent for rapid adsorption of organic pollutants from industrial effluents.18 Polyacrylonitrile-based activated carbon fibers,19 and imidazolium ionic liquid functionalized magnetic carbon nanotubes exhibited high adsorption sensitivity, selectivity and capacity in removal Cr(VI) from water.20

Owing to excellent conductivity, superior chemical stability and high specific surface area, graphene has attracted a great deal of attention in recent years. By hybridizing with graphene sheets, the adsorption performance porous Fe3O4 hollow microspheres were enhanced, and the maximum sorption capacity for Cr(VI) was 32.33 mg g−1.21,22 The surface charge-tunable Fe3O4 nanoparticles for removal of dye pollutants was enhanced by reversibly binding to graphene.23 The water-soluble Fe3O4 nanoparticles could disperse onto graphene uniformly.24 The interaction between the graphene and Fe3O4 particles could prevent graphene nanosheets from restacking and Fe3O4 particles from agglomeration.

In this paper, environment-friendly carbon materials, such as pinecone and graphene, have been hybridized with Fe3O4 nanoparticles to improve the adsorption efficiency and capacity for Cr(VI). The products were characterized by X-ray diffraction (XRD), scanning electron microscopy (SEM) and nitrogen adsorption–desorption isotherm. Batch experiments was carried out to investigate the adsorption performance of nanocomposites for the removal of Cr(VI) from aqueous solution. Furthermore, the adsorption kinetics and isotherms, intraparticle diffusion process, thermodynamics and the mechanism of sorption reaction have also been investigated. Not only Fe3O4/pinecone (Fe3O4/P) but also Fe3O4/graphene (Fe3O4/G) exhibited more excellent adsorption performance in the removal of Cr(VI), compared to pristine Fe3O4. It indicated that hybridization of carbonaceous materials could improve the adsorption performance for heavy metal ions.

Experimental

Materials

All the chemicals were of analytical grade and used without further purification. The pinecone was calcined in the muffle furnace at the temperature of 400 °C for 3 h. Then the obtained powder was used as biochar carbonaceous material to prepare the adsorbent. The graphene used in this work was synthesized by modified Hummer method.25

Synthesis of adsorbents

A typical synthesis process for the Fe3O4/P and Fe3O4/G nanocomposites were as follows: 0.0645 g pinecone powder (or 0.002 g graphene after sonicated), the 1.35 g ferric chloride hexahydrate (FeCl3·6H2O) and 3.60 g sodium acetate (CH3COONa) were added into a solution mixed from 49 mL ethylene glycol and 0.6 mL H2O. The solution was transferred into a teflon-lined high-pressure reaction autoclave after stirred for 30 min. And after having been maintained at given temperature for several hours, the autoclave was naturally cooled to the ambient temperature. The obtained sample was separated from the autoclave, washed by distilled water and ethanol several times successively, and then dried in an oven at 100 °C for 12 hours to obtain the magnetic nanocomposites.

Characterization

X-ray diffraction (XRD) was carried out to identify the crystal phase composition of synthesized samples over the 2θ range from 10° to 70° using a Bruker D8 advance X-ray diffractometer with Cu Kα radiation (λ = 1.54056 Å) operated at 45 kV and 40 mA. The surface morphology of the product was characterized with a scanning electron microscope JSM-6300 (JEOL Ltd, Japan). In addition, the N2-based Brunauer–Emmett–Teller (BET) surface area of products was determined by the surface area analyzer (ASAP 2020 V4.01). UV-vis spectrophotometer (Cary 50, Varian Co. USA) was used to monitor the removal of Cr(VI) in the reaction process.

Adsorption experimental

The adsorption performance of the as-prepared samples was evaluated by adsorption removal of Cr(VI) in aqueous solution. In a typical adsorption experimental process, Fe3O4 nanocomposite adsorbent (0.20 g) was added to the aqueous solution containing Cr(VI) (100 mL, 50 mg L−1). The suspension was placed in the constant-temperature shaker (150 rpm) at the water bath of 25 °C. At the given time intervals, 1.0 mL of aqueous suspension was taken out, centrifuged and filtered through a 0.45 μm millipore filter to determine the concentration of Cr(VI). And the concentration of Cr(VI) in the adsorption process was measured using a UV-vis spectrophotometer (Cary 50) at a wavelength of 540 nm by diphenylcarbazide method.26

The removal efficiency of Cr(VI) was calculated by eqn (1):

 
image file: c5ra10236g-t1.tif(1)

The amount of adsorbed Cr(VI) at time t was calculated according to the eqn (2):

 
image file: c5ra10236g-t2.tif(2)
where C0 and Ct (mg L−1) are the concentration of Cr(VI) initially and at any time t, qt (mg g−1) is the adsorption capacity at any time t, V (L) is the volume of the Cr(VI) solution and m (g) is the quality of the adsorbent used.

Adsorption kinetics

The adsorption kinetics are of great importance for adsorption investigation because they can indicate the adsorption rate of the heavy metal ions removal from aqueous solutions and supply effective data for comprehending the mechanism of adsorption reactions.27,28 The linear forms of the pseudo-first-order kinetic model and the pseudo-second-order kinetic model were applied to investigate adsorption mechanism. The linear form of the first-order kinetic rate model was expressed as eqn (3):29
 
image file: c5ra10236g-t3.tif(3)
and the linear form of the pseudo-second-order kinetic rate model was expressed as eqn (4):30
 
image file: c5ra10236g-t4.tif(4)
where k1 (min−1) is the rate constant for first-order adsorption, k2 (g mg−1 min−1) is the rate constant for second-order adsorption, qe (mg g−1) is the adsorption capacity at equilibrium, and qt (mg g−1) is the adsorption capacity at any time t. The adsorption capacity of Cr(VI) on the adsorbent can be calculated by the adsorption isotherms.

Results and discussion

XRD analysis

The crystal structure of product was examined by XRD. The XRD patterns for Fe3O4, Fe3O4/P and Fe3O4/G samples were presented in Fig. 1. The peaks, which lied at 31.2°, 36.8°, 38.1°, 44.7°, 55.6°, 59.3° and 65.2°, corresponding to (220), (311), (222), (400), (422), (511) and (440) planes of the standard card of cubic Fe3O4 (JCPDS#26-1136). Compared to the XRD pattern of Fe3O4, the peaks lied at 31.2°, 36.8°, and 65.2° almost disappeared completely, the highest peak lied at 38.1° weakened and broadened. There appeared new peaks at 34.0°, 57.9° and 63.5° in the XRD pattern of Fe3O4/P. All of these diversities can be attributed to the hybridization of pinecone, which caused crystal structure and crystallinity varied. There appeared a peak lied at 20.8° in the XRD pattern of Fe3O4/G, which could prove that graphene was hybridized into the product.31 Compared to the XRD pattern of Fe3O4, the peaks lied at 31.2°, 36.8°, 38.1°, 44.7°, 55.6°, 59.3° and 65.2° all became sharp, which indicated that the product crystallized well. The hybridization of graphene was favorable to the crystal growth of product.
image file: c5ra10236g-f1.tif
Fig. 1 XRD patterns for the Fe3O4, Fe3O4/P and Fe3O4/G.

SEM analysis

The SEM image of the Fe3O4 was presented in Fig. 2a, from which could be seen that the spherical Fe3O4 dispersed uniformly with size ranging from 100 to 200 nm. Fig. 2b was the enlarged image of Fe3O4, it could be seen that the rough surface provided more active adsorption sites, which might own the high adsorption performance. Fig. 2c presented the SEM image of pinecone powder calcined at 400 °C. It could be seen that the surface morphology of the carbonaceous material was loose and porous, which might support Fe3O4 on its surface. The SEM image of Fe3O4/P was showed in Fig. 2d, from which could be seen that Fe3O4 was loaded tightly on the surface of the calcined pinecone, which acted as supporting matrix. Fig. 2e presented the SEM image of graphene, which was smooth flake with much wrinkles. Fig. 2f presented SEM image of Fe3O4/G, which indicated that Fe3O4 spherical particles were distributed and firmly anchored onto the wrinkled graphene layers. This structure increased the contact surface of Fe3O4 to react with heavy metal. It would enhance the adsorption efficiency of Fe3O4/G for heavy metal ions.
image file: c5ra10236g-f2.tif
Fig. 2 SEM images of (a) Fe3O4 (b) Fe3O4 (enlarged scale), (c) pinecone powder, (d) Fe3O4/P, (e) graphene, (f) Fe3O4/G.

Specific surface area

Fig. 3 showed the N2 adsorption–desorption isotherm curves for the samples. The specific surface area of Fe3O4, Fe3O4/P and Fe3O4/G was respectively 23.85, 27.86 and 121.47 m2 g−1. And the pore sizes were 9.26, 21.02 and 14.64 nm for Fe3O4, Fe3O4/P and Fe3O4/G respectively. The combination of calcined porous pinecone increased the pore size of Fe3O4, and the hybridization of graphene increased greatly the BET surface area of Fe3O4, which could improve the adsorption efficiency of Fe3O4. It indicated that Fe3O4 nanoparticles hybridized with carbonaceous materials, such as calcined porous pinecone and graphene, might improve adsorptive performance of Fe3O4 for heavy metal ions.
image file: c5ra10236g-f3.tif
Fig. 3 Nitrogen adsorption–desorption isotherms of Fe3O4, Fe3O4/P, Fe3O4/G.

Adsorption efficiency

Fig. 4 presented the adsorption removal efficiency of Cr(VI) (50 mg L−1) in aqueous solution at 25 °C. The adsorption rates of nanomaterials for Cr(VI) were rapid at the first 20 min, and then the adsorption curve became flat, eventually reached the adsorption equilibrium in about 3 h. The removal efficiency for Cr(VI) of Fe3O4, Fe3O4/P and Fe3O4/G were 67.8%, 79.5% and 84.6%, respectively. It indicated that the hybridization of pinecone or graphene enhanced the adsorption efficiency of Fe3O4 significantly.
image file: c5ra10236g-f4.tif
Fig. 4 Adsorption efficiency of Cr(VI) on Fe3O4, Fe3O4/P and Fe3O4/G.

For the desorption process, the Cr(VI) loaded nanocomposite was dispersed into 100 mL NaOH (0.10 mol L−1) aqueous solution and shaken at 150 rpm for 5 h. When desorption equilibrium was reached, about 90%, 92.6% and 94% Cr(VI) were desorbed from the surface of Fe3O4, Fe3O4/P and Fe3O4/G, respectively. It indicated that the adsorption–desorption process was nearly reversible, which illustrated the adsorption of Cr(VI) on the adsorbent surface was a physical process.

Adsorption kinetics

The pseudo-first-order kinetic line plots of log(qeqt) versus t are shown in Fig. 5a and the pseudo-second-order kinetic line plots of t/qt versus t were shown in Fig. 5b. The kinetic constants were listed in Table 1. qe,cal and qe,exp were calculated and experimental adsorption capacities at equilibrium respectively. The R2 of the first-order kinetic model were all less than 0.926 and those of the second-order kinetic model were all more than 0.996. It indicated that the second-order adsorption kinetic model fit the adsorption process better than the first-order kinetics model. And significantly, there was a good agreement between the calculated and experimental qe values, confirming the applicability of the second-order adsorption kinetic model to describe the adsorption process.
image file: c5ra10236g-f5.tif
Fig. 5 Pseudo-first-order kinetics (a) and second-order kinetics (b) for adsorption of Cr(VI) onto Fe3O4, Fe3O4/P and Fe3O4/G.
Table 1 Kinetic constants of Cr(VI) adsorption onto Fe3O4, Fe3O4/P and Fe3O4/G
Samples qe,exp/(mg g−1) Pseudo-first-order Pseudo-second-order
qe,cal/(mg g−1) k1/(min−1) R2 qe,cal/(mg g−1) k2/(min−1) R2
Fe3O4 15.66 17.56 0.0128 0.879 15.63 0.0192 0.998
Fe3O4/P 19.29 20.84 0.0106 0.926 19.33 0.0211 0.998
Fe3O4/G 20.37 17.80 0.0096 0.873 20.29 0.0236 0.996


Intraparticle diffusion analysis

The intraparticle diffusion kinetic model based on the Weber–Morris equation [eqn (5)] was further used to investigate the control step of the process and to clarify the mechanism of adsorption:32
 
qt = Kdit1/2 + Ci (5)
where Kdi (g mg−1 min1/2) is the rate parameter during stage i, which is calculated from the slope of the straight line of qt versus t1/2, Ci is the intercept during stage i, which gives an idea about the thickness of the boundary layer. For the intraparticle diffusion, qt versus t1/2 will be linear. The linear fits of intraparticle diffusion model for the adsorption of Cr(VI) onto products were presented in Fig. 6. The plots exhibited three-linearity, implying there were three steps in the adsorption process. The slope of three stages (Kd1 > Kd2 > Kd3) were listed in Table 2 and the values of K determined the adsorption speed. The first stage, which was completed within 10 minutes, was related to the instantaneous adsorption step that mainly occurred on the external surface of the adsorbents. This arose from the fact that the initial Cr(VI) concentration in the solutions was high and this large concentration gradient provided enough driving force for Cr(VI) diffusing to the external surface of the adsorbents. It was evident that Kd1 values for Fe3O4/P and Fe3O4/G was greater than that of Fe3O4, which could be seen from Table 2. It was understandable by taking account of larger specific surface areas for Fe3O4/P and Fe3O4/G contrast to Fe3O4. The second adsorption stage was a relatively slow region, which was related to the intraparticle diffusion. It was a rate-limiting step. The third region was the final equilibrium stage. Since the final concentrations of Cr(VI) left in the solutions was extremely low, the intraparticle diffusion further slowed down. As discussed above, Cr(VI) was slowly transported by intraparticle diffusion into the particles and finally reached the surface of nanomaterials. Table 2 presented a comparison of intraparticle diffusion rate parameters for the adsorption of Cr(VI) on Fe3O4, Fe3O4/P and Fe3O4/G. The Kd1 values of Fe3O4/P and Fe3O4/G were larger than that of Fe3O4 owing to the former having larger surface areas. Further observation indicated Kd1 > Kd2 > Kd3, which was not surprising because the concentration of Cr(VI) left in the solutions gradually decreased with prolonging adsorption time.

image file: c5ra10236g-f6.tif
Fig. 6 The intraparticle diffusion kinetics of Cr(VI) on Fe3O4, Fe3O4/P and Fe3O4/G.
Table 2 Intraparticle diffusion kinetics constants
Sample k1/(g mg−1 min−1) k2/(g mg−1 min−1) k3/(g mg−1 min−1) R12 R22 R32
Fe3O4 5.25 0.248 0.0588 0.978 0.969 0.994
Fe3O4/P 6.01 0.529 0.0728 0.998 0.996 0.990
Fe3O4/G 6.88 0.673 0.136 0.995 0.987 0.985


Adsorption isotherms

To fully understand the adsorption process, several different isotherm models, such as the Langmuir, Freundlich and Temkin isotherm models, are considered. Fitting experimental data to appropriate isotherm model is a very important step, because the results give information about the interactions of adsorbate with the adsorbent.

The Langmuir isotherm

The Langmuir equation is expressed as eqn (6):
 
image file: c5ra10236g-t5.tif(6)
where Ce (mg L−1) is the equilibrium concentration of Cr(VI) in solution, qe (mg L−1) is the equilibrium capacity of Cr(VI) on the adsorbent, qmax (mg g−1) is the theoretical maximum monolayer sorption capacity, and KL (L mg−1) is the Langmuir constant, which is related to the free energy of adsorption. The constants of qmax and KL could be obtained from the intercept and the slope of the linear plot of Ce/qe versus Ce (Fig. 7).

image file: c5ra10236g-f7.tif
Fig. 7 Langmuir linear plots for adsorption of Cr(VI) on Fe3O4, Fe3O4/P and Fe3O4/G.

The Freundlich isotherm

The linear form of the Freundlich equation is written as eqn (7):
 
image file: c5ra10236g-t6.tif(7)
where KF [(mg g−1)(L mg−1)1/n] is the Freundlich constant related to the bonding energy. 1/n is a heterogeneous adsorption factor. The constants KL and n can be obtained from the intercept and the slope of the linear plots of ln[thin space (1/6-em)]qe versus ln[thin space (1/6-em)]Ce (Fig. 8). The Freundlich exponent n of Fe3O4, Fe3O4/P and Fe3O4/G respectively were 1.89, 2.45 and 2.70 by calculation, where n > 1 implied a favorable adsorption condition. The results indicated that the adsorption process of Fe3O4, Fe3O4/P and Fe3O4/G were reversible.

image file: c5ra10236g-f8.tif
Fig. 8 Freundlich linear plots for adsorption of Cr(VI) on Fe3O4, Fe3O4/P and Fe3O4/G.

The Temkin isotherm

The Temkin adsorption isotherm is described as follows (eqn (8)):
 
qe = B[thin space (1/6-em)]ln[thin space (1/6-em)]Kt + B[thin space (1/6-em)]ln[thin space (1/6-em)]Ce (8)
where Kt (L g−1) is the equilibrium constant related to the maximum binding energy and B is related to the heat of adsorption. The linear plots of qe versus ln[thin space (1/6-em)]Ce were shown in Fig. 9.

image file: c5ra10236g-f9.tif
Fig. 9 Temkin linear plots for adsorption of Cr(VI) on Fe3O4, Fe3O4/P and Fe3O4/G.

Overall, the relative parameters calculated from the three models were listed in Table 3. The higher correlation coefficient of the Langmuir model illustrated that the adsorption data were better fitted by the Langmuir model (R2 > 0.992) than by the Freundlich model and the Temkin model. Then, it showed that the adsorption occurred in a monolayer and at a fixed number of identical adsorption sites. It meant that there was no formation of chemical bonds between chromium and adsorbent. Furthermore, the Freundlich constant n values were greater than 1, which confirmed that the adsorption process could be considered as Langmuir adsorption. Hence, we could obtain the calculated qmax of Fe3O4, Fe3O4/P and Fe3O4/G were 39.5, 62.5 and 78.5 mg g−1, respectively.

Table 3 The constants of adsorption isotherms
Sample Langmuir Freundlich Temkin
qmax/(mg g−1) KL/(L mg−1) R2 KF/(mg g−1 (L mg−1)1/n) n R2 KT/(L g−1) B R2
Fe3O4 39.5 0.00940 0.995 4.67 1.89 0.993 0.0835 25.47 0.983
Fe3O4/P 62.5 0.00357 0.992 8.99 2.45 0.985 0.388 15.62 0.974
Fe3O4/G 78.5 0.000615 0.998 15.17 2.70 0.986 0.653 19.03 0.987


Adsorption thermodynamics

The thermodynamics supposes that in an isolated system, where energy could not be gained or lost, the entropy change is the driving force. The Arrhenius equation has been applied to measure the activation energy of adsorption, which represents the minimum energy that reactants must have for the reaction to proceed, as expressed in eqn (9):33
 
image file: c5ra10236g-t7.tif(9)
where Ea (kJ mol−1) is the Arrhenius activation energy, A is the Arrhenius factor, R (8.314 J mol−1 K−1) is the gas constant and T (K) is the absolute temperature. When ln[thin space (1/6-em)]k2 was plotted against 1/T, a straight line with the slope −Ea/R was obtained (Fig. 10). Table 4 presented kinetic constants of activation energy in adsorption. The qe decreased along with increasing temperature, which indicated the adsorption for Cr(VI) was an exothermic process. The magnitude of activation energy gives an idea about the type of adsorption such as chemical or physical adsorption. The physical processes often have activation energies in the range of 0–40 kJ mol−1, yet higher activation energies (40–800 kJ mol−1) imply chemisorption.34 The Ea values were 34.39, 25.77 and 34.92 kJ mol−1 for Fe3O4, Fe3O4/P and Fe3O4/G respectively, which indicated that the adsorption of Cr(VI) on all samples were physical adsorption.

image file: c5ra10236g-f10.tif
Fig. 10 Plots of ln[thin space (1/6-em)]k2 versus 1/T for Cr(VI) on Fe3O4, Fe3O4/P and Fe3O4/G.
Table 4 Kinetic constants of activation energy in adsorption
C0/(mg L−1) T /(K−1) Fe3O4 Fe3O4/P Fe3O4/G
qe/(mg g−1) k2/(min−1) R2 qe/(mg g−1) k2/(min−1) R2 qe/(mg g−1) k2/(min−1) R2
50 298.15 15.66 0.0192 0.995 19.29 0.0211 0.987 20.37 0.0236 0.996
50 303.15 10.05 0.0305 0.993 14.93 0.0493 0.995 18.29 0.0384 0.989
50 308.15 8.37 0.0374 0.988 11.85 0.0578 0.992 15.71 0.0478 0.992


Regeneration of the adsorbent

Since the adsorption of Cr(VI) onto adsorbent was a reversible process, the regeneration of the adsorbed nanocomposites was conducted using the dipping of NaOH (0.1 mol L−1) aqueous solution and magnet separation. The nanocomposite was repeatedly putted into 50 mg L−1 solution of Cr(VI) for adsorption and taken out for regeneration. In each cycle, the percentage of removal (Rr) was calculated using eqn (1) for the adsorption process. The regeneration results were shown in Fig. 11. The adsorption efficiency could still remain high after five cycles, which indicated that Fe3O4/carbonaceous had a good capacity of regeneration and repeatability.
image file: c5ra10236g-f11.tif
Fig. 11 Adsorption–desorption cycles of Fe3O4/P and Fe3O4/G for Cr(VI).

Conclusions

Fe3O4 nanoparticles hybridized with carbonaceous materials, such as pinecone and graphene, were successfully synthesized by a facile hydrothermal method, which could be applied for Cr(VI) removal in aqueous solution. The nanocomposites were characterized by XRD, SEM and N2 adsorption–desorption isotherm. Due to the combination of pinecone and graphene, both the surface properties and morphologies of Fe3O4 were modified. Fe3O4 spherical particles were distributed and firmly anchored on loose surface of pinecone or wrinkled graphene layers. The specific surface area increased from 23.85 to 27.86 and 121.17 m2 g−1 for Fe3O4/P and Fe3O4/G respectively. It enhanced the adsorption capacity for Cr(VI) of Fe3O4/P (62.5 mg g−1) and Fe3O4/G (78.5 mg g−1). The kinetics and isotherm study showed that the pseudo-second-order kinetic and Langmuir isotherm models could well fit the adsorption data. There were three steps in the adsorption process, such as the instantaneous adsorption step, the intraparticle diffusion and the final equilibrium stage. The reaction rate decreased along with temperature increasing, which indicated the adsorption for Cr(VI) was an exothermic process. The Ea were 34.39, 25.77 and 34.92 kJ mol−1 for Fe3O4, Fe3O4/P and Fe3O4/G respectively, which illustrated the adsorption of Cr(VI) onto the surface of nanocomposite was a physical process. In no more than 5 h, about 92.6% and 94% Cr(VI) were desorbed from Fe3O4/P and Fe3O4/G, respectively, which indicated the adsorption–desorption process for Cr(VI) was reversible, The results demonstrated that Fe3O4/P and Fe3O4/G exhibited excellent adsorption performance in the removal of Cr(VI). It was proved that carbonaceous materials, such as pinecone or graphene, could enhance the adsorption efficiency of Fe3O4, which might be used as adsorbent to remove heavy metal in industry effluent.

Acknowledgements

This work has been supported by The National Natural Science Foundation of China (41340037) and the scientific research program of Shandong Province (2013G0021701, 2014GGH217001).

Notes and references

  1. N. K. Srivastava and C. B. Majumder, J. Hazard. Mater., 2008, 151, 8 CrossRef PubMed.
  2. C. Y. Chang, X. H. Xu and C. P. Liu, Environ. Prog., 2014, 16, 1790 CAS.
  3. N. N. Thinh, P. T. B. Hanh, L. T. T. Ha, L. N. Anh, T. V. Hoang, V. D. Hoang, L. H. Dang, N. V. Khoi and T. D. Lam, Mater. Sci. Eng., C, 2013, 33, 1214 CrossRef CAS PubMed.
  4. L. F. Feng and W. Qi, J. Environ. Manage., 2011, 92, 407 CrossRef PubMed.
  5. L. Zhou, C. Gao and W. J. Xu, ACS Appl. Mater. Interfaces, 2010, 2, 1483 CAS.
  6. A. Maleki, B. Hayati, M. Naghizadeh and S. W. Joo, J. Ind. Eng. Chem., 2015, 28, 211 CrossRef CAS PubMed.
  7. A. Adamczuk and D. Kolodynska, Chem. Eng. J., 2015, 274, 200 CrossRef CAS PubMed.
  8. Z. Lv, C. Liang, J. Cui, Y. Zhang and S. Xu, RSC Adv., 2015, 5, 18213 RSC.
  9. V. Kumari, M. Sasidharan and A. Bhaumik, Dalton Trans., 2015, 1924 RSC.
  10. G. X. Hui and Z. Jie, Environ. Technol., 2005, 7, 409 Search PubMed.
  11. C. Yang, G. Wang and Z. Y. Lu, J. Mater. Chem., 2005, 15, 4252 RSC.
  12. G. Chen, C. Qiao, Y. Wang and J. Yao, Ind. Eng. Chem. Res., 2014, 53, 15576 CrossRef CAS.
  13. A. Masoumi, M. Ghaemy and A. N. Bakht, Ind. Eng. Chem. Res., 2014, 53, 8188 CrossRef CAS.
  14. W. Jiang, Q. Cai, W. Xu, M. Yang, Y. Cai, D. D. Dionysiou and K. E. O'Shea, Environ. Sci. Technol., 2014, 48, 8078 CrossRef CAS PubMed.
  15. D. H. K. Reddy and S. Lee, Adv. Colloid Interface Sci., 2013, 68, 201 Search PubMed.
  16. D. H. K. Reddy and S. Lee, Colloids Surf., A, 2014, 454, 96 CrossRef PubMed.
  17. G. Yang, L. Tang, G. Zeng, Y. Cai, J. Tang, Y. Pang, Y. Zhou, Y. Liu, J. Wang, S. Zhang and W. Xiong, Chem. Eng. J., 2015, 259, 854 CrossRef CAS PubMed.
  18. L. Tang, S. Zhang, G. Zeng, Y. Zhang, G. Yang, J. Chen, J. Wang, J. Wang, Y. Zhou and Y. Deng, J. Colloid Interface Sci., 2015, 445, 1 CrossRef CAS PubMed.
  19. Z. Jiang, Y. Liu, G. Zeng, W. Xu, B. Zheng, X. Tan and S. Wang, RSC Adv., 2015, 5, 25389 RSC.
  20. C. Wu, J. Fan, J. Jiang and J. Wang, RSC Adv., 2015, 5, 47165 RSC.
  21. F. Perreault, A. F. Faria and M. C. Elimelech, Chem. Soc. Rev., 2015, 9, 1039 Search PubMed.
  22. M. C. Liu, T. Wen, X. L. Wu, C. L. Chen, J. Hu, J. Lia and X. K. Wang, Dalton Trans., 2013, 14710 RSC.
  23. H. T. Yu, Y. C. Li, X. H. Li, L. Z. Fan and S. H. Yang, J. Mater. Chem. A, 2014, 2, 15763 CAS.
  24. X. F. Han, L. Zhang and C. Z. Li, RSC Adv., 2014, 4, 30536 RSC.
  25. Z. Z. Guang, Y. H. Jiang and L. Fei, Chin. J. Inorg. Chem., 2011, 9, 1753 Search PubMed.
  26. Z. G. Ke, Q. Huang, H. Zhang and Z. L. Yu, Environ. Sci. Technol., 2011, 45, 7841 CrossRef CAS PubMed.
  27. D. Ying, L. Jing and S. Lei, J. Mater. Chem. A, 2015, 10, 1039 Search PubMed.
  28. V. Stengl, J. Bludska and F. Oplustil, Mater. Res. Bull., 2011, 46, 2050 CrossRef CAS PubMed.
  29. I. A. W. Tan, A. L. Ahmad and B. H. Hameed, J. Hazard. Mater., 2009, 164, 473 CrossRef CAS PubMed.
  30. S. Rengaraj, Y. Kim and C. K. Joo, J. Colloid Interface Sci., 2004, 273, 14 CrossRef CAS PubMed.
  31. A. Gajic, H. G. Ramke and A. Hendrickset, Biomass Bioenergy, 2012, 47, 250 CrossRef CAS PubMed.
  32. E. L. Grabowska and G. Gryglewicz, J. Colloid Interface Sci., 2005, 284, 416 CrossRef PubMed.
  33. Y. Onal, C. Akmil-Bar and D. Eren, J. Hazard. Mater., 2006, 128, 150 CrossRef CAS PubMed.
  34. T. Rui, Y. Gang and L. Hang, Phys. Chem. Chem. Phys., 2014, 16, 8828 RSC.

This journal is © The Royal Society of Chemistry 2015
Click here to see how this site uses Cookies. View our privacy policy here.