
Effective removal of methylene blue from water using phosphoric acid based geopolymers: synthesis, characterizations and adsorption studies
M. Irfan Khan *,
Teoh. K. Min,
Khairun Azizli*,
Suriati Sufian,
Hafeez Ullah and
Zakaria Man
*,
Teoh. K. Min,
Khairun Azizli*,
Suriati Sufian,
Hafeez Ullah and
Zakaria Man
Universiti Teknologi PETRONAS, Department of Chemical Engineering, Tronoh, Perak, Malaysia. E-mail: khairun_azizli@Petronas.com.my; mirfanwazir@gmail.com
First published on 9th July 2015
Abstract
Phosphoric acid based geopolymers (PAGPs) are a class of geopolymers that are produced by phosphoric acid activation of metakaolin. In this work, two different PAGPs have been synthesized using phosphoric acid to alumina molar ratios of 1![[thin space (1/6-em)]](https://www.rsc.org/images/entities/char_2009.gif) :1 and 1.2:1. The surface profile, chemical composition, micromorphology, and texture properties of the geopolymers were instrumentally determined. Both geopolymers have shown a mesoporous profile with the avg. pore size of 8.6 and 19.4 nm by GP-1M (P:Al = 1 : 1) and GP-2M (P:Al = 1.2 : 1), respectively. Thermogravimetric analysis revealed that these geopolymers were thermally stable up to 800 °C, although the formation of quartz, cristobalite and tridymite was observed in XRD analysis of the samples treated at 800 °C for two hours. The synthesized geopolymers were utilized for the adsorption of methylene blue (MB) by investigating the effect of the amount of adsorbent, pH of the solution and shaking period. The batch kinetics study fitted best into the pseudo second order (PSO) reaction kinetic model. In isotherm modelling studies, the Langmuir isotherm model was best fitted and was used to describe the mechanism of the adsorption. Experimental adsorption capacities (qe) of 2.84 and 3.01 mg g−1 were recorded for GP-1M and GP-2M, respectively. Used adsorbents were successfully regenerated by furnace treatment at 400 °C for two hours, and the regenerated adsorbents presented enhanced adsorption capacities in the range of 4.9–5.07 mg g−1 for five repeat cycles, elucidating that the material is suitable for multiple time use.
:1 and 1.2:1. The surface profile, chemical composition, micromorphology, and texture properties of the geopolymers were instrumentally determined. Both geopolymers have shown a mesoporous profile with the avg. pore size of 8.6 and 19.4 nm by GP-1M (P:Al = 1 : 1) and GP-2M (P:Al = 1.2 : 1), respectively. Thermogravimetric analysis revealed that these geopolymers were thermally stable up to 800 °C, although the formation of quartz, cristobalite and tridymite was observed in XRD analysis of the samples treated at 800 °C for two hours. The synthesized geopolymers were utilized for the adsorption of methylene blue (MB) by investigating the effect of the amount of adsorbent, pH of the solution and shaking period. The batch kinetics study fitted best into the pseudo second order (PSO) reaction kinetic model. In isotherm modelling studies, the Langmuir isotherm model was best fitted and was used to describe the mechanism of the adsorption. Experimental adsorption capacities (qe) of 2.84 and 3.01 mg g−1 were recorded for GP-1M and GP-2M, respectively. Used adsorbents were successfully regenerated by furnace treatment at 400 °C for two hours, and the regenerated adsorbents presented enhanced adsorption capacities in the range of 4.9–5.07 mg g−1 for five repeat cycles, elucidating that the material is suitable for multiple time use.
Introduction
The existence of colorants in wastewater is considered as a major environmental issue due their impact on the environment and life. Owing to the increasing industrialization in the textile, paper, plastics, leather, manufacture and furniture sectors, the utilization of dyes is growing day by day.1 Approximately 0.7 million tonnes of different types of dyes (∼0.1 million varieties) are produced every year.2 The colour of water is considered as an important parameter that indicates the quality of the water, as the presence of a minute quantity of dye is readily observable. Most of the dyes are large organic molecules; therefore they offer serious threats to the marine and inland life, and the environment. Methylene blue (MB) is among the most commonly used dyes in the fabrics and furniture industries. The occurrence of MB in the effluent water can cause permanent blindness, asthma and abdominal disorders like vomiting, nausea etc. Owing to the health and ecological issues, MB removal from water effluents is needed.3,4Removal of dyes from wastewater is achieved by applying a variety of methods including, adsorption, photodegradation, ultrafiltration, ion exchange, electrochemical and sonochemical degradation, and reverse osmosis etc.5 Due to the complex treatment protocols, high expenses, and the large volumes of contaminated water, the water treatment scenario became more complicated. Finding of new, cheap and simple materials and methods are necessarily needed for wastewater treatment.1 Adsorption is considered as one of the most effective techniques for the wastewater treatment due to the existence of a number of adsorbent materials having low cost, ready availability and can be fabricated using simple synthesis protocols. Researchers have put their efforts to discover alternate materials having the ability to decontaminate wastewater.5,6
Activated carbon is most widely used, as an adsorbent, for wastewater treatment and purification, owing to its higher porosity and ready availability.5 Other most commonly used adsorbents studied for the MB removal from wastewater include bio sorbents, wood, rice husk ash, zeolites, fly ash, chitosan, cellulose, kapok, cotton and geopolymers etc.7–9 Although, these materials have been successful in an effective removal of dyes from wastewater, but some of the issues still need to be addressed. Recycling and regeneration of the adsorbents is of utmost importance since it contributes to the sustainability of the process. Moreover, the thermal stability of the materials is another issue that needs to be addressed. Most of the organic type adsorbents are difficult to be recycled and re-used due to their thermal instability and solubility in organic solvents used for the recovery of MB. Easy recyclability and thermal stability up to 1000 °C made geopolymers as a choice adsorbent for waste water treatment.10
Geopolymers are the green materials prepared by the chemical interaction of raw source of aluminosilicates e.g. coal fly ash, calcined clays (metakaolin), and the slags from metallurgy, with an aqueous alkaline and/or alkaline silicate or phosphoric acid solutions as reaction process accelerators and inducing the development of solid, insoluble binding material. Davidovits, in 1970s, was first to introduce the term “geopolymer” for the alkali activated metakaolin. The products were commercialized as fire resistant, inorganic materials; he used the term “geopolymer” to highlight some of the resemblances of geopolymers with organic thermoset resins.11,12 Geopolymers have offered interesting applications, being having a diverse chemistry, zeolite like structure and properties, and their physical properties e.g. thermal and corrosion stability etc.13,14 Being porous in nature, geopolymers have been utilized as adsorbent materials and photocatalysts for the removal of heavy metals contaminations, organic dyes from wastewater, and adsorption of indoor formaldehyde. Adsorption capacities of alkali activated materials have been recorded several times higher than their starting precursor.5 Recently, a new class of geopolymers was prepared by phosphoric acid activation of metakaolin and was coined as phosphoric acid-based geopolymer (PAGP).15–18 PAGPs have offered interesting properties e.g. porosity and thermal stability etc., which can make them suitable alternative for the waste water treatment. Adsorption properties of PAGPs have not been reported, to the best of our knowledge and owing to their reusability, thermal stability and regenerability, these polymers can play an important role in wastewater treatment.
In this study, PAGPs were synthesized using metakaolin as raw source of aluminosilicates and phosphoric acid as activator. PAGPs were investigated as recyclable and readily renewable adsorbents for the adsorption of MB. The objective of this work is to explore the suitability of PAGPs for the wastewater treatment application with an emphasis on kinetics and isothermal modelling.
Experimental
Materials
Kaolin and α-alumina (Al2O3) were procured from R&M chemicals and kaolin was used for the preparation of metakaolin. Phosphoric acid (85%, Merck Millipore) was used as activator in the synthesis of geopolymers and distilled water was used throughout the study. Methylene blue was obtained from R&M chemicals and a 500 mg L−1 solution was prepared using demineralized water and was used as stock solution to prepare individual solutions. To prepare metakaolin, the raw kaolin was calcined in a furnace (Protherm, Turkey) at 800 °C for 2 hours.To know the conversion temperature of kaolin to metakaolin, thermogravimetric analysis (TGA) of kaolin was carried out in a simultaneous thermal analyser (STA 6000, Perkin Elmer) under nitrogen atmosphere, in the temperature range of 50–800 °C at a heating rate of 20 °C min−1.
As shown in Fig. 1, 14.3% mass loss was occurred during metakaolinization and the TG, DTG and DTA patterns match with the previously reported literature, confirming that kaolin has been converted to metakaolinat 650 °C.19–21 To ensure the correct formulation and mix design of the geopolymers, kaolin and metakaolin were analysed using X-ray fluorescence spectrometry (XRF) and the results are shown in Table 1.
 | ||
| Fig. 1 Thermogravimetric analysis of the kaolin in N2 environment. TG, DTG and DTA curves are shown in the figure. | ||
| Al2O3 | SiO2 | P2O5 | TiO2 | Fe2O3 | CaO | K2O | Minor comp. | |
|---|---|---|---|---|---|---|---|---|
| Kaolin | 37.7 | 55.9 | 1.7 | 1.76 | 1.74 | 0.46 | 0.37 | 0.397 |
| Metakaolin | 38.9 | 55.4 | 1.6 | 1.65 | 1.47 | 0.43 | 0.35 | 0.173 |
Methods
:Al ratios of 1:1 (GP-1M) and 1.2 : 1 (GP-2M) were prepared in accordance with Table 2. The two different P:Al ratios were used to provide extra phosphate anions in the reaction, ensuring complete reaction among reactants. Both mixtures were evenly stirred for 30 minutes with a Teflon coated stirrer and were poured into covered plastic moulds. The moulded samples were cured in an oven at 80 °C for 12 hours. Dried and cured samples were ball-milled into powder for characterization and adsorption tests.
| Geopolymer | Metakaolin | α-Aluminum oxide (Al2O3) | Phosphoric acid (H3PO4) | Distilled water |
|---|---|---|---|---|
| GP-1M | 50.00 g | 38.82 g | 31.96 cm3 | 40.00 cm3 |
| GP-2M | 50.00 g | 38.82 g | 38.35 cm3 | 40.00 cm3 |
The micromorphology of the geopolymers was studied with the aid of field emission scanning electron microscope (FESEM, Zeiss supra, Germany), at a magnification of 5000×. Powdered samples were mounted on the aluminium stub using carbon tape and were analysed using secondary electron method. The chemical composition of the PAGPs was determined using Energy dispersive X-ray (EDX) coupled with the FESEM and were verified using X-ray Fluorescence (XRF, Bruker, Germany).
Thermogravimetric analysis of the geopolymers were conducted in thermogravimetric analyser (STA 7000, Perkin Elmer) in the temperature range of 50–800 °C, at a heating rate of 10 °C min−1 and under N2 environment (20 mL min−1).
To investigate the crystallinity and amorphousity of the powdered geopolymers, X-ray diffraction (XRD) analysis was carried out on an X-ray diffractometer (D8 Advanced, Bruker, Germany), in the 2θ range of 2–80°.
| Investigated parameter | Initial conc. (mg L−1) | PAGP dose | pH | Contact time/min |
|---|---|---|---|---|
| Dose | 50 | 0.2, 0.4, 0.6, 0.8, 1.0 | 4.8 | 180 |
| pH | 50 | 0.4 | 3, 5, 7, 9, 10 | 180 |
| Contact time | 10, 30, 50, | 0.4 | 4.8 | 30, 60, 90, 120, 150, 180 |
Effect of adsorbent dosage. The effect of adsorbent dose on the adsorption of MB was investigated by adding varying quantities of geopolymer (0.2, 0.4, 0.6, 0.8 and 1.0 g) into the flask having 25 mL of MB solution (50 mg L−1) at normal pH at 28 °C. The samples were shaken continuously at 150 rpm for 3 hours and the adsorbent was centrifuged out of the MB solution using a centrifuge (Biofuge, Thermo scientific, US), at 6000 rpm for 5 minutes. UV-Vis spectrophotometer (Shimadzu, double beam, UV1800, Japan) was used to determine the MB concentration in the spectrophotometric mode. The removal of the dye (%) was calculated using eqn (1).
 | (1) |
Effect of pH. To determine the effect of pH on the adsorption of MB, PAGPs (0.4 g) were mixed with 25 mL of MB (50 mg L−1) solution at initial pH of 3, 5, 7, 9 and 10. MB solutions have an initial pH of 4.8, which were adjusted to the desired pH using sodium hydroxide (0.1 M) and hydrochloric acid (0.1 M) aqueous solution, and were confirmed by pH meter (S20, Mettler Toledo). The Dye solution was shaken in a water bath at 28 °C, at 150 rpm for 180 minutes.
The extent of adsorption at equilibrium (qeq) was determined using eqn (2).
 | (2) |
Effect of contact time. To study the influence of contact period and to find the equilibrium time, batch adsorption kinetics was carried out. In this experiment, 0.4 g of adsorbent was mixed with 25 mL each of 10, 30 and 50 mg L−1 of MB solutions and the solutions were shaken for 180 minutes at 28 °C. Samples were taken from the solution at 30, 60, 90, 120, 150 and 180 minutes intervals and were analysed with UV-Vis spectrophotometer. Adsorption capacities at a specific time qt (mg g−1) were computed using eqn (3).
 | (3) |
Batch kinetics studies. Lagergren pseudo first order (PFO) and type one pseudo second order (PSO) models were used to study the kinetics of the adsorption of methylene blue on PAGPs. Eqn (4) and (5) represent PFO and PSO models, respectively.22
 | (4) |
 | (5) |
Isotherm models studies. Three different isotherm models i.e. Langmuir, Freundlich and Temkin models were applied to describe the interactions of MB with geopolymers and are shown in eqn (6)–(8), respectively.23–25
 | (6) |
In eqn (6), adsorption capacity and energy of adsorption are represented by the Langmuir constants qm (mg g−1) and KL (L mg−1), respectively and their values can be calculated from the plot between 1/qe versus 1/Ce according to eqn (6).
 | (7) |
|
qe = BlnA + BlnCe
| (8) |
Regenration and re-use of the adsorbent. Used PAGPs were regenerated by heating in a furnace (Protherm, Turkey) at 400 °C for 2 hours and were reused. To check the adsorption efficiency, 0.4 g of the adsorbent was added to 50 mL of MB solution (50 mg L−1) and was stirred at 150 rpm at 28 °C for 180 minutes. PAGPs were regenerated and reused for 5 times to investigate their re-utilization.
Results and discussion
Characterization of materials
On the other hand the avg. pore size, as determined by MIP, of GP-2M is 198 nm which is smaller than that of GP-1M i.e. 238 nm. The smaller pore size of GP-2M was caused by the extra phosphoric acid, leading to the formation of more compact structure, as demonstrated in the increased density of the same sample. The supposition is further supported by the lower pore volume of GP-2M (113.09 mm3 g−1) compared to GP-1M (133.5 mm3 g−1).
As these geopolymers were cured in a sealed environment, therefore the increased quantity of phosphate anion (PO4)3− reacted with α-alumina and the aluminosilicates in the Metakaolin, leading to the formation of a denser geopolymer. The structure and properties of geopolymers vary with the composition of raw materials, concentration of activating solutions and curing conditions. Higher concentration of activators results in the formation of a denser geopolymer, primarily due to more reaction products, and secondarily due to the incorporation of more material in the geopolymer matrix.26
| Sample | Surface area (BET) (m2 g−1) | Avg. pore diameter (nm) | Pore volume (cm3 g−1) |
|---|---|---|---|
| GP-1M | 33.39 | 8.61 | 0.071 |
| GP-2M | 8.07 | 19.43 | 0.035 |
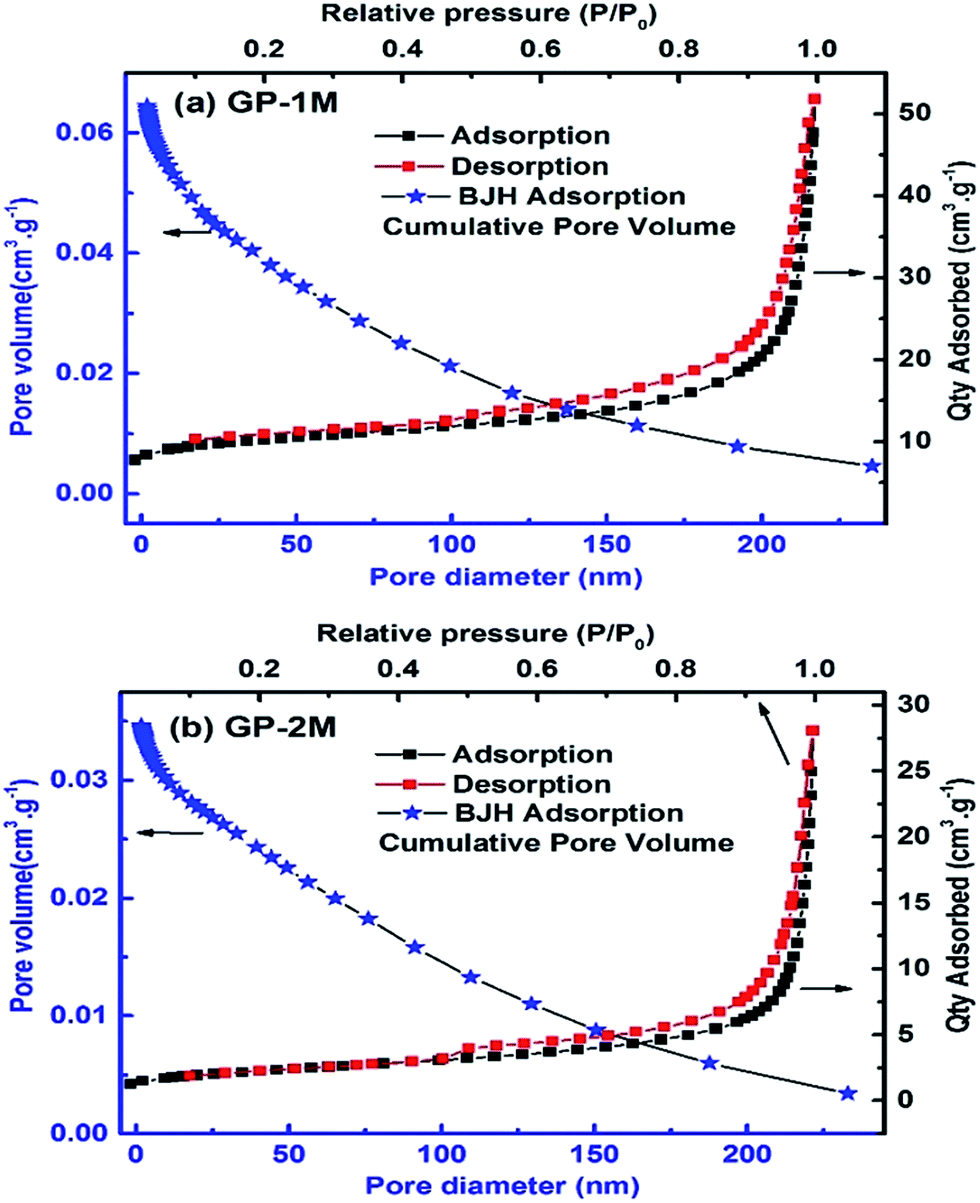 | ||
| Fig. 2 Nitrogen adsorption–desorption isotherm and pore analysis profile of (a) GP-1M and (b) GP-2M. | ||
Moreover, the Barrett–Joyner–Halenda (BJH) pore size distribution curves (blue line in Fig. 2) indicates that most of the pores are mesopores (2–50 nm), in both samples along with certain amount of micro (<2 nm) and macropores (>50 nm). The results demonstrated that PAGPs are consisted of various type of pores including micro, meso and macropores. The avg. pore size of the GP-1M and GP-2M was found to be 8.61 and 19.4 nm, respectively. Additionally, GP-1M has shown a cumulative pore volume of 0.071 that was nearly two fold to the pore volume of GP-2M.
The higher surface area of GP-1M is related to the small sized mesopores and the higher pore volume compared to GP-2M. The lower pore volume of GP-2M further strengthened the supposition that GP-2M has a compact texture with lesser porosity and the result is in consistence with the physical properties of PAGPs as discussed in previous section.
Methylene blue is a large molecule (approximately 0.8 nm) and is better adsorbed by mesoporous materials compared to microporous and macroporous materials.30 The results demonstrated that with an increase in P:Al ratio, there was a subsequent decrease in porosity of PAGPs and the result is in agreement with MIP based surface analysis given in Table 4. Similar trend in results was also observed by other researchers.31
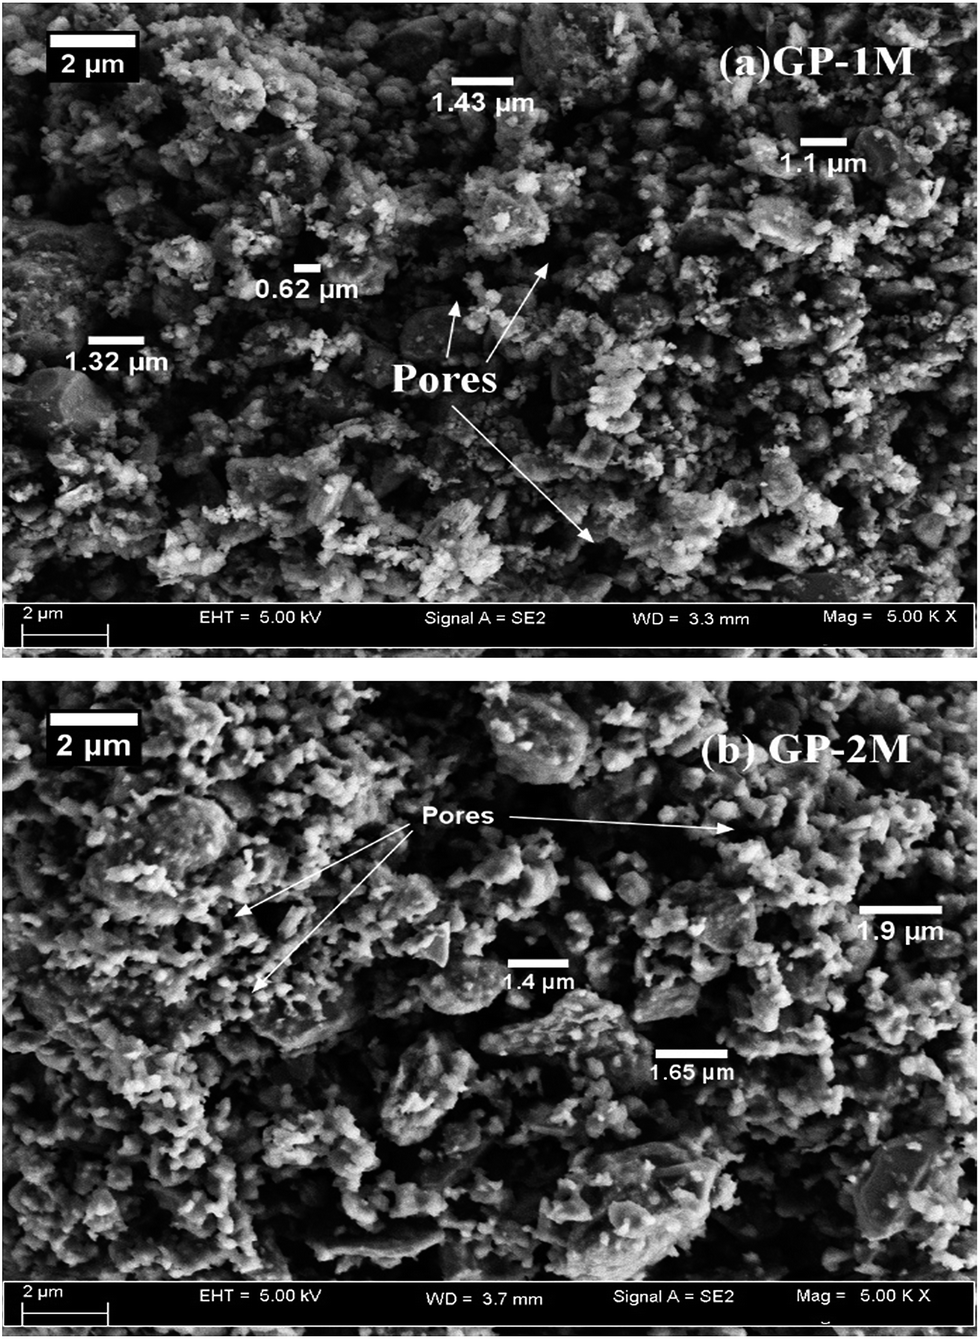 | ||
| Fig. 3 FESEM analysis of (a) GP-1M and (b) GP-2M. | ||
The microstructure of GP-1M and GP-2M closely resembles to the typical amorphous morphology of the geopolymeric gel. Morphologies of different shapes and sizes were present in the microstructures. Geopolymers have shown multi morphologies and anisotropy due to the non-stoichiometric reactions, physically and chemically varying particles, and presence of crystalline phases in the raw materials.13,14,32
Elemental composition of the two polymers was determined using EDX analysis and the results are given in Table 6. The results show that GP-2M has 3% more phosphorus than GP-1M, due to the addition of extra phosphoric acid. Besides, an increase in Al content from 19.8% to 22.2% was also observed. This increase shows that with the addition of extra phosphoric acid, more active aluminium is available at the surface of the geopolymer. To verify that whether the change in aluminium content was a local phenomenon or it was distributed over the whole sample, XRF analysis was carried out.
| Composition | O(K) | Al(K) | Si(K) | P(K) |
|---|---|---|---|---|
| GP-1M | 59.43 | 19.84 | 9.78 | 10.94 |
| GP-2M | 55.04 | 22.26 | 9.64 | 13.06 |
| Al2O3 | SiO2 | P2O5 | TiO2 | Fe2O3 | CaO | K2O | Minor comp. | |
|---|---|---|---|---|---|---|---|---|
| GP-1M | 36.5 | 26 | 35.1 | 0.75 | 0.75 | 0.46 | 0.19 | 0.253 |
| GP-2M | 34.2 | 24.3 | 39.3 | 0.72 | 0.69 | 0.43 | 0.14 | 0.315 |
The major difference between alkali based and phosphoric acid based geopolymers is that the former are formed of alkali metal aluminosilicates, whereas the later are silico alumino phosphates. Phosphoric acid activates metakaolin by providing low-polymeric (PO4)3− tetrahedral species and leading to the formation of three dimensional silico alumino phosphates.34,35
 | ||
| Fig. 4 Thermogravimetric analysis of (a) GP-1M and (b) GP-2M in N2 environment. | ||
The mass loss shown below 200 °C is accounted for the dehydration of the geopolymer, as water molecules are vaporized in this region, as reported previously.10,36 The results demonstrated that PAGPs are thermally stable and resist any thermal decomposition up to 800 °C. Moreover, it is also confirmed that the addition of extra phosphate ions have no impact on the thermal stability of the PAGPs.
Previous studies suggested that geopolymers are thermally very stable and only dehydration takes place up to 800 °C.10 This higher thermal stability is given by the stable silico alumino phosphate and aluminosilicate type structure.10,34 Liu et al. reported a mass loss of approximately 16% with a single DTG peak at 139 °C, representing the water loss during thermogravimetric analysis.16 The reduced water content of the PAGPs, in this study, was due to the addition of less water during synthesis of geopolymers.
It is concluded that these geopolymers can be readily regenerated by sintering the spent PAGPs. To confirm the regeneration and reusability of the used geopolymers, rejuvenated geopolymers were also investigated for the adsorption process. To investigate the effect of thermal treatment on the crystallinity of geopolymers, XRD analysis was carried out and is discussed in next section.
 | ||
| Fig. 5 (a) XRD analysis of the PAGPS and (b) a closer view of the selected region. In the figure samples details are; (a) GP-1M, (b) GP-2M, (c) GP-1MT (d), GP-2MT (e) GP-1MR and (f) GP-2MR, whereas “T” represents samples treated at 800 °C for 2 hours and “R” stands for regenerated adsorbents. Small letter c, cr, t and q are used to represent corundum, cristobalite, tridymite and quartzite phases. | ||
Geopolymers calcined at 800 °C for 2 hours are represented by GP-1MT and GP-2MT. As illustrated in Fig. 5(b), thermal treatment resulted in the formation of three new peaks in the 2θ range of 20–30°; the region representing the amorphousity of geopolymers. These new peaks were resulted due to the formation of quartzite, cristobalite and tridymite type structures.34,37 This behaviour of PAGPs is explained on the basis of partial transformation from amorphous to crystalline structure owing to the thermal treatment. Quartzite and cristobalite formation is caused either by the conversion of the unreacted amorphous silica, or due to transformation of silico alumino phospho type structure. In the previous works, the formation of quartz, cristobalite and tridymite occurred at temperature ≈700 °C in the phosphoric acid activated metakaolin.
The XRD pattern of the regenerated PAGPs closely resembled with the thermally treated ones in the 2θ range of 20–30°. This shows that formation of crystalline phases from amorphous geopolymers occurred as a result of heating the samples even at 400 °C, for two hours. The presence of crystalline phases can be linked with the longer thermal treatment compared to previously reported results.34 Liu et al. investigated the thermal stability and crystallinity of phosphoric acid geopolymers up to 1500 °C and found that despite the changes in crystallinity of the geopolymers with the thermal treatment, there is no effect on their thermal stability and porosity.16
Adsorption of methylene blue
To explore the adsorption properties of GP-1M and GP-2M, adsorption tests were performed using methylene blue solution. The details of the studies are discussed in the next sections. | ||
| Fig. 6 (a) Effect of the initial adsorbent dosage and (b) pH on methylene blue adsorption using GP-1M and GP-2M. Experiments were conducted at 28 °C using 25 mL of 50 mg L−1 MB solution. | ||
The higher adsorption capacity of GP-1M at lower adsorbent dosage is due to the higher surface and pore volume of GP-1M.
The rise in the dye adsorption with the increase in adsorbent dosage occurred due to the availability of more surface area and pores, owing to the presence of more adsorbent. Similar trend is being tracked in most of the previous literature related to the dye removal.38–41
The findings are similar to previous studies as methylene blue is a cationic dye and its adsorption is favoured at basic pH. From the observation, we can deduce that an acidic condition is un favourable for the adsorption activities of geopolymers.41,42
 | ||
| Fig. 7 Effect of initial conc. and time on the MB adsorption over (a) GP-1M and (b) GP-2M (25 mL of MB solution was used at 28 °C and 150 rpm). | ||
Necessary to mention that both GP-1M and GP-2M exhibited similar adsorption capacities of 2.84 and 3.01 mg g−1, showing that extra phosphate has a negligible effect on adsorption properties of the geopolymers. Although the equilibrium was attained within first 90 minutes, but the process was extended up to 180 minutes to ensure the complete equilibrium. Most of the previous investigations have reported a similar behaviour of the adsorbents. The equilibrium time is specific for every material and most of the previous studies showed equilibrium time of 90–180 minutes. The equilibrium time is dependent on the surface area and porosity of the adsorbents.40,43
 | ||
| Fig. 8 Pseudo first order kinetics model (a) (GP-1M) and (b) GP-2M (25 mL of MB solution were used at 28 °C and 150 rpm). | ||
| GP | C0 (mg L−1) | k1 (min−1) | qe,cal (mg g−1) | R2 |
|---|---|---|---|---|
| GP-1M | 10 | 0.0419 | 0.3318 | 0.8674 |
| 30 | 0.0615 | 1.0440 | 0.8619 | |
| 50 | 0.1022 | 39.4639 | 0.5133 | |
| GP-2M | 10 | 0.0818 | 2.5887 | 0.5568 |
| 30 | 0.1093 | 35.4446 | 0.5826 | |
| 50 | 0.1037 | 88.3609 | 0.4811 |
The adsorption capacities calculated using PFO model not only show very poor fitting in terms of R2, but also represents a major difference between experimental and calculated values of adsorption capacities. The results suggest that MB adsorption using PAGP did not follow PFO model. Most of the previous studies, using solid adsorbent, also deviated from PFO model.8,42
As the PFO model is not followed by PAGPs, therefore pseudo second order (PSO) was used to determine the kinetics of MB adsorption on PAGPs. The plot of t/qt vs. t (PSO model) for the batch kinetics of GP-1M and GP-2M is presented in Fig. 9. The values of the rate constant (K2), adsorption capacity (qe) and R2 are given in Table 9. The results show best fitting in the range of 0.996–1, showing that PSO model is adopted by MB adsorption on PAGPs. Moreover, the findings were further supported by the closeness between the adsorption capacities of PSO model and experimental data.
 | ||
| Fig. 9 Pseudo second order kinetics model of (a) GP-1M and (b) GP-2M (25 mL of MB solutions were used at 28 °C and 150 rpm). | ||
| GP | C0 (mg L−1) | K2 (g mg−1 min) | qe,cal (mg g−1) | R2 |
|---|---|---|---|---|
| GP-1M | 10 | 0.6100 | 0.6297 | 1.000 |
| 30 | 0.4015 | 1.8718 | 1.000 | |
| 50 | 0.0653 | 2.9418 | 1.000 | |
| GP-2M | 10 | 0.4595 | 0.6306 | 1.000 |
| 30 | 0.0623 | 1.9468 | 0.998 | |
| 50 | 0.0169 | 3.3553 | 0.996 |
The results of the present study closely resemble with the previously reported ones. Most of the dye adsorptions on geopolymers, zeolites and fly ash follow PSO model.1,8,44,45 Azizian et al. explored the adsorption of MB on fly ash and concluded that at high initial conc. pseudo first order and at lower initial conc., pseudo second order is obeyed.44 The increase in adsorption capacity with increase in initial conc. of dye suggests that MB conc. provides a driving force to the dye molecules to accumulate on the adsorbent surface.8,40
 | ||
| Fig. 10 Isotherm plots of GP-1M and GP-2M (a) Langmuir isotherm, (b) Freundlich isotherm and (c) Temkin isotherm. | ||
| Isotherm | Parameters | GP-1M | GP-2M |
|---|---|---|---|
| Langmuir | qm (mg g−1) | 3.371 | 4.260 |
| KL (L mg−1) | 3.299 | 1.503 | |
| RL | 6.02 × 10⁻³ | 1.31 × 10⁻² | |
| R2 | 0.996 | 0.999 | |
| Freundlich | n | 2.912 | 1.705 |
| Kf | 1.943 | 2.377 | |
| R2 | 0.694 | 0.968 | |
| Temkin | B | 0.517 | 0.584 |
| A (L g−1) | 67.467 | 4.399 | |
| R2 | 0.909 | 0.943 |
Langmuir parameters have been used to predict the interaction between dye molecules and adsorbent using eqn (9).
 | (9) |
RL represents a dimensionless separation factor that gives a check of the verification, if the adsorption in the system studied is unfavourable (RL > 1), linear (RL = 1), favourable (0 < RL < 1), or irreversible (RL = 0). The RL values calculated for GP-1M and GP-2M are 6.02 × 10⁻³ and 1.31 × 10⁻², respectively; confirming that the adsorption process is favoured by these geopolymers. The increase in the value of RL for GP-2M compared to GP-1M suggest that MB adsorption is reversible at higher phosphate level in these geopolymer and also leading to increased dye intake as shown by higher qm value.5,8,38–40
 | ||
| Fig. 11 Adsorption capacity of GP-1M and GP-2M after regeneration (50 mL of 50 mg L−1 MB solutions were used at 28 °C and 150 rpm). | ||
This phenomenon is important as these geopolymers can be reused for several times by offering sustainability and industrial economy. This behaviour of geopolymers originated from the formation of new active surface sites due to the thermal treatment of PAGPs. As these polymers were cured at 80 °C, therefore extra heating have led to the dehydration of bonded and interstitial water molecules, thus causing more active sites and increased porosity.10 The phenomenon can be further supported by the XRD analysis of regenerated PAGPs (Fig. 5). The existence of new phases may have resulted in the increased porosity and formation of new adsorption sites. Liu et al. observed the increase in porosity of PAGPs as a result of thermal treatment.16
Conclusion
Geopolymers were prepared by phosphoric acid activation of metakaolin and were characterized using different analytical techniques. These geopolymers are thermally unchanging and consist of amorphous silico alumino phosphate structure. The amorphousity of PAGPS decreases with heating at 800 °C for 2 hours. The microstructure of these geopolymers is consisted of voids, macro and mesopores. PAGPs were studied as re-useable adsorbents for methylene blue removal. Methylene blue was successfully adsorbed on this new type of geopolymers and the maximum adsorption was achieved at pH 9 and 10. There was no effect of extra phosphoric acid on the adsorption properties of geopolymers, representing that P:Al = 1 is adequate for the synthesis of PAGPs. The process of adsorption followed Langmuir isotherm and pseudo second order kinetics. Geopolymers are thermally stable and have the ability to be regenerated using thermal activation. The material can be recycled for many times without any compromise on the adsorption properties. This new adsorbent has given a new window for methylene blue adsorption.
Acknowledgements
This work was supported by MOHE via FRGS grant no. 0153AB-i84.References
- M. Rafatullah, O. Sulaiman, R. Hashim and A. Ahmad, J. Hazard. Mater., 2010, 177, 70–80 CrossRef CAS PubMed.
- J. W. Lee, S. P. Choi, R. Thiruvenkatachari, W. G. Shim and H. Moon, Dyes Pigm., 2006, 69, 196–203 CrossRef CAS.
- V. K. Gupta and Suhas, J. Environ. Manage., 2009, 90, 2313–2342 CrossRef CAS PubMed.
- S. Banerjee, R. K. Gautam, A. Jaiswal, M. C. Chattopadhyay and Y. C. Sharma, RSC Adv., 2015, 5, 14425–14440 RSC.
- O. Hernandez-Ramirez and S. M. Holmes, J. Mater. Chem., 2008, 18, 2751–2761 RSC.
- K. Mukherjee, A. Kedia, K. J. Rao, S. Dhir and S. Paria, RSC Adv., 2015, 5, 30654–30659 RSC.
- D. Chatterjee, V. R. Patnam, A. Sikdar and S. K. Moulik, J. Chem. Eng. Data, 2010, 55, 5653–5657 CrossRef CAS.
- L. Li, S. Wang and Z. Zhu, J. Colloid Interface Sci., 2006, 300, 52–59 CrossRef CAS PubMed.
- S. Marković, A. Stanković, Z. Lopičić, S. Lazarević, M. Stojanović and D. Uskoković, J. Environ. Chem. Eng., 2015, 3, 716–724 CrossRef.
- M. Irfan Khan, K. Azizli, S. Sufian and Z. Man, Ceram. Int., 2015, 41, 2794–2805 CrossRef CAS.
- J. Davidovits, US Pat., US4349386 A, 1982.
- J. Davidovits, J. Therm. Anal., 1991, 37, 1633–1656 CrossRef CAS.
- J. L. Provis and S. A. Bernal, Annu. Rev. Mater. Res., 2014, 44, 299–327 CrossRef CAS.
- J. L. Provis, Mater. Struct., 2013, 47, 11–25 CrossRef.
- D. S. Perera, J. V. Hanna, J. Davis, M. G. Blackford, B. A. Latella, Y. Sasaki and E. R. Vance, J. Mater. Sci., 2008, 43, 6562–6566 CrossRef CAS.
- L.-P. Liu, X.-M. Cui, Y. He, S.-D. Liu and S.-Y. Gong, Mater. Lett., 2012, 66, 10–12 CrossRef CAS.
- L. Le-ping, C. Xue-min, Q. Shu-heng, Y. Jun-li and Z. Lin, Appl. Clay Sci., 2010, 50, 600–603 CrossRef.
- H. Douiri, S. Louati, S. Baklouti, M. Arous and Z. Fakhfakh, Mater. Lett., 2014, 116, 9–12 CrossRef CAS.
- P. Ptacek, D. Kubatova, J. Havlica, J. Brandstetr, F. Soukal and T. Opravil, Thermochim. Acta, 2010, 501, 24–29 CrossRef CAS.
- P. Ptáček, F. Frajkorová, F. Šoukal and T. Opravil, Powder Technol., 2014, 264, 439–445 CrossRef.
- A. Souri, F. Golestani-Fard, R. Naghizadeh and S. Veiseh, Appl. Clay Sci., 2015, 103, 34–39 CrossRef CAS.
- S. Lagergren, K. Sven. Vetenskapsakad. Handl., 1898, 24, 1–39 Search PubMed.
- I. Langmuir, J. Am. Chem. Soc., 1916, 38, 2221–2295 CrossRef CAS.
- H. Freundlich, J. Phys. Chem., 1906, 57, 385–470 CAS.
- M. Temkin and V. Pyzhev, Acta Physicochim. URSS, 1940, 12, 217–222 Search PubMed.
- J. L. Provis and S. A. Bernal, Annu. Rev. Mater. Res., 2014, 44, 299–327 CrossRef CAS.
- C. Sangwichien, G. L. Aranovich and M. D. Donohue, Colloids Surf., A, 2002, 206, 313–320 CrossRef CAS.
- M. Irfan Khan, K. Azizli, S. Sufian, Z. Man and A. S. Khan, RSC Adv., 2015, 5, 20788–20799 RSC.
- B. E. Glad and W. M. Kriven, J. Am. Ceram. Soc., 2013, 96, 3643–3649 CrossRef CAS.
- L. H. Li, J. Xiao, P. Liu and G. W. Yang, Sci. Rep., 2015, 5, 9028 CrossRef CAS PubMed.
- S. Louati, W. Hajjaji, S. Baklouti and B. Samet, Appl. Clay Sci., 2014, 101, 60–67 CrossRef CAS.
- İ. B. Topçu, M. U. Toprak and T. Uygunoğlu, J. Cleaner Prod., 2014, 81, 211–217 CrossRef.
- K. L. Aughenbaugh, R. T. Chancey, P. Stutzman, M. C. Juenger and D. W. Fowler, Mater. Struct., 2013, 46, 869–880 CrossRef CAS.
- M. L. Gualtieri, M. Romagnoli and A. F. Gualtieri, J. Eur. Ceram. Soc., 2015 Search PubMed.
- D. Cao, D. Su, B. Lu and Y. Yang, J. Chin. Ceram. Soc., 2005, 1385–1389 CAS.
- I. Majchrzak-Kucęba and W. Nowak, Thermochim. Acta, 2004, 413, 23–29 CrossRef.
- M. L. Gualtieri, M. Romagnoli, S. Pollastri and A. F. Gualtieri, Cem. Concr. Res., 2015, 67, 259–270 CrossRef.
- M. A. Islam, A. Benhouria, M. Asif and B. H. Hameed, J. Taiwan Inst. Chem. Eng., 2015, 52, 57–64 CrossRef CAS.
- M. Hasan, A. L. Ahmad and B. H. Hameed, Chem. Eng. J., 2008, 136, 164–172 CrossRef CAS.
- B. H. Hameed, J. Hazard. Mater., 2009, 162, 939–944 CrossRef CAS PubMed.
- B. H. Hameed, A. A. Ahmad and N. Aziz, Chem. Eng. J., 2007, 133, 195–203 CrossRef CAS.
- A. Nasrullah, H. Khan, A. S. Khan, Z. Man, N. Muhammad, M. I. Khan and N. M. Abd El-Salam, Sci. World J., 2015, 2015, 562693 Search PubMed.
- C. A. Almeida, N. A. Debacher, A. J. Downs, L. Cottet and C. A. Mello, J. Colloid Interface Sci., 2009, 332, 46–53 CrossRef CAS PubMed.
- S. Azizian, J. Colloid Interface Sci., 2004, 276, 47–52 CrossRef CAS PubMed.
- K. Rida, S. Bouraoui and S. Hadnine, Appl. Clay Sci., 2013, 83–84, 99–105 CrossRef CAS.
| This journal is © The Royal Society of Chemistry 2015 |