Effective catalytic hydrodechlorination of chlorophenoxyacetic acids over Pd/graphitic carbon nitride

Fang Jianga, Wenhui Tana, Huan Chen*a, Ling Tana and Jingliang Liub
aKey Laboratory of Jiangsu Province for Chemical Pollution Control and Resources Reuse, School of Environmental and Biological Engineering, Nanjing University of Science and Technology, Nanjing 210094, China. E-mail: hchen404@njust.edu.cn; Fax: +86-25-84315352; Tel: +86-25-84303209
bSchool of Biochemical Environmental and Engineering, Nanjing XiaoZhuang University, Nanjing 211171, China

Received 30th April 2015 , Accepted 29th May 2015

First published on 1st June 2015


Abstract

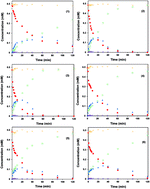
Catalytic hydrodechlorination (HDC) of chlorophenoxyacetic acids was performed over Pd/graphitic carbon nitride (Pd/g-C3N4) catalysts in the present work. A series of Pd/g-C3N4 catalysts were prepared by a deposition-precipitation method, and characterized by X-ray diffraction (XRD), N2 adsorption–desorption, transmission electron microscopy (TEM), CO chemisorption and X-ray photoelectron spectroscopy (XPS). The Pd/g-C3N4 catalysts showed excellent activity to convert dichlorophenoxyacetic acid (2,4-D) into phenoxyacetic acid (PA) and the catalytic activity was correlated with the ratio of Pd2+/(Pd0 + Pd2+) and Pd particle size. In addition, HDC of 2,4-D over Pd/g-C3N4 catalyst followed the Langmuir–Hinshelwood model, indicating an adsorption-controlled mechanism. Other chlorophenoxyacetic acids, such as 2-chlorophenoxyacetic acid (2-CPA), 4-chlorophenoxyacetic acid (4-CPA) and 2,4,5-trichlorophenoxyacetic acid (2,4,5-T) could also be completely dechlorinated to PA over Pd/g-C3N4 catalysts.


1. Introduction

Chlorophenoxyacetic acids, including 4-chlorophenoxyacetic acid (4-CPA), 2,4-dichlorophenoxyacetic acid (2,4-D) and 2,4,5-trichlorophenoxyacetic acid (2,4,5-T), are widely used as pesticides to control harmful plant pests.1–3 Relatively high levels of these components are found in surface and ground waters owing to their intensive use in agriculture. The consequent contamination caused by the residues has attracted extensive attention due to their high toxicity and carcinogenicity.4,5 In this case, many techniques have been developed to remove them, such as adsorption,6 advanced oxidation,7 photocatalysis8,9 and reductive dechlorination techniques.10 Zero-valent iron (nZVI) reduction has been proved to be an effective technology for the conversion of chlorophenoxyacetic acid to less toxic compounds.11,12 However, subsequent treatment processes are required for the removal of Fe2+ formed in the reaction. Some developments were made by using an electrochemical approach for the dechlorination of chlorophenoxy herbicides.13–15 Sun et al.15 reported an effective electrochemical reductive dechlorination process of 2,4-D and found that 2-chlorophenoxyacetic acid (2-CPA) and phenoxyacetic acid (PA) were the main dechlorinated products. Recently, Zhu et al.16 investigated a combination of nZVI reduction with electrochemical method for enhanced catalytic hydrodechlorination of 2,4-D.

An alternative approach for the removal of chlorophenoxyacetic acids is liquid phase catalytic hydrodechlorination (HDC), which is one of the most effective and environmentally friendly methods for the abatement of many organochlorinated pollutions, such as chlorophenols,17–19 chlorobenzenes20,21 and halogenated hydrocarbons,22,23 etc. More recently, Diaz et al.24 explored the HDC process of 2,4-D and found that 2,4-D could be dechlorinated to 2-CPA and PA. Besides of this, there are no far investigations on HDC of chlorophenoxyacetic acids and the reaction mechanism is also scarce.

Previous literatures on HDC of organochlorinated pollutions have demonstrated the important role of Pd active species on catalytic efficiency.25,26 The dependence of HDC activity on Pd particle size was investigated, while no general consensus has been achieved. Gómez-Quero et al.27 investigated the effect of metal particle size on the HDC of 2,4-dichlorophenol over Pd/Al2O3 catalysts and found that a higher activity was achieved over smaller Pd particles. Nevertheless, a volcano-type dependence of catalytic activity on Pd particle size was observed in HDC of chloroacetic acid over Pd/ZrO2 catalysts.28 Apart from Pd particle size, Pd electronic structure is another key factor which markedly affects the catalytic activity. Gómez-Sainero et al.29 studied the catalytic HDC of CCl4 over Pd/AC and found both Pd0 and Pdn+ species had effect on HDC efficiency. Similar conclusions were obtained in HDC of 2,4-dichlorophenol over mesoporous carbon supported Pd catalysts.25 Besides of Pd supported catalysts, bimetallic catalysts, such as Pd–Fe,30 Pd–Rh,31 Pd–Cu,32 were approved to be efficient catalysts to treat many organochlorinated pollutions.

Carbon nitride is a fascinating material which has attracted worldwide attention for its excellent textural properties and extreme chemical and thermal stability.33,34 We have recently shown that the carbon nitride material was an effective support for Pd dispersion due to its nitrogen functionalities, which could serve as active sites to anchor Pd particle,35 and the Pd/graphitic carbon nitride catalysts (Pd/g-C3N4) prepared by photo-deposition method could be used in catalytic hydrodechlorination of 2,4-dichlorophenol.36 Similarly, Feng et al.37 prepared an effective palladium catalyst supported on carbon–nitrogen composites for aqueous-phase hydrogenation of phenol.

In order to get further insight about the effect of Pd properties on HDC of chlorophenoxyacetic acids, we used deposition-precipitation method to prepare a series of Pd/g-C3N4 catalysts, and these catalysts were tested in HDC of 2-CPA, 4-CPA, 2,4-D and 2,4,5-T in this work. Results showed that chlorophenoxyacetic acids could be completely dechlorinated to PA, revealing the potential of the liquid phase catalytic HDC method to remove chlorophenoxyacetic acids.

2. Experimental

2.1. Catalyst preparation

Graphitic carbon nitride (g-C3N4) was synthesized by directly thermal polymerization of cyanamide (CN–NH2) at 550 °C for 4 h.33,36 The obtained g-C3N4 was ground to pass through a 400-mesh sieve. Supported Pd catalysts were prepared using deposition-precipitation method. Typically, 0.5 g of sieved g-C3N4 was dispersed in 50 mL PdCl2 solution and then the pH of the solution was adjusted with 1 M NaOH. After stirring for 1 h, a certain amount of NaBH4 in 0.2 mol L−1 NaOH solution was added dropwise and stirred for another 1 h. The obtained catalysts were filtrated and washed with distilled water several times till no chloride ion was detected. The resultant catalysts dried at 70 °C are denoted as Pd(x)/g-C3N4, where x is the Pd loading amount (wt%). A series of catalysts with different parameters were summarized in Table 1. In order to gain catalyst 1, 2, 3 and 4, we added different amounts of NaBH4, while the amount of PdCl2 solution and the pH during deposition-precipitation process was the same for these catalysts. Besides, the only difference among catalysts 3, 5 and 6 was pH values during precipitation. In comparison with catalyst 3, 7, 8 and 9, different amounts of PdCl2 solution were added to obtain catalysts with different Pd loading. Prior to activity evaluation, all catalysts were ground to pass through a 400-mesh sieve (<37 μm) to make sure negligible intraparticular diffusion.38
Table 1 Textural property of g-C3N4 and the Pd/g-C3N4 catalysts
Serial number Catalysta pHb NaBH4[thin space (1/6-em)]:[thin space (1/6-em)]Pdc (mol mol−1) SBETd (m2 g−1)
a The Pd content were determined by ICP.b The pH value during catalyst preparation.c The molar ratio of NaBH4 and Pd during catalyst preparation.d Determined by N2 adsorption–desorption using the Brunauer–Emmett–Teller (BET) method.
g-C3N4 57.35
1 Pd(2.09)/g-C3N4 10 0.5[thin space (1/6-em)]:[thin space (1/6-em)]1 56.42
2 Pd(1.94)/g-C3N4 10 1[thin space (1/6-em)]:[thin space (1/6-em)]1 55.87
3 Pd(1.96)/g-C3N4 10 3[thin space (1/6-em)]:[thin space (1/6-em)]1 49.15
4 Pd(2.07)/g-C3N4 10 10[thin space (1/6-em)]:[thin space (1/6-em)]1 49.22
5 Pd(1.98)/g-C3N4 9 3[thin space (1/6-em)]:[thin space (1/6-em)]1 30.65
6 Pd(1.93)/g-C3N4 8 3[thin space (1/6-em)]:[thin space (1/6-em)]1 35.40
7 Pd(0.46)/g-C3N4 10 3[thin space (1/6-em)]:[thin space (1/6-em)]1 54.68
8 Pd(0.98)/g-C3N4 10 3[thin space (1/6-em)]:[thin space (1/6-em)]1 49.51
9 Pd(4.11)/g-C3N4 10 3[thin space (1/6-em)]:[thin space (1/6-em)]1 40.80


2.2. Catalyst characterization

The Pd content was determined by ICP-MS (OPTIMA7000DV, Perkin Elmer, US). Before measurement, the catalysts were digested by mixed acid digestion.

X-ray diffraction (XRD) patterns of the catalysts were recorded on a Rigaku D/max-RA powder diffraction-meter. The wavelength of the beam was 0.154 nm. The XRD patterns were scanned in the 2θ range of 10–80° with step width 0.05°. Plots of the 2θ data were generated from the EVA software developed by Bruker.

Brunauer–Emmett–Teller (BET) specific surface areas of the support and catalysts were obtained from the N2 adsorption–desorption isotherms, measured at 77 K using Micromeritics ASAP 2020. Before measurement, the samples were outgassed at 250 °C for 4 h.

The morphologies of the catalysts were observed on a transmission electron microscope (JEM-2100, JEOL, Japan). The average Pd particle size could be quantified using equation:39

 
image file: c5ra07913f-t1.tif(1)
where ni is the number of Pd particles with diameter of di, the total number (∑ni) is larger than 100.

X-ray photoelectron spectroscopy (XPS) was conducted on a PHI5000 Versa Probe equipped with a monochromatized Al Kα excitation source ( = 1486.6 eV) (ULVAC-PHI, Japan).

Pd dispersion of the catalysts was determined by CO chemisorption measurement. 200 mg of reduced catalyst was flushed by Ar flow (30 mL min−1) at 200 °C for 1 h. After the temperature of the catalyst was cooled down, the CO chemisorption was conducted with pulses of 0.4 mL. The Pd dispersion was calculated on the assumption of adsorption stoichiometry of Pd/CO = 1.40

2.3. Hydrodechlorination experiments

The liquid phase catalytic hydrodechlorination experiments were conducted in a 250 mL three-necked flask reactor with vigorous stirring (1200 rpm) at atmospheric pressure. The reaction temperature was maintained at 25 °C by a thermostatic water bath. Typically, 40.0 mg of catalyst was added to 200 mL of 0.48 mmol L−1 reactant solution with the pH prejusted to 11.0 by 1 M NaOH. After purged with a N2 (60 mL min−1) for 30 min, H2 was switched into the reactor (60 mL min−1). The samples were taken periodically, filtrated with 0.45 μm membrane and neutralized with 1 M HCl. The concentrations of the reactant and products were quantified by HPLC with a UV/Visible Detector (Waters 2489) at 285 nm using a 4.6 × 250 mm C18 column. A mixture of methanol and 5% acetic acid (60[thin space (1/6-em)]:[thin space (1/6-em)]40, v[thin space (1/6-em)]:[thin space (1/6-em)]v) was selected as mobile phase.

The effect of mass transfer limitation under the reaction condition was evaluated. HDC of 2,4-D over catalyst 3 with different catalyst dosages was compared and the results were presented in Fig. 1S (see ESI). Increasing catalyst dosage enhanced the HDC efficiency; while the dosage normalized initial activities remained nearly constant, indicating the absence of mass transfer limitation.41 The initial activity was calculated by the removal rate of 2,4-D within initial 3 min.

3. Results and discussion

3.1. Catalyst properties

Textural properties of support and catalysts are summarized in Table 1. The Pd loading slightly varied around the theoretical value 2% for catalysts prepared with different amount of NaBH4 and pH (catalyst 1 to 6), suggesting that the preparation condition had no significant influence on Pd loading. Additionally, the BET surface areas (SBET) of catalyst 1 to 9 were smaller than g-C3N4 material, indicating the loading of Pd resulted in a slight drop in SBET.

The XRD patterns of g-C3N4 and Pd/g-C3N4 catalysts are compiled in Fig. 2S. Clearly, g-C3N4 has two distinct peaks at 13.1° and 27.7°, which are indexed as (100) and (002) diffraction, respectively (JCPDS 87-1526). The intensities of the two peaks slightly decreased for catalyst 1 to 9, attributed to the introduction of Pd. However, there was no diffraction peaks assigned to metallic or oxide Pd in all catalysts, implying of a high Pd dispersion.

3.2. Liquid phase catalytic HDC of 2,4-D

3.2.1. Effect of the catalyst preparation condition. Liquid phase catalytic HDC of 2,4-D over catalyst 1 to 6 are summarized in Fig. 1. For all catalysts, 2-CPA and 4-CPA were the partially dechlorinated products and PA was the ultimate dechlorinated product. The total amount of 2,4-D, 2-CPA, 4-CPA and PA during the procedure was approximately equaled to the initial amount of 2,4-D, reflecting of the absence of other dechlorinated product. The catalytic HDC of organochlorinated pollutions may be completed via stepwise or/and concerted pathways. As reported for HDC pathway of 2,4-dichlorophenol, the substituted Cl can be removed by two stepwise routes with 2-chlorophenol or 4-chlorophenol as reaction intermediates or by the simultaneous removal of both substituted Cl; both of the two routes produced phenol as the final HDC product.42 A possible reaction pathway for HDC of 2,4-D was depicted in Scheme 1. H2 was activated by Pd and then reacted with 2,4-D, consequently 2-CPA, 4-CPA and PA were formed by the breaking of the C–Cl bond. Afterwards, the produced 2-CPA and 4-CPA could react with active H to PA.
image file: c5ra07913f-f1.tif
Fig. 1 Liquid phase catalytic HDC of 2,4-D over catalyst 1, 2, 3, 4, 5 and 6. (image file: c5ra07913f-u1.tif) 2,4-D, (image file: c5ra07913f-u2.tif) 2-CPA, (image file: c5ra07913f-u3.tif) 4-CPA, (image file: c5ra07913f-u4.tif) PA and (image file: c5ra07913f-u5.tif) total amount.

image file: c5ra07913f-s1.tif
Scheme 1 Dechlorination pathways of the liquid phase catalytic HDC of 2-CPA, 4-CPA, 2,4-D and 2,4,5-T.

Notably, the concentration of 2-CPA was much higher than that of 4-CPA in all HDC processes over these catalysts in Fig. 1, indicating that the para-position Cl atom was more susceptible to be eliminated than ortho-position Cl as a result of steric hindrance. The role of steric hindrance has also been reported in HDC of 2,4-dichlorophenol, as well as electrocatalytic dechlorination of 2,4-D.15,16

Among the Pd/g-C3N4 catalysts prepared with different amount of NaBH4 (catalyst 1 to 4), catalyst 3 possessed the highest catalytic activity. After reaction for 90 min, 0.48 mmol 2,4-D was completely dechlorinated to PA. The catalytic efficiency varied in the order catalyst 3 > catalyst 2 > catalyst 4 > catalyst 1. In comparison with Pd/g-C3N4 prepared in different pH condition (catalyst 3, 5 and 6), the catalytic efficiency followed the order catalyst 3 > catalyst 5 > catalyst 6, suggesting that Pd/g-C3N4 prepared in high pH solution favored the HDC process.

Considering the reason causing the difference in catalytic activity among these Pd/g-C3N4 catalysts, we should know that the catalytic activities are relevant to the properties of Pd, such as Pd particle size and Pd species. To obtain the morphology and dispersion of Pd particles, TEM and CO chemisorptions measurements were investigated. The TEM images of catalyst 1 to 6 are displayed in Fig. 2, with uniform Pd particles clearly identified in all catalysts. The average sizes of the Pd particles calculated by eqn (1) are listed in Table 2. The Pd dispersions measured by CO chemisorption are also listed in Table 2. They were found to be 44.20%, 48.13%, 46.31%, 45.66%, 45.68% and 48.52% for catalyst 1 to 6, respectively. The corresponding Pd particle sizes calculated from CO chemisorption was consistent with the results of TEM. Both TEM and CO chemisorption results indicated that these catalysts exhibited very similar Pd dispersion and Pd particle size, thus the Pd particle size was not a major factor causing the differences in HDC activities among these catalysts. Worth noting is Pd dispersion on these catalysts was relevantly high. The interaction between the pyridine nitrogen groups and the Pd nanoparticles enabled high Pd dispersion on the g-C3N4 support. A previous work has also shown well-dispersed Pd nanoparticles on NH3 functionalized carbon nanofibers, which attributed to the similar interaction between the pyridinic nitrogen and Pd nanoparticles.43


image file: c5ra07913f-f2.tif
Fig. 2 TEM images of catalyst 1, 2, 3, 4, 5 and 6.
Table 2 Pd properties and parameters of XPS spectra of catalysts 1 to 9
Catalyst CO uptakea (μmol g−1) Pd dispersiona (%) Average Pd diameter (nm) Binding energy (eV) Pd2+/(Pd0 + Pd2+)
d1a d2b Pd0 Pd2+
a Calculated from CO chemisorption.b Calculated from TEM.
1 86.8 44.20 2.54 2.51 335.2 337.3 0.71
2 87.7 48.13 2.33 2.40 335.2 337.1 0.64
3 85.3 46.31 2.43 2.57 335.5 337.2 0.50
4 88.8 45.66 2.46 2.47 335.1 337.0 0.39
5 85.0 45.68 2.46 2.49 335.2 337.2 0.42
6 88.0 48.52 2.31 2.69 335.2 337.2 0.41
7 25.5 59.00 1.90 2.07 335.0 337.0 0.64
8 45.1 48.98 2.29 2.36 335.2 337.0 0.55
9 110.3 28.55 3.93 4.22 335.3 337.1 0.46


XPS was performed to understand the surface chemical states of Pd species on Pd/g-C3N4, and the results were illustrated in Fig. 3. The binding energy of Pd 3d5/2 around 335.2 eV and 337.2 eV could be attributed to the presence of Pd0 and Pd2+ species, respectively. Upon NaBH4 reduction treatment, Pd2+ is partially retained due to the stabilization of Pd2+ by interaction of Pd2+ to N-containing groups, such as pyridine nitrogen groups which existed on the support surface.44,45 The intensity of Pd2+ species decreased when the amount of NaBH4 increased during catalyst preparation (catalyst 1 to 4), indicating weakened interaction. The ratios of Pd2+/(Pd0 + Pd2+) in these catalysts are summarized in Table 2. It can be clearly seen that the ratio of Pd2+/(Pd0 + Pd2+) decreased from 0.71 (catalyst 1) to 0.39 (catalyst 4), reflecting of decreased Pd2+ content. For samples prepared in different pH, the ratios of Pd2+/(Pd0 + Pd2+) followed the order catalyst 3 (pH 10) > catalyst 5 (pH 9) > catalyst 6 (pH 8), implying that higher Pd2+ content existed in the catalyst prepared in higher pH condition. As reported, the isoelectric point of g-C3N4 was around 2.0.36 The zeta potential of g-C3N4 decreased as elevating the solution pH, caused strengthening of the interaction between Pd2+ and negative g-C3N4. As a result, more Pd2+ species were retained during the NaBH4 reduction process at high pH solution.


image file: c5ra07913f-f3.tif
Fig. 3 XPS profiles of Pd 3d spectra on catalyst 1, 2, 3, 4, 5 and 6. Black line refers to the experimental data; red line refers to the fitting curve; blue line refers to Pd0; green line refers to Pd2+.

More information was gained by the comparison of turnover frequency (TOF) versus ratios of Pd2+/(Pd0 + Pd2+) as shown in Fig. 4. As shown in Fig. 4, the initial activity and TOF increased with the ratio up to 0.5, and then progressively decreased. During the process, molecular H2 could chemisorb and activated on the surface of Pd0, whereas 2,4-D tended to chemisorb onto Pd2+ by slightly electrostatic attraction for the presence of chloride anion in 2,4-D. Thus, both Pd0 and Pd2+ could affect the catalytic activity of Pd/g-C3N4. Similar result has been depicted by Gómez-Sainero et al.29 on liquid-phase hydrodechlorination of CCl4. It was demonstrated that the HDC reaction rate was related to the amount of Pd0 and Pdn+, and the maximum reaction rate achieved when [Pdn+]/[Pd0] = 1. Here, we observed that a maximum reaction rate could be obtained in the catalyst 3 with Pd2+/(Pd0 + Pd2+) = 0.5, which demonstrated that both Pd0 and Pd2+ species play an important and complementary role on HDC reaction. A dual mechanism was also proposed by Ordóñez et al.46 to explain the HDC of tetrachloroethylene (TTCE) over supported Pd catalysts. They found that Pd2+ could form a complex with TTCE, and then the complex was attacked by hydrogen activated by Pd0. A reaction scheme similar to previous reports can be proposed: 2,4-D can form a complex with the Pd2+, and this complex will be attacked by the hydrogen to accomplish the Cl–H exchange, which is accomplished by the reduction of the Pd2+ to Pd0 (as speculated in HDC of TTCE46). The XPS spectra of used catalyst 3 shown in Fig. 3S confirmed the reaction scheme. As seen, some Pd2+ species were reduced to Pd0 during the HDC process, causing the increasing amount of Pd0.


image file: c5ra07913f-f4.tif
Fig. 4 Initial activity and TOF of the Pd/g-C3N4 catalysts versus Pd2+/(Pd0 + Pd2+) for HDC of 2,4-D.
3.2.2. Effect of Pd loading amount. Pd(x)/g-C3N4 catalysts with different Pd loading amounts were employed for HDC of 2,4-D. As shown in Fig. 5, the catalytic efficiency enhanced with Pd loading amount ranging from 0.46% to 4.11%. To obtain a further understanding of the relationship between catalytic activity and Pd properties, the Pd particle size and species of Pd(x)/g-C3N4 catalysts were analyzed by TEM, CO chemisorption and XPS measurement. TEM images of catalyst 7, 8 and 9 are given in Fig. 6, where increasing Pd loading amount resulted in rising Pd particle size. As listed in Table 2, the average Pd particle sizes calculated by eqn (1) were 2.07, 2.36 and 4.22 nm for catalyst 7, 8 and 9, respectively. The Pd particle sizes calculated from CO chemisorption were also listed in Table 2, with analogous results of TEM. The enlarged Pd particles were caused by the aggregation of the Pd particles with high loading.47,48 Pd species on catalyst 7, 8 and 9 were investigated by XPS measurement and the results were displayed in Fig. 4S. The Pd 3d5/2 peaks assigned to Pd0 (around 335.2 eV) and Pd2+ (around 337.2 eV) species were appeared for all catalysts. An apparent decrease of Pd2+/(Pd0 + Pd2+) was observed when raising the Pd loading. The lower Pd2+/(Pd0 + Pd2+) ratio in high Pd loading reflected the weakened interaction between Pd and g-C3N4 support, induced by larger Pd particle size on the catalyst surface. The variation trend of metal support interaction with Pd loading was also observed in other catalysts, such as Pd supported on boron-doped mesoporous carbon49 and Pd/ZrO2.28
image file: c5ra07913f-f5.tif
Fig. 5 Liquid phase catalytic HDC of 2,4-D over catalyst 3, 7, 8 and 9.

image file: c5ra07913f-f6.tif
Fig. 6 TEM images of catalyst 7, 8 and 9.

Further insight was acquired by investigating the TOF versus Pd particle size and Pd species. Fig. 7a demonstrated a steep enhancement of TOF with Pd particle size increased from 1.90 to 2.54 nm, while further increase of Pd particle size caused a gentle increase in TOF, suggesting that the reaction is structure sensitive. This effect of structure sensitive has been found in other hydrodechlorination reactions. Aramendía et al.50 studied the liquid-phase HDC of chlorobenzene over Pd-supported catalysts; they found the reaction is structure-sensitive and the increase in dispersion leads to a decrease in TOF. Díaz et al.51 studied the Pd-catalyzed aqueous-phase trichloroethylene hydrodechlorination and found the reaction is strongly structure sensitive, being the largest Pd particles the most active. They considered the formation of palladium hydrides in the catalyst was especially important to the catalytic activity.


image file: c5ra07913f-f7.tif
Fig. 7 TOF of catalyst 3, 7, 8 and 9 versus (a) Pd particle size and (b) Pd2+/(Pd0 + Pd2+) for liquid phase catalytic HDC of 2,4-D. The dashed line in (b) was the result in Fig. 4.

Notably, TOF versus the ratio of Pd2+/(Pd0 + Pd2+) exhibited in Fig. 7b differed from the result of Fig. 4 (the dashed line). It indicated that the variation of TOF was related to both Pd particle size and Pd species. As mentioned above, the activation of H2 and C–Cl bond was believed to be two crucial steps during the HDC process of 2,4-D. Small Pd particles with high Pd2+ content facilitated the activation of C–Cl bond, while catalyst with large Pd particles would boost H2 activation due to the formation of β-PdH.50 Hence, although the Pd(2.09)/g-C3N4 had the most appropriate ratio of Pd2+/(Pd0 + Pd2+), the TOF was lower than that of Pd(4.11)/g-C3N4, confirming the important role of Pd particle size on catalytic activity.

3.2.3. Effect of 2,4-D adsorption. Adsorption of reactants was considered to be a critical effect on HDC of many chlorinated organics, such as 2,4-dichlorophenol52 and chloroacetic acids.28 In order to clarify the influence of adsorption on catalytic activity, HDC of 2,4-D with different initial concentration was examined and the initial catalytic activity was shown in Fig. 8a. With the increase of 2,4-D concentration from 0.23 to 2.71 mM, the initial catalytic activity increased from 21.21 to 65.66 mM gcat−1 h−1, while further increase of 2,4-D concentration caused little enhancement in initial catalytic activity. This phenomenon can be described by the Langmuir–Hinshelwood model:23,53
 
image file: c5ra07913f-t2.tif(2)
 
image file: c5ra07913f-t3.tif(3)
where r0 is the initial catalytic activity at concentration C, θs is the 2,4-D coverage on the catalyst surface, k is the apparent reaction rate constant and b is the equilibrium constant for 2,4-D adsorption on the catalyst.

image file: c5ra07913f-f8.tif
Fig. 8 (a) Initial activity of catalyst 3 as a function of initial 2,4-D concentration and (b) linear plot of 1/r0 versus 1/C.

The plot of 1/r0 with 1/C is further summarized in Fig. 8b. A good linear relationship (R2 > 0.97) suggested that the HDC of 2,4-D could be well described by Langmuir–Hinshelwood model and the reaction was controlled by 2,4-D adsorption on the catalyst surface. Such phenomena was also be observed by Wu et al.;54 they found the liquid phase hydrodechlorination of diclofenac over Pd/CeO2 could be well described using the Langmuir–Hinshelwood model, indicating the adsorption of reactor was crucial to catalytic efficiency.

3.3. HDC of other chlorophenoxyacetic acid

The liquid phase catalytic HDC of 2-CPA, 4-CPA and 2,4,5-T over catalyst 3 is compared in Fig. 9. For all of the chlorophenoxyacetic acids, the completely dechlorinated product was PA. In comparison of monochlorophenoxyacetic acids, 2-CPA could be completely dechlorinated within 40 min, while the dechlorination of 4-CPA was accomplished within 20 min. The catalytic activities were summarized in Table 3. The steric hindrance caused the difference between the catalytic activities for 2-CPA and 4-CPA, so that the para-position Cl atom was more susceptible to be eliminated than ortho-position Cl. The selectivities of dechlorinated products in HDC of chlorophenoxyacetic acids were summarized in Table 3. The selectivity could be defined as:55
 
image file: c5ra07913f-t4.tif(4)
where C0,reactant is the concentration of reactant at the beginning of the hydrodechlorination process, Ct,reactant is the concentration of reactant at time t, Ct,production is the concentration of production at time t.

image file: c5ra07913f-f9.tif
Fig. 9 Liquid phase catalytic HDC of 2-CPA, 4-CPA and 2,4,5-T over catalyst 3.
Table 3 Initial activity and selectivity for HDC of chlorophenoxyacetic acids over catalyst 3
  Initial activity (mM gcat−1 h−1) S2,4-D (%) S2,5-D (%) S2-CPA (%) S4-CPA (%) SPA (%)
t10 t30 t10 t30 t10 t30 t10 t30 t10 t30
2-CPA 61.78 100 100
4-CPA 80.56 100 100
2,4-D 40.08 49.62 31.28 1.47 0.52 54.13 70.23
2,4,5-T 9.64 23.32 12.95 12.59 6.63 14.38 13.92 0.006 56.14 70.42


It was found that the selectivity of 2-CPA was much higher than that of 4-CPA in HDC of 2,4-D at reaction time of 10 min and 30 min. The higher dechlorinated rate of 4-CPA and the higher selectivity of 2-CPA in HDC of 2,4-D could be attributed to steric effect. Cl on the ortho-position of 2,4-D was less susceptible to be attacked than Cl on the para-position. The possible dechlorination pathway of 2,4,5-T is presented in Scheme 1. 2,4-D, 2,5-D, 2-CPA, 4-CPA and PA were detected as the dechlorinated products during the HDC process of 2,4,5-T, while 4,5-D and 5-CPA were not detected. The selectivity of each product in HDC of 2,4,5-T at the reaction time of 10 and 30 min was listed in Table 3. As can be seen, the selectivity of 2,4-D and 2-CPA was much higher than that of 2,5-D and 4-CPA, indicating that 2,4-D and 2-CPA were the main partially dechlorinated products.

4. Conclusions

In the present study, Pd catalysts supported on g-C3N4 were prepared and the liquid phase catalytic hydrodechlorination of chlorophenoxyacetic acids was investigated. Chlorophenoxyacetic acids, including 2-CPA, 4-CPA, 2,4-D and 2,4,5-T, could be completely dechlorinated to PA. Both Pd2+ and Pd0 are the active sites in HDC process, and the catalytic activity is related to the ratio of Pd2+/(Pd0 + Pd2+). A volcano-shape dependence of initial activity and TOF on Pd2+/(Pd0 + Pd2+) was found, and catalyst 3 with Pd2+/(Pd0 + Pd2+) = 0.5 had a maximum activity. Apart from Pd species, the HDC of 2,4-D was also related to the Pd particle size, wherein large Pd particles favored HDC process. Moreover, the HDC of 2,4-D over catalyst 3 followed Langmuir–Hinshelwood model, reflecting an adsorption-controlled mechanism. Findings in this work clearly demonstrate the potential of liquid phase catalytic HDC to effectively remove chlorophenoxyacetic acids.

Acknowledgements

The financial supports from the Natural Science Foundation of China (no. 51208257, 51178223 and 51478223) and the natural science foundation of Jiangsu Province (BK2012405), China Postdoctoral Science Foundation (no. 2013M541677), the Jiangsu Planned Projects for Postdoctoral Research Funds (1202007B) and the Fundamental Research Funds for the Central University (no. 30920140112010) are gratefully acknowledged.

References

  1. B. Boye, M. Dieng and E. Brillas, Environ. Sci. Technol., 2002, 36, 3030 CrossRef CAS.
  2. J. Peller, O. Wiest and P. V. Kamat, J. Phys. Chem. A, 2004, 108, 10925 CrossRef CAS.
  3. Y. R. Wang and W. Chu, Water Res., 2011, 45, 3883 CrossRef CAS PubMed.
  4. M. V. Shankar, S. Anandan, N. Venkatachalam, B. Arabindoo and V. Murugesan, Chemosphere, 2006, 63, 1014 CrossRef CAS PubMed.
  5. F. Sannino, P. Pernice, L. Minieri, G. A. Camandona, A. Aronne and D. Pirozzi, ACS Appl. Mater. Interfaces, 2015, 7, 256 CAS.
  6. D. M. Han, W. P. Jia and H. D. Liang, J. Environ. Sci., 2010, 22, 237–241 CrossRef CAS.
  7. B. Boye, M. M. Dieng and E. Brillas, Environ. Sci. Technol., 2002, 36, 3030 CrossRef CAS.
  8. Y. H. Tang, S. L. Luo, Y. R. Teng, C. B. Liu, X. L. Xu, X. L. Zhang and L. Chen, J. Hazard. Mater., 2012, 241–242, 323 CrossRef CAS PubMed.
  9. K. T. Ranjit, I. Willner, S. H. Bossmann and A. M. Braun, Environ. Sci. Technol., 2001, 35, 1544 CrossRef CAS.
  10. A. I. Tsyganok and K. Otsuka, Appl. Catal., B, 1999, 22, 15 CrossRef CAS.
  11. A. S. Fjordbøge, A. Baun, T. Vastrup and P. Kjeldsen, Chemosphere, 2013, 90, 627 CrossRef PubMed.
  12. H. Y. Zhou, J. Han, S. A. Baig and X. H. Xu, J. Hazard. Mater., 2011, 198, 7 CrossRef CAS PubMed.
  13. Y. H. Xu, Q. Q. Cai, H. X. Ma, Y. He and H. Zhang, Electrochim. Acta, 2013, 96, 90 CrossRef CAS PubMed.
  14. K. R. Zhu, S. A. Baig, J. Xu, T. T. Sheng and X. H. Xu, Electrochim. Acta, 2012, 69, 389 CrossRef CAS PubMed.
  15. C. Sun, S. A. Baig, Z. Lou, J. Zhu, Z. X. Wang, X. Li, J. H. Wu, Y. F. Zhang and X. H. Xu, Appl. Catal., B, 2014, 158–159, 38 CrossRef CAS PubMed.
  16. K. R. Zhu, C. Sun, H. Chen, S. A. Baig, T. T. Sheng and X. H. Xu, Chem. Eng. J., 2013, 223, 192 CrossRef CAS PubMed.
  17. C. B. Molina, A. H. Pizarro, J. A. Casas and J. J. Rodriguez, Appl. Catal., B, 2014, 148–149, 330 CrossRef CAS PubMed.
  18. G. Yuan and M. A. Keane, J. Catal., 2004, 225, 510 CrossRef CAS PubMed.
  19. E. Diaz, A. F. Mohedano, J. A. Casas, L. Calvo, M. A. Gilarranz and J. J. Rodriguez, Appl. Catal., B, 2011, 106, 469 CrossRef CAS PubMed.
  20. N. Seshu Babu, N. Lingaiah and P. S. Sai Prasad, Appl. Catal., B, 2012, 111, 309 CrossRef PubMed.
  21. J. X Chen, T. Guo, K. Lia and L. M. Sun, Catal. Sci. Technol., 2015, 5, 2670 Search PubMed.
  22. K. Mackenzie, H. Frenzel and F. D. Kopinke, Appl. Catal., B, 2006, 63, 161 CrossRef CAS PubMed.
  23. Z. M. de Pedro, J. A. Casas, L. M. Gomez-Sainero and J. J. Rodriguez, Appl. Catal., B, 2010, 98, 79 CrossRef CAS PubMed.
  24. E. Diaz, A. F. Mohedano, J. A. Casas, L. Calvo, M. A. Gilarranz and J. J. Rodriguez, Catal. Today, 2015, 241, 86 CrossRef CAS PubMed.
  25. Y. Shao, Z. Y. Xu, H. Q. Wan, Y. Q. Wan, H. Chen, S. R. Zheng and D. Q. Zhu, Catal. Commun., 2011, 12, 1405 CrossRef CAS PubMed.
  26. N. Seshu Babu, N. Lingaiah, R. Gopinath, P. Siva Sankar Reddy and P. S. Sai Prasad, J. Phys. Chem. C, 2007, 111, 6447 Search PubMed.
  27. S. Gómez-Quero, F. Cárdenas-Lizana and M. A. Keane, Ind. Eng. Chem. Res., 2008, 47, 6841–6853 CrossRef.
  28. J. Zhou, Y. X. Han, W. J. Wang, Z. Y. Xu, H. Q. Wan, D. Q. Yin, S. R. Zheng and D. Q. Zhu, Appl. Catal., B, 2013, 134–135, 222 CrossRef CAS PubMed.
  29. L. M. Gómez-Sainero, X. L. Seoane, J. L. G. Fierro and A. Arcoya, J. Catal., 2002, 209, 279 CrossRef.
  30. I. A. Witońska, M. J. Walock, M. Binczarski, M. Lesiak, A. V. Stanishevsky and S. Karski, J. Mol. Catal. A: Chem., 2014, 393, 248 CrossRef PubMed.
  31. J. A. Baezaa, L. Calvo, J. J. Rodriguez, E. Carbó-Argibay, J. Rivas and M. A. Gilarranz, Appl. Catal., B, 2015, 168–169, 283 CrossRef PubMed.
  32. P. Benito, M. Gregori, S. Andreoli, G. Fornasari, F. Ospitali, S. Millefanti, M. Sol Avila, T. F. Garetto and S. Albonetti, Catal. Today, 2015, 246, 108 CrossRef CAS PubMed.
  33. X. C. Wang, K. Maeda, A. Thomas, K. Takanabe, G. Xin, J. M. Carlsson, K. Domen and M. Antonietti, Nat. Mater., 2008, 8, 76 CrossRef PubMed.
  34. J. Zhang, X. Chen, K. Takanabe, K. Maeda, K. Domen, J. D. Epping, X. Fu, M. Antonietti and X. Wang, Angew. Chem., Int. Ed., 2010, 49, 441 CrossRef CAS PubMed.
  35. P. Zhang, F. Jiang and H. Chen, Chem. Eng. J., 2013, 234, 195 CrossRef CAS PubMed.
  36. W. H. Tan, T. Li, F. Jiang, H. Chen and J. L. Liu, China Environ. Sci., 2014, 34, 3099 Search PubMed.
  37. G. Feng, P. Chen and H. Lou, Catal. Sci. Technol., 2015, 5, 2300 CAS.
  38. M. A. Aramendía, V. Boráu, I. M. García, C. Jiménez, F. Lafont, A. Marinas, J. M. Marinas and F. J. Urbano, J. Mol. Catal. A: Chem., 2002, 184, 237 CrossRef.
  39. G. Yuan and M. A. Keane, Appl. Catal., B, 2004, 52, 301 CrossRef CAS PubMed.
  40. Z. M. de Pedro, E. Diaz, A. F. Mohedano, J. A. Casas and J. J. Rodriguez, Appl. Catal., B, 2011, 103, 128 CrossRef CAS PubMed.
  41. G. Yuan and M. A. Keane, Chem. Eng. Sci., 2003, 58, 257 CrossRef CAS.
  42. S. Gómez-Quero, F. Cárdenas-Lizana and M. A. Keane, J. Catal., 2013, 303, 41 CrossRef PubMed.
  43. Q. Liu, Z. M. Cui, Z. Ma, S. W. Bian and W. G. Song, J. Phys. Chem. C, 2008, 112, 1199 CAS.
  44. A. Drelinkiewicz, W. Stanuch, A. Knapik, A. Ghanem, R. Kosydar, A. Bukowska and W. Bukowski, J. Mol. Catal. A: Chem., 2009, 300, 8 CrossRef CAS PubMed.
  45. H. Chen, P. Zhang, W. H. Tan, F. Jiang and R. Tang, RSC Adv., 2014, 4, 38743 RSC.
  46. S. Ordóñez, E. Díaz, R. F. Bueres, E. Asedegbega-Nieto and H. Sastre, J. Catal., 2010, 272, 158 CrossRef PubMed.
  47. H. Chen, Z. Y. Xu, H. Q. Wan, J. Z. Zheng, D. Q. Yin and S. R. Zheng, Appl. Catal., B, 2010, 96, 307 CrossRef CAS PubMed.
  48. J. Zhou, K. Wu, W. J. Wang, Y. X. Han, Z. Y. Xu, H. Q. Wan, S. R. Zheng and D. Q. Zhu, Appl. Catal., B, 2015, 162, 85 CrossRef CAS PubMed.
  49. J. Zhou, K. Wu, W. J. Wang, Z. Y. Xu, H. Q. Wan and S. R. Zheng, Appl. Catal., A, 2014, 470, 336 CrossRef CAS PubMed.
  50. M. Aramendía, V. Boráu, I. García, C. Jiménez, F. Lafont, A. Marinas, J. Marinas and F. Urbano, J. Catal., 1999, 187, 392 CrossRef.
  51. E. Díaz, L. Faba and S. Ordóñez, Appl. Catal., B, 2011, 104, 415 CrossRef PubMed.
  52. G. Yuan and M. A. Keane, Ind. Eng. Chem. Res., 2007, 46, 705 CrossRef CAS.
  53. A. Pintar, J. Batista, J. Levec and T. Kajiuchi, Appl. Catal., B, 1996, 11, 81 CrossRef CAS.
  54. K. Wu, X. J. Qian, L. Y. Chen, Z. Y. Xu, S. R. Zheng and D. Q. Zhu, RSC Adv., 2015, 5, 18702 RSC.
  55. I. Witońska, A. Królak and S. Karski, J. Mol. Catal. A: Chem., 2010, 331, 21 CrossRef PubMed.

Footnote

Electronic supplementary information (ESI) available. See DOI: 10.1039/c5ra07913f

This journal is © The Royal Society of Chemistry 2015