DOI:
10.1039/C4RA14369H
(Paper)
RSC Adv., 2015,
5, 51852-51867
Oxidovanadium(V) complexes of aroylhydrazones incorporating heterocycles: synthesis, characterization and study of DNA binding, photo-induced DNA cleavage and cytotoxic activities†
Received
12th November 2014
, Accepted 2nd June 2015
First published on 2nd June 2015
Abstract
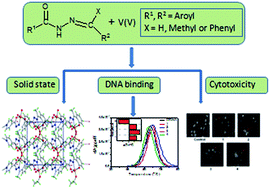
Four neutral oxidovanadium(V) complexes VO2L1 (1), VO2L2 (2), VOL3(OEt) (3) and VOL4(OEt)EtOH (4) [where HL1 = 2-thiophenoylhydrazone of 2-acetylpyridine, HL2 = 2-amino benzoylhydrazone of 2-benzoyl pyridine, H2L3 = isonicotinoylhydrazone of 2-hydroxy acetophenone, H2L4 = 2-furoylhydrazone of 2-hydroxy-1-napthaldehyde] with a hydrazone scaffold containing either furan, thiophene and pyridine residues have been synthesised. All complexes were thoroughly characterized by various spectroscopic (IR, UV-Vis, NMR and ESI-MS) and single crystal X-ray diffraction techniques. Crystallography establishes five-coordinate geometries, distorted toward square pyramidal for each of 1 and 2, based on a tridentate-O,N,N coordinating anion and two oxido-O atoms. The dianion in 3 is tetradentate, coordinating one V atom as for 1 and 2, and bridging another via the pyridyl-N atom, and the N2O4 octahedral coordination geometry is completed by oxido- and ethanolate-O atoms. The result of the V–N bridging is a helical coordination polymer. An NO5 octahedral geometry is found in 4 defined by a tridentate-O,N,O anion, as well as oxido-, ethanolate- and ethanol-O atoms. Biological studies reveal that 1–4 have DNA binding propensity and show these to interact with CT-DNA through the minor groove binding mode, with binding constants ranging from 103 to 105 M−1. All complexes show good photo-induced cleavage of pUC19 supercoiled plasmid DNA with 3 showing the highest photo-induced DNA cleavage activity of ∼65%. Additionally, 1–4 are cytotoxic against the human cervical cancer cell line (HeLa) with IC50 values ranging from 10 to 20 μM.
1. Introduction
Metal complexes bearing a heterocyclic moiety open a new era of pharmaceutical research since their presence can moderate physicochemical properties as well as enhance the medicinal properties.1–4 Isoxazoles, pyrroles, and pyrazoles are well-known examples of heteroaromatic organic compounds associated with diverse biological properties. Hence, it is not surprising that there are several reports in the literature where metal complexes have had their physicochemical and pharmacological properties influenced by the presence of biologically active heterocycles containing nitrogen.5–7 In this context, thiophene,8 furan,9 and pyridine10 moieties are especially regarded as desirable, due to their widespread use as a scaffold in medicinal chemistry.
Metal coordination is one of the most efficient strategies in the design of repository, slow-release or long-acting drugs.11 It was the discovery of cisplatin that gave momentum to metal-based drug research.12 Despite its tremendous success as an anti-cancer drug, its use is restricted due to serious side-effects, general toxicity, and acquired drug resistance.13–16 Therefore, considerable effort is being made to synthesise new metal-based drugs that effectively and specifically target cancer cells while minimising toxic side effects. Among transition metals, vanadium complexes have attracted significant attention owing to their diversified applications as models for the biological functions of vanadium,17–20 such as haloperoxidation,21 phosphorylation,22 insulin mimicking,23–26 nitrogen fixation,27 tumour growth inhibition and prophylaxis against carcinogenesis.28 These complexes have also numerous applications in DNA binding, cleavage and have shown the ability to act as anti-proliferative agents.29–32
Hydrazones, –NH–N
CRR′ (R and R′ = H, alkyl, aryl), are versatile ligands and have applications in the fields of analytical33 and medicinal chemistry.34 Hydrazone moieties are important pharmacophoric cores of several anti-cancer, anti-inflammatory, anti-nociceptive and anti-platelet drugs.35 Moreover, the electronic properties of hydrazone complexes are also important in the design of complexes with better DNA-binding and cleavage characteristics.36 Hydrazones in combination with heterocycles display a broad range of biological activity.37–39 Examples of hydrazide and hydrazone derivatives containing heterocycles demonstrating medicinal properties are presented in Chart 1.40–44 There are several reports in the literature on metal complexes having hydrazone ligands where a heterocyclic moiety enhances the pharmacological activity of these complexes.45 However, to date, analogous vanadium complexes, and especially the study of their pharmacological activity, is still scarce and needs to be explored.46
 |
| Chart 1 Chemical structures of some hydrazide and hydrazone derivatives demonstrating pharmacological activities. | |
Considering the interesting pharmacological properties of ligand systems containing heterocycles and as a part of our studies on design and synthesis of novel vanadium complexes with potential pharmaceutical activities,32,47 we now focus our attention on the synthesis of some new oxidovanadium complexes with a hydrazone scaffold containing either furan, thiophene and pyridine residues. These show interesting DNA binding, photo-induced DNA cleavage and cytotoxicity profiles. The interaction of the complexes with calf-thymus DNA (CT-DNA) was also investigated using UV-Vis absorption titration, thermal denaturation, circular dichroism and fluorometric competitive binding studies. Their photo-cleavage reactions with pUC19 supercoiled plasmid DNA were investigated by gel electrophoresis. In addition, the cytotoxicity of the complexes against the cervical cancer cell line (HeLa) was assessed by the MTT assay.
2. Experimental
2.1 Materials and instrumentation
All chemicals were purchased from commercial sources and used without further purification. The VO(acac)2 complex was prepared as described in the literature.48 MTT (3-[4,5-Dimethylthiazol-2-yl]-2,5-diphenyltetrazolium) and DAPI (4′,6-diamidino-2-phenylindole dihydrochloride) were purchased from Sigma Aldrich (USA). Minimal essential medium (MEM) was purchased from Gibco, India. Reagent grade solvents were dried and distilled prior to use. The supercoiled (SC) pUC19 DNA was purified from E. coli cells with the aid of GeneJET Plasmid Isolation Kit (Thermo Scientific, USA). Biochemistry grade calf thymus (CT) DNA was purchased from SRL (India). Molecular biology grade agarose was purchased from Sigma Aldrich (USA). Methyl green and ethidium bromide were procured from HiMedia Laboratories. Elemental analyses were performed on a Vario ELcube CHNS Elemental analyser and IR spectra were recorded on a Perkin-Elmer Spectrum RXI spectrophotometer. 1H and 13C NMR spectra were recorded with a Bruker Ultrashield 400 MHz spectrometer using SiMe4 as the internal standard. Electronic spectra were recorded on a Perkin-Elmer Lamda25 spectrophotometer. Cyclic voltammograms were recorded in CH2Cl2 solutions, containing 0.1 (M) TEAP (tetraethyl ammonium perchlorate) as supporting electrolyte, using a CH1120A potentiostat, with glassy carbon working electrode, Pt wire as counter electrode and Ag, AgCl/saturated KCl as reference electrode.
2.2 Synthesis of the ligands
Schiff base ligands, HL1 and H2L3–4, were prepared by condensation of acid hydrazides (10 mmol) and the corresponding carbonyl compound (10 mmol) in stirring ethanol (15 mL) for 3 h following a standard procedure.47 HL2 was prepared by condensation of 2-amino benzoylhydrazide with 2-benzoyl pyridine in refluxing methanol for 5 h. The resulting white/yellow compound was filtered, washed with ethanol and dried over fused CaCl2. The synthesised ligands are shown in Scheme 1.
 |
| Scheme 1 Schematic diagram of ligand molecules and composition of the complexes. | |
2.2.1 HL1. Yield: 74%. Anal. calc. for C12H11N3OS: C, 58.76; H, 4.52; N, 17.13; S, 13.07. Found: C, 58.79; H, 4.48; N, 17.11; S, 13.05%. FTIR (KBR, ν/cm−1): 3164 (N–H), 1647 (C
O), 1572 (C
N). 1H NMR (400 MHz, DMSO-d6, ppm): δ 11.09 (s, 1H, NH), 8.61–7.20 (m, 7H, aromatic), 2.45 (s, 3H, CH3). 13C NMR (100 MHz, DMSO-d6, ppm): δ 162.55, 155.32, 150.79, 149.12, 137.10, 135.59, 133.33, 127.16, 125.23, 124.45, 121.25, 12.88.
2.2.2 HL2. Yield: 78%. Anal. calc. for C19H16N4O: C, 72.14; H, 5.10; N, 17.71. Found: C, 72.15; H, 5.11; N, 17.69%. FTIR (KBR, ν/cm−1): 3472 (NH2)sym, 3354 (NH2)asym, 3048 (N–H), 1654 (C
O), 1576 (C
N). 1H NMR (400 MHz, DMSO-d6, ppm): δ 14.50 (s, 1H, NH), 8.91–6.63 (m, 13H, aromatic), 6.56 (s, 2H, NH2). 13C NMR (100 MHz, DMSO-d6, ppm): δ 157.07, 155.75, 153.94, 153.81, 152.27, 143.60, 142.78, 141.95, 138.00, 134.30, 134.12, 134.05, 133.64, 132.51, 131.38, 130.09, 122.24, 120.67, 117.91.
2.2.3 H2L3. Yield: 69%. Anal. calc. for C14H13N3O2: C, 65.87; H, 5.13; N, 16.46. Found: C, 65.88; H, 5.11; N, 16.50%. FTIR (KBR, ν/cm−1): 3368 (O–H), 3151 (N–H), 1678 (C
O), 1607 (C
N). 1H NMR (400 MHz, DMSO-d6, ppm): δ 13.32 (s, 1H, OH), 11.72 (s, 1H, NH), 8.20–6.89 (m, 8H, aromatic), 2.42 (s, 3H, CH3). 13C NMR (100 MHz, DMSO-d6, ppm): δ 163.40, 160.01, 159.21, 150.56, 140.84, 132.05, 129.19, 122.84, 122.63, 122.43, 119.68, 119.10, 117.82, 14.78.
2.2.4 H2L4. Yield: 71%. Anal. calc. for C16H12N2O3: C, 68.57; H, 4.32; N, 9.99. Found: C, 68.59; H, 4.34; N, 9.96%. FTIR (KBR, ν/cm−1): 3445 (O–H), 3172 (N–H), 1640 (C
O), 1603 (C
N). 1H NMR (400 MHz, DMSO-d6, ppm): δ 12.72 (s, 1H, OH), 12.26 (s, 1H, NH), 9.51 (s, 1H, CH), 8.21–6.71 (m, 9H, aromatic). 13C NMR (100 MHz, DMSO-d6, ppm): δ 158.43, 154.24, 147.54, 146.70, 146.50, 133.20, 132.10, 129.37, 128.26, 128.16, 123.96, 121.04, 119.29, 115.95, 112.75, 109.00.
2.3 Synthesis of complexes 1–4
2.3.1 VO2L1 (1). To a hot solution of HL1 (1 mmol) in methanol (30 mL), VO(acac)2 (1 mmol) in DMF (5 mL) was added, the colour changed instantly from colourless to green-brown. After 6 h of reflux, the solution was cooled, filtered and kept for crystallisation. Slow evaporation of the filtrate over 4 days produced orange crystals. Yield: 63%. Anal. calc. for C12H10N3O3SV: C, 44.05; H, 3.08; N, 12.84; S, 9.80. Found: C, 44.06; H, 3.05; N, 12.83; S, 9.81%. FTIR (KBR, ν/cm−1): 1600 (C
N), 1255 (C–O)enolic, 1036 (N–N), 946 (V
O). UV-Vis in DMF [λ/nm (ε/M−1 cm−1)]: 399 (14
121), 277 (8371). 1H NMR (400 MHz, DMSO-d6, ppm): δ 8.80–7.21 (m, 7H, aromatic), 2.71 (s, 3H, CH3). 13C NMR (100 MHz, DMSO-d6, ppm): δ 171.54, 165.30, 159.69, 152.14, 148.11, 145.19, 144.33, 132.16, 127.23, 126.40, 124.22, 13.48. 51V NMR (DMSO-d6, ppm): δ −507.
2.3.2 VO2L2 (2). To a hot solution of HL2 (1 mmol) in ethanol (30 mL), VO(acac)2 (1 mmol) was added, the colour changed instantly from pale yellow to orange. After 5 h of reflux, the solution was cooled, filtered off and kept for crystallisation. Slow evaporation of the filtrate over 4 days produced dark red crystals. Yield: 68%. Anal. calc. for C19H15N4O3V: C, 57.30; H, 3.80; N, 14.07. Found: C, 57.31; H, 3.84; N, 14.08%. FTIR (KBR, ν/cm−1): 3393 (NH2)sym, 3284 (NH2)asym, 1594 (C
N), 1255 (C–O)enolic, 1028 (N–N), 943 (V
O). UV-Vis in DMF [λ/nm (ε/M−1 cm−1)]: 460 (8945), 298 (11
114), 258 (12
770). 1H NMR (400 MHz, DMSO-d6, ppm): δ 8.93–6.53 (m, 13H, aromatic), 6.73 (s, 2H, NH2). 13C NMR (100 MHz, DMSO-d6, ppm): δ 178.68, 158.22, 155.08, 154.13, 150.71, 143.56, 134.04, 131.61, 130.99, 129.96, 129.32, 129.21, 127.12, 116.69, 115.45, 110.75. 51V NMR (DMSO-d6, ppm): δ −512.
2.3.3 VOL3(OEt) (3). To the (1 mmol) sample of ligand H2L3 in ethanol (20 mL), VO(acac)2 (1 mmol) was added under refluxing conditions. After 3 h, the resulting deep-brown solution was filtered and slow evaporation of the filtrate over 4–5 days produced black crystals. The crystals were filtered and washed with ethanol. Yield: 64%. Anal. calc. for C16H16N3O4V: C, 52.61; H, 4.42; N, 11.50. Found: C, 52.63; H, 4.44; N, 11.48%. FTIR (KBR, ν/cm−1): 1601 (C
N), 1239 (C–O)enolic, 1037 (N–N), 964 (V
O). UV-Vis in DMF [λ/nm (ε/M−1 cm−1)]: 399 (7783), 326 (18
601), 267 (22
547). 1H NMR (400 MHz, DMSO-d6, ppm): δ 8.75–6.92 (m, 8H, aromatic), 5.59 (m, 2H, CH2(OEt)), 1.54 (t, 3H, CH3(OEt)), 2.93 (s, 3H, CH3). 13C NMR (100 MHz, DMSO-d6, ppm): δ 167.52, 164.69, 164.32, 161.80, 150.22, 140.15, 133.79, 130.69, 123.00, 122.51, 120.72, 117.00, 82.18, 56.50, 18.98, 17.32. 51V NMR (DMSO-d6, ppm): δ −541.
2.3.4 VOL4(OEt)EtOH (4). Complex 4 was prepared and crystallised similarly to 3, replacing H2L3 by H2L4 to yield (red) crystals. Yield: 69%. Anal. calc. for C20H21N2O6V: C, 55.05; H, 4.85; N, 6.42. Found: C, 55.02; H, 4.86; N, 6.38%. FTIR (KBR, ν/cm−1): 3567 (O–H), 1612 (C
N), 1238 (C–O)enolic, 1052 (N–N), 998 (V
O). UV-Vis in DMF [λ/nm (ε/M−1 cm−1)]: 436 (7621), 326 (8168), 284 (11
506), 260 (13
128). 1H NMR (400 MHz, DMSO-d6, ppm): δ 9.61 (s, 1H, CH), 8.40–6.65 (m, 9H, aromatic), 5.67 (m, 2H, CH2(OEt)), 3.44 (q, 2H, CH2(EtOH)), 1.55 (t, 3H, CH3(OEt)), 1.06 (t, 3H, CH3(EtOH)). 13C NMR (100 MHz, DMSO-d6, ppm): δ 164.45, 163.24, 148.60, 146.19, 145.88, 135.40, 132.74, 129.24, 128.70, 128.61, 124.43, 121.75, 119.55, 115.27, 112.53, 111.50, 74.38, 56.61, 48.94, 18.57. 51V NMR (DMSO-d6, ppm): δ −537.
2.4 X-ray crystallography
Intensity data for 1, 2 and 4 were collected on a Bruker APEXII diffractometer equipped with a CCD area detector and graphite-monochromated Mo Kα radiation (λ = 0.71069 Å), and those for 3 were measured on an Oxford Diffraction Xcalibur Ruby Gemini system employing graphite-monochromated Cu Kα radiation (λ = 1.54178 Å). Data reduction and empirical absorption correction, based on the multi-scan method, was by standard methods.49,50 The structures were solved by direct methods using SHELXS97 (ref. 51) through the WinGX Interface52 and refinement (anisotropic displacement parameters, C-bound hydrogen atoms in idealised positions and a weighting scheme of the form w = 1/[σ2(Fo2) + aP2 + bP] where P = (Fo2 + 2Fc2)/3) of each structure was carried out on F2 by full-matrix least-squares procedures51). The amine-H atoms in 2 were located from a difference Fourier map and refined with the distance restraint N–H = 0.88 ± 0.01 Å. The thienyl ring in 1 was found to be disordered over two coplanar dispositions of opposite orientation: the major component refined to a site occupancy factor of 0.836(2). For 1, the maximum and minimum residual electron density peaks of 1.03 and 0.41 e Å−3, respectively, were located 0.78 and 0.51 Å, respectively, from the V atom. The absolute structure of 3 was determined on the basis of 539 Friedel pairs included in the data set; the value of the Flack parameter53 was 0.012(6). Crystal data and refinement details are given in Table 1. The molecular structures shown in Fig. 1–4, were drawn with 70% (35% for 2) displacement ellipsoids.52 The overlay diagrams shown in the ESI† were drawn with QMol,54 and the crystal packing diagrams with DIAMOND.55 Data interpretation was accomplished using PLATON.56
Table 1 Crystallographic and refinement details for 1–4
Compound |
1 |
2 |
3 |
4 |
Formula |
C12H10N3O3SV |
C19H15N4O3V |
C16H16N3O4V |
C20H21N2O6V |
Formula weight |
327.23 |
398.29 |
365.26 |
436.33 |
Crystal colour/habit |
Orange/prism |
Dark-red/prism |
Black/prism |
Red/needle |
Crystal dimensions/mm |
0.11 × 0.15 × 0.20 |
0.14 × 0.17 × 0.34 |
0.06 × 0.11 × 0.25 |
0.03 × 0.07 × 0.40 |
Temperature/K |
100 |
100 |
293 |
293 |
Crystal system |
Monoclinic |
Triclinic |
Orthorhombic |
Monoclinic |
Space group |
P21/c |
P![[1 with combining macron]](https://www.rsc.org/images/entities/char_0031_0304.gif) |
Pna21 |
C2/c |
a/Å |
7.1876(3) |
7.2745(2) |
12.4265(2) |
41.893(4) |
b/Å |
10.6882(4) |
14.3309(3) |
10.8273(2) |
8.7854(10) |
c/Å |
16.6167(6) |
16.7694(4) |
12.0750(2) |
21.729(2) |
α/° |
90 |
87.92(10) |
90 |
90 |
β/° |
92.567(2) |
80.07(10) |
90 |
98.017(5) |
γ/° |
90 |
83.41(10) |
90 |
90 |
V/Å−3 |
1275.26(9) |
1710.41(7) |
1624.64(5) |
7919.2(14) |
Z |
4 |
4 |
4 |
16 |
Dc/g cm−3 |
1.704 |
1.547 |
1.493 |
1.464 |
F(000) |
664 |
816 |
752 |
3616 |
μ/mm−1 |
0.951 |
0.609 |
5.339 |
0.541 |
Measured data |
43 228 |
29 305 |
4415 |
114 454 |
θ range/° |
2.3–27.5 |
1.9–27.5 |
5.4–77.5 |
1.9–25.6 |
Unique data |
2933 |
7826 |
2329 |
7421 |
Observed data [I ≥ 2.0σ(I)] |
2760 |
6698 |
2119 |
5085 |
R, obs. data; all data |
0.028; 0.030 |
0.033; 0.040 |
0.030; 0.033 |
0.045; 0.80 |
a, b in weighting scheme |
0.035, 1.109 |
0.046, 0.865 |
0.061, 0 |
0.052, 15.124 |
Rw, obs. data; all data |
0.075; 0.076 |
0.086; 0.091 |
0.081; 0.082 |
0.106, 0.130 |
Residual electron density peaks/e Å3 |
1.03, −0.41 |
0.39, −0.42 |
0.22, −0.22 |
0.65, −0.39 |
 |
| Fig. 1 The molecular structure of 1, showing the atom-labelling scheme and 70% displacement ellipsoids. Only the major component of the disordered thienyl ring is shown. | |
 |
| Fig. 2 The molecular structure of one of the two independent molecules comprising the asymmetric unit of 2, showing atom-labelling scheme and 70% displacement ellipsoids. The second independent molecule has an analogous structure as illustrated in Fig. S2.† | |
 |
| Fig. 3 (a) The asymmetric unit in 3, showing the atom-labelling scheme and 35% displacement ellipsoids. The coordination geometry of the vanadium atom has been extended to indicate the V–N1 bonds that generate the helical polymer along the c-axis, shown in (b). | |
 |
| Fig. 4 The molecular structure of one of the two independent molecules comprising the asymmetric unit of 4, showing atom-labelling scheme and 70% displacement ellipsoids. The second independent molecule has an analogous structure as illustrated in Fig. S3.† | |
2.5 DNA binding experiments
2.5.1 Absorption spectral studies. Binding of the oxidovanadium(V) complexes to calf thymus DNA (CT-DNA) was carried out as previously described.47 The UV-Vis titration experiments were performed using a fixed concentration of metal complex (25 μM) but variable CT-DNA concentrations ranging from 0 to 70 μM in 10 mM Tris–HCl buffer (pH 8.0) containing 1% DMF. Binding of ligands to CT-DNA was also studied. For this, a fixed concentration of ligand [25 μM in 10 mM Tris–HCl buffer (pH 8.0) containing 1% DMF] was titrated with variable DNA concentration ranging from 0 to 350 μM.
2.5.2 Thermal denaturation studies. Thermal denaturation studies of CT-DNA (160 μM) in the absence and presence of complexes (150 μM) were carried out by monitoring the absorbance at 260 nm in the temperature range of 30–90 °C with a ramp rate of 0.5 °C min−1 in 10 mM Tris–HCl buffer (pH 8.0) containing 1% DMF. The experiments were carried out using a Chirascan CD spectropolarimeter (Applied Photophysics, UK) in absorbance mode equipped with a peltier temperature controller. The melting temperature (Tm) was determined from the derivative plot (dA260/dT vs. T) of the melting profile.57
2.5.3 Circular dichroism studies. Circular Dichroism (CD) spectroscopy was studied using Chirascan CD spectropolarimeter (Applied Photophysics, UK) at 25 °C. CD spectra of CT-DNA (100 μM) in the absence and presence of complexes (100 μM) were obtained in the wavelength range of 240–400 nm in 10 mM Tris–HCl buffer (pH 8.0) containing 1% DMF using quartz cell with 10 mm path length.47
2.5.4 Competitive DNA binding by fluorescence measurements.
2.5.4.1 4′,6-diamidino-2-phenylindole (DAPI) displacement experiment. The DNA binding probe, 4′,6-diamidino-2-phenylindole (DAPI), binds to the minor groove of the DNA.58 The competitive binding of the complexes 1–4 to the minor groove of CT-DNA was studied by measuring the fluorescence of DAPI (2 μM) bound CT-DNA (50 μM) with increasing concentration of the complexes. The fluorescence intensities of DAPI at 455 nm (excitation 358 nm) with an increasing amount of the complex concentration (0–90 μM) was measured with the aid of Fluoromax 4P spectrofluorimeter (Horiba Jobin Mayer, USA).
2.5.4.2 Methyl green (MG) displacement experiment. The DNA binding probe, methyl green (MG), binds to the major groove of the DNA.59 The competitive binding of the complex 1–4 to the major groove of CT-DNA was studied by measuring the fluorescence of MG (2 μM) bound CT-DNA (50 μM) with increasing concentration of the complexes. The fluorescence intensities of MG at 672 nm (excitation 633 nm) with an increasing amount of the complex concentration (0–90 μM) was measured with the aid of the same spectrofluorimeter as used above.
2.5.4.3 Ethidium bromide (EB) displacement experiment. The DNA binding probe, ethidium bromide (EB), binds to the DNA by intercalation.60 The competitive binding of the complex 1–4 by intercalation to CT-DNA was studied by measuring the fluorescence of EB (2 μM) bound CT-DNA (50 μM) with increasing concentration of the complexes. The fluorescence intensities of EB at 597 nm (excitation 510 nm) with an increasing amount of the complex concentration (0–90 μM) was measured with the aid of the same spectrofluorimeter as used above.
2.6 DNA cleavage experiments
For DNA cleavage experiments, 300 ng supercoiled (SC) pUC19 DNA was used and all experiments were carried out in 50 mM Tris–HCl buffer (pH 8.0) containing 1% DMF and 10 mM phosphate buffer (pH 7.8) containing 1% DMF.
2.6.1 Chemical-induced DNA cleavage. For chemical nuclease studies, the reactions were performed in the dark using hydrogen peroxide (0.5 mM) as the oxidising agent in the absence and presence of complexes (1–500 μM). The solutions were incubated at 37 °C for 3 h and analysed for DNA cleaved products by agarose gel electrophoresis.
2.6.2 Photo-induced DNA cleavage. The photo-induced DNA cleavage activity was done as described previously.47 The photolytic DNA cleavage experiments were carried out on supercoiled (SC) pUC19 DNA (300 ng) with complexes (1–500 μM) in 50 mM Tris–HCl buffer (pH 8.0) containing 1% DMF and in 10 mM phosphate buffer (pH 7.8) containing 1% DMF. The extent of DNA cleavage was measured from the intensities of the bands using the UVP gel documentation system. The observed error in measuring the band intensities ranged between 3–6%. The mechanistic studies were performed using four different additives: two are singlet oxygen quenchers (sodium azide and L-histidine) and other two are hydroxyl radical quenchers (KI and D-mannitol) prior to the addition of the complex. The concentration of each additive was 0.5 mM.
2.7 Cytotoxicity studies
2.7.1 Cell culture. Human cervical cells HeLa were obtained from National Centre of Cell Science (NCCS), Pune, India, and were maintained in minimal essential medium supplemented with 10% fetal bovine serum, penicillin–streptomycin solution and incubated at 37 °C in 5% CO2 and 95% humidified incubator. The complexes were dissolved in DMSO at a concentration of 100 mM as stock solution, and diluted in culture medium at concentrations of 12.5, 25.0, 50.0 and 100.0 μM as working solutions. To avoid DMSO toxicity, the concentration of DMSO was less than 0.1% (v/v) in all experiments.
2.7.2 MTT assay. HeLa cells were harvested from maintenance cultures in logarithmic phase, after counting in a hemocytometer using trypan blue solution. The cell concentration was adjusted to 5 × 10⁴ cells per ml and the cells were plated in 96 well flat bottom culture plates and incubated for 72 h with various concentrations of the test compounds. The effect of the drugs on the cancer cell viability was studied using MTT dye reduction assay by measuring the optical density at 595 nm using micro-plate reader spectrophotometer (Perkin-Elmer 2030).61
2.7.3 Nuclear staining. Nuclear staining using DAPI stain was performed according to the method previously described.62 Briefly, HeLa cells either treated or untreated with test compounds were smeared on a clean glass slide, cells were fixed with 3.7% formaldehyde for 15 min, permeabilised with 0.1% Triton X-100 and stained with 1 μg ml−1 DAPI for 5 min at 37 °C. The cells were then washed with PBS and examined by fluorescence microscopy (Olympus IX 71) to ascertain any condensation or fragmentation of the nuclei indicating cells undergoing apoptosis.
3. Results and discussion
3.1 Synthesis
Four oxidovanadium(V) complexes (1–4) have been prepared using different aroylhydrazones as ligands (Scheme 1), i.e. with varying heterocycle-derivatives in their hydrazone moieties. Reactions of the selected aroylhydrazones with VO(acac)2 proceed in refluxing ethanol/DMF + MeOH to afford crystalline products in good yields.
Complexes (1–4) were completely soluble in DMF, DMSO and partially soluble in CH2Cl2 and H2O. All the complexes were stable in both solid and solution phases. The solution phase stability over the period of the biological assays, i.e. 72 h, of the complexes was confirmed by electronic absorption and NMR spectral studies (Fig. S1†).
3.2 Spectral characteristics
The spectral (IR, UV-Vis and NMR) data of HL1–2, H2L3–4 and their corresponding oxidovanadium(V) complexes (1–4) are given in the Experimental Section.
3.2.1 IR spectroscopy. The disappearance of characteristic bands due –NH and –C
O in the respective ligand spectra, and the appearance of new bands in the range 1255–1238 cm−1 in the spectra of the resulting complexes indicate the enolisation of these two groups to form a –N
C–O bond sequence. The strong and sharp peak displayed by the complexes in the range 1612–1594 cm−1 is likely to be associated with the –C
N–N
C– moiety.63,64 The presence of bands at 946 and 943 cm−1 for 1 and 2, respectively, is assigned to V
O stretching,47,65 which indicates the presence of dioxido group whereas a sharp band in the range 998–964 cm−1 is assigned to V
O stretching of a oxidoalkoxido vanadium(V) complex, as for 3 and 4.63a
3.2.2 Electronic spectra. The electronic spectra of 1–4 were recorded in DMF (1.48 × 10⁻⁴ M) and are similar. A representative spectrum of 3 is shown in Fig. 5. Strong absorptions in the range 460–399 nm are assignable to the ligand-to-metal charge transfer transitions whereas the bands in the higher energy region (326–258 nm) are likely to be due to ligand centred transitions.63a,b
 |
| Fig. 5 Electronic absorption spectrum of 3 (1.48 × 10⁻⁴ M) in DMF. | |
3.2.3 NMR spectra. The 1H and 13C NMR data of ligands and their complexes were recorded in DMSO-d6. The spectra of HL1–2 and H2L3–4 exhibit resonances due to –NH in the range 14.50–11.09 ppm. These disappear in the spectra of the complexes confirming enolisation of the ligands. For 3 and 4, the absence of signals in the range 13.32–12.72 ppm indicates deprotonation of the –OH groups and its coordination to the vanadium centre after metallation. Complexes 1 and 3 each displays a singlet in the range δ = 2.93–2.71 ppm due to –CH3 protons. Complexes 3 and 4 exhibit separate resonances corresponding to bound ethanolate at 5.59 and 5.67 ppm due to –CH2 and 1.54 and 1.55 ppm due to –CH3, respectively.63b,66,67 In addition, 4, exhibits a quartet at 3.44 ppm due to –CH2 and a triplet at 1.06 ppm due to –CH3, respectively which indicates the presence of the coordinated ethanol molecule. Finally, 4 displays a resonance at δ = 9.61 ppm ascribed to –CH.The 51V NMR spectra of 1–4 each displays a singlet in the range δ = −541 to −507 ppm. These chemical shifts are usual for complexes containing oxidovanadium(V) species.68
3.3. Electrochemical properties
The cyclic voltammogram of 1–4 were taken in CH2Cl2 solution (0.1 M TEAP) and the redox potentials are summarized in Table 2. The dioxidovanadium(V) complexes (1 and 2) are found to display two quasi reversible reduction wave at E1/2 values within the potential window −0.87 to −0.70 V and −1.11 to −1.02 V, which are assigned to the V(V)/V(IV) and V(IV)/V(III) redox pair of the metal respectively.69 Fig. 6a depicts a representative voltammogram of 2. Similarly the monooxido vanadium(V) complexes (3 and 4) display a well-defined quasi reversible cyclic voltammetric response due to the VO3+–VO2+ couple63b,70 at the range E1/2 = 0.40–0.36 V (ΔEP = 164–150 mV), A representative voltammogram of 4 is displayed in Fig. 6b.
Table 2 Cyclic voltammetric resultsa for 1–4 at 298 K
Complex |
E1/2 (ΔEP)/V (mV) |
In CH2Cl2 at a scan rate of 100 mV s−1. E1/2 = (Epa + Epc)/2, where Epa and Epc are anodic and cathodic peak potentials vs. Ag/AgCl, respectively. ΔEP = Epa − Epc. |
VO2L1 (1) |
−0.87 (240), −1.11 (100) |
VO2L2 (2) |
−0.70 (300), −1.02 (130) |
VOL3(OEt) (3) |
0.36 (164) |
VOL4(OEt)EtOH (4) |
0.40 (150) |
 |
| Fig. 6 Cyclic voltammogram of complex 2 (a) and 4 (b) in CH2Cl2 (0.1 M TEAP); scan rate 100 mV s−1, and potentials recorded vs. Ag/AgCl. | |
3.4 Description of the X-ray crystal structures
3.4.2 Molecular structures. In 1, Fig. 1, the penta-coordinated vanadium atom is bound by a tridentate uninegative anion, coordinating via enolate-O, azo-N and pyridyl-N atoms, and two oxido-O atoms. Confirmation that the multidentate ligand is functioning as a 2-acetylpyridine 2-thiophenoylhydrazone is found in the magnitudes of the two C
N bond lengths, Table 3; a similar mode of coordination for this specific anion toward vanadium was found in a seven-coordinated species where one oxido-O atom is replaced by peroxo- and methanol-O atoms.71 The resulting N2O3 donor set in 1 is distorted toward square pyramidal based on a τ value of 0.30 which compares to ideal values of 0.0 and 1.0 for square pyramidal and trigonal bipyramidal geometries, respectively.72 Each five-membered chelate ring is planar with r.m.s. deviations of 0.021 and 0.023 Å for the (V1, O1, N2, N3, C7) and (V1, N1, N2, C1, C6) rings, respectively, and the dihedral angle between them is 1.91(6)°. The dihedral angle between the terminal pyridyl and thienyl (major component) rings is 4.96(19)° suggesting that the entire ligand is approximately planar. The overall molecular structure in 1 matches closely to the most relevant structure available for comparison, namely the furanyl derivative, which exhibits crystallographically imposed mirror symmetry with the tridentate ligand lying on the plane.73The molecular structures of the two independent molecules comprising the asymmetric unit of 2 are shown in Fig. 2 and S2a,† and these are similar to that just described for 1 except that the methyl and thienyl groups in 1 have been substituted by phenyl and anilinyl groups, respectively. The uninegative, tridentate ligand adopts a similar mode of coordination as just described for 1 in each molecule of 2. The independent molecules differ most notably in the relative orientations of the phenyl and anilinyl substituents as highlighted in the overlay diagram, Fig. S2b,† and quantified in the dihedral angles formed between the pyridyl and each of the phenyl and anilinyl rings of 54.39(8) and 23.36(8)°, respectively, for the first independent molecule in 2, and 47.77(7) and 6.18(8)° for the second molecule. From these data, the tridentate ligand in the second molecule adopts a more planar conformation cf. the first independent molecule. The five-membered chelate rings in each molecule are almost planar with the r.m.s. deviations for the (V1, O1, N2, N3, C7) and (V1, N1, N2, C1, C6) rings being 0.046 and 0.009 Å for the first molecule, respectively, and 0.044 and 0.028 Å for the second molecule, respectively. The values of τ calculated for the two independent molecules are 0.35 and 0.28, respectively, again indicating a distortion toward a square pyramidal geometry. Each molecule features an intramolecular N–H⋯N hydrogen bond which closes an S(6) loop.74 The analogous ligand where the phenyl group has been substituted for a methyl group has been characterized in two crystal structures, i.e. mononuclear cobalt75 and uranium76 complexes, each with a nearly planar conformation of the tridentate ligand.
An increase in coordination number at vanadium in 3, Fig. 3a, is evident owing to the formation of intermolecular V–N1(pyridyl) bonds. The vanadium atom is coordinated by the enolate-O1, phenoxide-O2 and azo-N2 atoms of the dinegative ligand, as well as oxido-O3, ethanolate-O4 and bridging pyridyl-N1 atoms; the dianion is therefore, tetradentate. The result of the V–N bridging is the formation of a supramolecular helical chain along the c-axis, Fig. 3b. The N2O4 donor set defines a distorted octahedral geometry with the twist angle between the trigonal faces defined by the O1, O4, N1 atoms and the O2, O3, N2 atoms being approximately 51°, cf. 60° for an ideal octahedron and 0° for an ideal trigonal prism. While the five-membered chelate ring is essentially planar, r.m.s. deviation = 0.033 Å, the six-membered chelate ring is best described as being based on a half-chair conformation with the vanadium atom lying 0.812(3) Å out of the plane defined by the remaining chelate atoms, i.e. O2, N2, C1, C6, C7, which have a r.m.s. deviation of 0.0787 Å from their least-squares plane. There are no literature precedents for crystal structures containing the ligand as found in 3.
The fourth structure, 4, is illustrated in Fig. 4 and S3a,† as the asymmetric unit comprises two independent complex molecules; for the second independent molecule, the ethanol molecule is statistically disordered over two positions (Fig. S3a†). The overlay diagram of the two independent molecules is shown in Fig. S3b.† The coordination geometry is based on an octahedral NO5 donor set defined by enolate-O1, azo-N2 and naphthyl-oxide-O2 atoms of the tridentate dinegative anion, as well as oxido-O4, ethanolate-O5 and ethanol-O6 atoms. The V
O4 bond lengths in 4 are the shortest across the series owing to the trans disposition of the oxido-O to the relatively weakly bound ethanol molecules. Each five-membered chelate ring is planar but the six-membered rings are best described as having half-chair conformations with the O2 atom lying 0.454(3) Å out of the plane defined by the remaining five atoms (r.m.s. deviation = 0.1037 Å); the equivalent values for the V2-molecule are 0.348(3) and 0.0826 Å, respectively. The dihedral angle between the chelate rings for the V1-containing molecule is 6.88(18)°, and this opens up to 10.06(12)° for the species with V2. Overall, the multidentate ligand exhibits a small twist as seen in the dihedral angles formed between the outermost ring of the naphthalyl system and furanyl ring of 13.90(19) (V1) and 10.42(18)° (V2). A search of the Cambridge Structural Database77 revealed 42 vanadium-containing structures with an NO5 donor set defined by the same donor atoms as for 4. In each structure there was a trans arrangement of oxido-O and ethanol-O atoms as well as between ethanolate-O and nitrogen donor atoms. The most closely related structure is one where the furanyl ring has been replaced by a 3-pyridyl ring and the N1-imine C atom carries a methyl group.78 In the latter, the tridentate ligand has a decidedly curved conformation with the dihedral angle between the terminal rings being 34.56(7)°.
3.4.3 Supramolecular features. In the absence of functional groups capable of conventional hydrogen bonding, the most significant intermolecular interactions operating in the structure of 1 are of the type π⋯π and C–H⋯O. The former connect molecules into centrosymmetric dimers via interactions involving the thienyl and pyridyl rings. These are connected into a three-dimensional architecture via pyridyl-C–H interacting with a bifurcated oxido-O3 atom. A view of the unit cell contents for 1 is given in Fig. S4† and full geometric details describing the aforementioned interactions are collected in the figure caption.The most prominent feature of the crystal packing in 2 is the formation of N–H⋯O hydrogen bonds between the amino-H and oxido-O atoms so that supramolecular chains aligned along [101] are formed comprising alternating V1- and V2-containing molecules, Fig. S5a.† These are linked by a network of C–H⋯O interactions involving anilinyl-, methyl-, phenyl- and pyridyl-H as donors and oxido-O as acceptors, see Fig. S5b† for geometric data.
In the crystal structure of 3, the coordination polymers are connected into a supramolecular layer in the ac-plane with the links being of the type C–H⋯π(chelate) ring with the latter comprising the (V, O1, N2, N3, C8) atoms of the five-membered ring, see Fig. S6a† for geometric data. Such C–H⋯π(chelate) ring interactions are relatively rare, or more likely not always recognised, but are increasingly attracting attention in the crystallographic literature.79–81 The layers stack along the b-axis in an …ABA… pattern with no specific interactions between them, see Fig. S6b.†
Finally, in the crystal packing of 4, each of the two independent molecules comprising the asymmetric unit self-associate via methanol-O–H⋯N1(imine) hydrogen bonds to form two-molecule aggregates and 10-membered {⋯HOVN2}2 supramolecular synthons, see Fig. S7a and b.† Within the dimeric aggregates there are also π⋯π interactions between the thienyl and inner ring of the naphthalyl group. The dimers stack into columns aligned along the b-axis, so that layers of alternating V1- and V2-containing molecules stack along the a-axis. In the layers comprising V2-containing molecules, naphthalyl-C–H⋯O(naphthalyl) interactions stabilise the architecture but there are no specific interactions between V1-containing dimers or between layers, Fig. S7c.†
3.5 DNA binding studies
3.5.1 Absorption spectroscopic studies. The binding propensity of 1–4 to CT-DNA was studied using different spectroscopic techniques. Complexes 1–4 show absorption bands in the regions 440–400 and 340–300 nm which are attributed to L–V(dπ) LMCT and intra-ligand transitions, respectively.63a UV-Vis titration experiments were carried out to determine the equilibrium binding constant (Kb) of the complexes to CT-DNA (Table 4 and Fig. 7). Upon addition of CT-DNA, the UV-Vis absorption bands in the region 340–300 nm showed a hypochromic shift for 1 whereas 2–4 exhibited hyperchromism (Fig. 7), indicating interaction between each complex and CT-DNA. The observed hypochromicity of complex 1, may be due to the interaction between the electronic states of the chromophores and the DNA bases. On the other hand, the observation of hyperchromism in the intra-ligand transition band near 300 nm for complexes 2–4 may be due to the electrostatic binding of the complex on the DNA surface which results in a distortion of coordination sphere which leads to an enhancement of the absorption intensity in the intra-ligand transition bands.5,82,83
Table 4 DNA binding parameters for 1–4
Complex |
Binding constant (Kb)a (M−1) |
ΔTmb (°C) |
DNA binding constants were determined by the UV-vis spectral method. Change in the melting temperature of CT-DNA. |
1 |
8.56 × 10⁴ |
+1.31 |
2 |
1.13 × 10⁵ |
+1.83 |
3 |
4.95 × 10⁴ |
+1.32 |
4 |
5.03 × 10³ |
−1.70 |
 |
| Fig. 7 Electronic absorption spectra of 1 (a), 2 (b), 3 (c), and 4 (d) (25 μM each) upon the titration of CT-DNA (0–70 μM) in 10 mM Tris–HCl buffer (pH 8.0) containing 1% DMF. Arrow shows the changes in absorbance with respect to an increase in the CT-DNA concentration. The inset shows the linear fit of [DNA]/(εa − εf) vs. [DNA] and the binding constant (Kb) was calculated using eqn (1). | |
The binding affinity of the interaction between CT-DNA and each of 1–4 is indicated by the binding constant, Kb, which was calculated using the following equation.36e
|
 | (1) |
where [DNA] is the concentration of DNA base pairs,
εa,
εf, and
εb correspond to apparent extinction coefficient for the complex
i.e. Abs/[complex] in the presence of DNA, in absence of DNA and to fully bound DNA, respectively. A plot of [DNA]/(
εa −
εf)
vs. [DNA] gave a slope and intercept equal to 1/(
εb −
εf) and 1/
Kb(
εb −
εf), respectively;
Kb is calculated from the ratio of the slope to the intercept. The data reported in
Table 4 reveal
Kb has values for
1–4 from 1.13 × 10
5 to 5.03 × 10
3 M
−1 with the order of DNA binding strength being
2 >
1 >
3 >
4. The binding affinity of the ligands to CT-DNA were also measured and gave values lower than their corresponding complexes (Fig. S8 and Table S1
†).
3.5.2 Thermal denaturation studies. To investigate whether the stability of DNA alters upon interaction with the complexes, DNA melting experiments were performed in the absence and presence of 1–4.57 The midpoint transition temperature or melting temperature (Tm) of CT-DNA in absence of any complex is ∼65.7 °C. The Tm increased very slightly (∼1.3–1.8 °C) upon interaction with 1–3 whereas 4 showed a slight decrease (1.7 °C) in the thermal melting of CT-DNA (Fig. 8 and Table 4). The low ΔTm values for 1–3 primarily suggest groove binding of the complexes to CT-DNA rather than an intercalative mode of binding to DNA which usually gives a large positive ΔTm value.84,85 The slight negative ΔTm value of −1.70 °C for 4 (Table 4 and Fig. 8) may be due to the destabilisation of the DNA double helix by this complex.86
 |
| Fig. 8 Derivative plot of thermal denaturation of CT-DNA (160 μM) in the absence and presence of 1–4 (150 μM). The experiment was done in 10 mM Tris–HCl buffer (pH 8.0) containing 1% DMF. Inset shows the ΔTm (° C) of the complexes as compared to CT-DNA. | |
3.5.3 Circular dichroism studies. The conformational changes in CT-DNA upon the interaction with complexes was examined using circular dichroism (CD) spectroscopy.87 The B-conformation of CT-DNA shows two conservative CD bands in the UV region, a positive band at 275 nm due to base stacking and a negative band at 245 nm due to right-handed helicity. Groove binding and electrostatic interaction of small molecules shows less or no perturbation on the base stacking and helicity bands whereas an intercalation mode can induce intensity changes of both bands, thus modulating the right-handed B-conformation of DNA.87 The CD spectra of CT-DNA (100 μM) in the presence of the complexes showed very slight changes, for the positive band at 275 nm as well as for the negative band at 245 nm, implying that the interactions were possibly groove binding in nature (Fig. 9).
 |
| Fig. 9 Circular dichroism spectra of CT-DNA (100 μM) in the presence and absence complexes 1–4 in 10 mM Tris–HCl buffer (pH 8.0) containing 1% DMF. The path length of the cuvette was 10 mm. | |
3.5.4 Competitive binding studies. In order to ascertain the binding mode of the complexes with CT-DNA, we have performed the displacement assay or competitive binding experiment with three fluorescent dyes i.e. 4′,6-diamidino-2-phenylindole (DAPI), methyl green (MG) and ethidium bromide (EB). Among these dyes, DAPI binds to the minor groove of DNA, MG binds to the major groove of DNA while EB binds to DNA though intercalation.58–60,88 The binding of these dyes to DNA leads to an increase in the quantum yield of the dye due to which they give enhanced fluorescence upon binding to DNA.58–60The minor groove competitive binding experiment was performed by titrating DAPI bound CT-DNA solution with increasing amount of complexes. The fluorescence intensities of DAPI bound CT-DNA at 455 nm (excitation 358 nm) were measured with an increase of complex concentration (0–90 μM). The competitive binding of the complexes to CT-DNA led to the quenching of the emission intensity of the DAPI bound CT-DNA at 455 nm which is possibly due to the displacement of the bound DAPI to CT-DNA by the complexes. Complex 4 showed the highest quenching of DAPI bound to CT-DNA fluorescence intensity at 455 nm i.e. ∼80%, followed by complex 2 and 3 (∼60%) (Fig. 10). Complex 1 showed ∼20% quenching of the fluorescence intensity at 455 nm which is least among the four complexes (Fig. 10). Therefore our data clearly suggest that all the complexes bind to CT-DNA through minor groove binding mode, as depicted from the decrease in the fluorescence intensity of DAPI bound to CT-DNA at 455 nm.
 |
| Fig. 10 Fluorescence emission spectra of DAPI (2 μM) bound to CT-DNA (50 μM) in the presence of complex 1 (a), 2 (b), 3 (c) and 4 (d) (0–90 μM) in 10 mM Tris–HCl buffer (pH 8.0) containing 1% DMF. The arrow indicates the effect of increasing the concentration of the complex on the fluorescence emission of DAPI bound CT-DNA. | |
Similar competitive binding experiments were also performed to ascertain the major groove and intercalative binding mode of complexes with CT-DNA by monitoring the fluorescence intensity of MG bound CT-DNA at 672 nm and EB bound CT-DNA at 597 nm respectively (Fig. S9 and S10†). On addition of the complexes to MG bound CT-DNA, the emission intensity at 672 nm did not quench significantly (≤2–4%) with the increasing concentration of the complexes from 0–90 μM (Fig. S9†). This showed that the complexes 1–4 were not able to displace MG bound to CT-DNA. This clearly suggests that the complexes do not interact with CT-DNA by major groove binding mode. Similar results were also obtained when EB bound CT-DNA was titrated with increasing concentration of the complexes (0–90 μM) (Fig. S10†). As there was no significant decrease (≤2–4%) in the emission intensity of EB bound CT-DNA at 597 nm, it reveals that the complexes do not bind to CT-DNA through intercalation.
Therefore, from the fluorometric competitive binding studies it is concluded that the complexes (1–4) interact with CT-DNA via minor groove binding mode.
3.6 DNA cleavage studies
3.6.1 Chemical-induced DNA cleavage. The DNA cleavage activity of the complexes 1–4 (1–500 μM) was studied in the dark in the presence of hydrogen peroxide (500 μM) as the oxidising agent using supercoiled pUC19 DNA (300 ng) in 50 mM Tris–HCl buffer (pH 8.0) containing 1% DMF. The complexes do not show any chemical-induced DNA cleavage activity.
3.6.2 Photo-induced DNA cleavage. To investigate whether the DNA binding properties of the complexes were accompanied with photo-nuclease activity, a photo-induced DNA cleavage activity assay was performed. The photo-induced DNA nuclease activity of 1–4 was studied using supercoiled (SC) pUC19 DNA in 50 mM Tris–HCl buffer (pH 8.0) containing 1% DMF upon irradiation of UVA light of 350 nm in the presence and absence of the complexes (Fig. 11). DNA cleavage was indicated by the decrease in the supercoiled pUC19 DNA (Form I) and subsequent formation of nicked circular DNA (Form II) and linear DNA (Form III). The percentage of net DNA cleavage by the complexes was estimated using the following equation: |
 | (2) |
 |
| Fig. 11 Gel diagram showing concentration dependent DNA cleavage by 1–4; 300 ng of SC pUC19 DNA at different concentrations of the complexes [1–500 μM in 50 mM Tris–HCl buffer (pH 8.0) containing 1% DMF] was photo-irradiated with UVA at 350 nm for 3 h. Lanes 1–9: 1, 2.5, 5.0, 7.5, 10, 50, 75, 100 and 500 μM of 1–4. | |
The subscripts “s” and “c” refers to the sample and control, respectively.89 The DNA cleavage activity of the complexes were carried out with increasing concentration of the complexes from 1–500 μM. The net DNA cleavage percent by 1–4 was plotted in a concentration dependent manner in Fig. 12. Approximately 10% DNA cleavage was observed in the presence of 10 μM of 1–4 (Fig. 12, inset). The cleavage activity was saturated for each of the complexes at a concentration of 100 μM. At this concentration, the photo-nuclease activity of 1, 2, 3 and 4 was 50, 33, 65 and 45%, respectively, indicating that 3 has the highest photo-nuclease activity over the series. Further at 500 μM of complex concentration, 2–4 showed a slight decrease in the net DNA cleavage activity while for complex 1 no such change was observed. Cleavage activity of the complexes (1–4) varies because of the different functional group present in their ligand moieties.47 Different heterocycles present in the ligand environment may also have influence on their observed cleavage efficiency.90 The photo-induced DNA cleavage experiments were also carried out with phosphate buffer returning similar activity as for the experiments in tris buffer, an observation in accord with previous studies with dioxidovanadium complexes.47 Control experiments revealed that neither DMF (1%) nor the ligand molecules showed any photo-induced DNA cleavage activity, implying that DMF and the ligands are cleavage inactive under similar conditions (Fig. S11†).
 |
| Fig. 12 Concentration dependent DNA cleavage by 1–4; 300 ng of SC pUC19 DNA at different concentration of the complexes [1–500 μM in 50 mM Tris–HCl buffer (pH 8.0) containing 1% DMF] was photo-irradiated with UVA at 350 nm for 3 h. The net DNA cleavage percent was calculated using eqn (2). Inset shows a bar diagram representation of the net DNA cleavage of different complexes at 10 and 100 μM. | |
In order to understand the mechanistic pathways involved in the photo-cleavage reactions, the photo-induced DNA cleavage activity of 1–4 was investigated in the presence of various additives. The DNA cleavage reaction involving molecular oxygen can proceed in two mechanistic pathways: (a) a type-II process involving singlet oxygen species (1O2), or (b) by a photo-redox pathway involving reactive hydroxyl radicals (OH).91 The addition of NaN3 (singlet oxygen quencher) inhibited the DNA cleavage activity of 1, 3 and 4 by 8, 14 and 10%, respectively (Fig. 13). By contrast, the other singlet oxygen quencher (L-histidine) slightly inhibited the photo-induced DNA cleavage activity of complexes 1, 3 and 4. Surprisingly, it was observed that the DNA cleavage activity of 2 did not alter in the presence of these two additives. The hydroxyl radical scavenger, KI, inhibited the photo-nuclease activity of 1, 3 and 4 by 10, 15 and 13%, respectively, whereas the other hydroxyl radical scavenger D-mannitol inhibited the DNA cleavage activity of these three complexes moderately (Fig. 13 and S12†). However, no inhibition of DNA cleavage was observed for 2 in the presence of these two additives (Fig. 13). Therefore, it is concluded that 1, 3 and 4 exhibit photo-induced DNA cleavage activity via both singlet oxygen and hydroxyl radical pathways, while the mechanistic pathways involved in the photo-induced DNA cleavage by 2 cannot be stated with certainty.
 |
| Fig. 13 DNA cleavage of SC pUC19 DNA by 1–4 in presence of various additives in 50 mM Tris–HCl buffer (pH 8.0) containing 1% DMF. SC pUC19 DNA (300 ng) in the presence of various additives was photo-irradiated at 350 nm for 3 h with 1–4 (100 μM). The additive concentrations were: sodium azide (0.5 mM), L-histidine (0.5 mM), KI (0.5 mM) and D-mannitol (0.5 mM). | |
3.7 Cytotoxicity studies
3.7.1 MTT assay. The in vitro cytotoxicities of 1–4 were evaluated by the MTT assay against the cervical cancer cell line HeLa; the IC50 values are presented in Table 5. The species HL1–2, H2L3–4 and VO(acac)2 gave high IC50 values of >200 ted whereas 1–4 gave values in the range 10–20 μM. Under the same experimental conditions, the commonly used chemotherapeutic drugs cisplatin, gefitinib, gemcitabine, 5-fluorouracil and vinorelbine are comparably effective in HeLa cells with IC50 values of 13, 20, 35, 40 and 48 μM, respectively.92 The significant decrease in the inhibitory ability of the ligand molecules as well as their lower binding affinity to CT-DNA compared to their metal complexes clearly indicates that incorporation of vanadium has a marked effect on cytotoxicity. A possible explanation is that by coordination, the polarity of the ligand and the central metal ion are reduced through charge equilibration which favours permeation of the complexes through the lipid layer of the cell membrane.93,94 The results of DNA binding/cleavage ability for the ligands (Fig. S8 and S11†) have been considered and are consistent with the observation that metal complexes can exhibit greater biological activities than the free ligands.95
Table 5 Cytotoxic scores in HeLa cancer cells for 1–4
Complex |
IC50 (μM) |
1 |
20 ± 4.52 |
2 |
18 ± 3.38 |
3 |
19.5 ± 3.54 |
4 |
9.9 ± 3.18 |
Within the series 1–4, the cytotoxicities of 1, 2 and 3 are approximately similar whereas 4 is more potent, Table 5. Their dose dependencies are illustrated in Fig. 14. The variation in cytotoxicity may be affected by the various functional groups attached to the aroylhydrazone derivative. Very recently, the anti-proliferative activity of some vanadium complexes were reported by Yamaguchi et al.96 and us32,47 using U937 cells and HeLa cells, respectively. The present results are in accord with these results.
 |
| Fig. 14 Effect of 1–4 on cell viability and growth: HeLa cells were treated with different concentrations of the test compound for 72 h and then cell viability was measured by MTT assay. Data are reported as the mean ± S.D. for n = 6 and compared against control by using a Student's t-test. (*significant compared to control). | |
3.7.2 Nuclear staining assay. To investigate the apoptotic potential of the test complexes in HeLa cells, DAPI staining was performed. Chromatin condensation during the process of apoptosis (type I programmed cell death) is a characterizing marker of nuclear alteration. HeLa cells were treated with 16, 15, 16, and 5 μM of 1–4, respectively. The cells were incubated for 24 h before DAPI nuclear staining and were examined under a fluorescent microscope fitted with a DAPI filter; all images are shown in gray-scale. As shown in Fig. 15, control cells hardly showed any sort of condensation in comparison to the treated cells. The treated cells demonstrate the brightly condensed chromatin bodies and the nuclear blebbings as marked by arrows in Fig. 15. Besides showing nuclear change, the treated cells exhibited a shrinking morphology which is another important hallmark of apoptosis.
 |
| Fig. 15 Study of apoptosis by morphological changes in nuclei of HeLa cells: HeLa cells, from control and treated groups, were fixed with 3.7% formaldehyde for 15 min, permeabilised with 0.1% Triton X-100 and stained with 1 μg ml−1 DAPI for 5 min at 37 °C. The cells were then washed with PBS and examined by fluorescence microscopy (Olympus IX 71) (200×). HeLa cells were treated with 16, 15, 16, and 5 μM of complexes 1–4, respectively. Arrows showing the morphological changes in nuclei of HeLa cells observed on application of 1–4 in comparison to the control. | |
4. Conclusions
The synthesis and characterization of four neutral oxidovanadium(V) complexes (1–4) with hydrazone scaffolds containing either furan, thiophene and pyridine residues has been achieved. X-ray crystallography confirm the spectroscopic analyses and show N2O3 five-coordinate geometries, distorted toward square pyramidal, for each of 1 and 2. The dianion in 3 is tetradentate as the pyridyl-N atom also bridges a second V atom leading to a helical coordination polymer and an N2O4 octahedral geometry. A NO5 octahedral geometry is found in mononuclear 4. Biological studies reveal that 1–4 show considerable DNA binding propensity. DNA binding activities were investigated using UV-Vis absorption titration, circular dichroism, thermal denaturation and fluorometric competitive binding studies, and shows that the complexes interact with CT-DNA via minor groove binding mode, with binding constants ranging from 103 to 105 M−1. All complexes show good photo-induced cleavage of pUC19 supercoiled plasmid DNA with 3 showing the highest photo-induced DNA cleavage activity of ∼65%. The results from the mechanistic study suggest that the photolytic DNA cleavage of 1, 3 and 4 proceeded via both singlet oxygen and hydroxyl radical pathways. Additionally, the cytotoxic activities of 1–4 were evaluated against a human cervical cancer cell line (HeLa). All are appreciably cytotoxic compared with standard drugs (cisplatin, gefitinib, gemcitabine, 5-fluorouracil and vinorelbine) with IC50 values ranging from 10 to 20 μM. This potency correlates with the presence of a heterocycle attached to the hydrazone moiety. Despite having a lower binding affinity, the higher cytotoxicity of 4 may be due to the destabilising interaction between the complex and the DNA as evidenced from the thermal denaturation data. The results reported herein will inspire further work on oxidovanadium(V) complexes for the development of metal-based agents for anti-cancer applications.
Acknowledgements
The authors thank the reviewers for their comments and suggestions, which were helpful in preparing the revised version of the manuscript. Funding for this research was provided by the Department of Science and Technology, India [Grants SR/WOS-A/CS-145/2011 (S.P.D.) and SR/FT/CS-016/2008 (R.D.)] and the Council of Scientific and Industrial Research, India [Grant 37(1535)/12/EMR-II) (A.B.)]. A.K.P. acknowledges the receipt of a fellowship from ICMR, India [Grant 45/25/2012-Bio/BMS]. R. D. thanks Prof. S. K. Chattopadhyay for electrochemical studies. The support from the High Impact Research MoE Grant UM.C/625/1/HIR/MoE/SC/12 from the Ministry of Higher Education, Malaysia, is also gratefully acknowledged.
Notes and references
- C. R. Maldonado, L. Salassa, N. G. Blanco and J. C. M. Rivas, Coord. Chem. Rev., 2013, 257, 2668–2688 CrossRef CAS PubMed.
- A. Almeida, B. L. Oliveira, J. D. G. Correia, G. Soveral and A. Casini, Coord. Chem. Rev., 2013, 25, 2689–2704 CrossRef PubMed.
- J. Easmon, G. Pürstinger, G. Heinisch, T. Roth, H. H. Fiebig, W. Holzer, W. Jäger, M. Jenny and J. Hofmann, J. Med. Chem., 2001, 44, 2164–2171 CrossRef CAS PubMed.
- A. Mishra, N. K. Kaushik, A. K. Verma and R. Gupta, Eur. J. Med. Chem., 2008, 43, 2189–2196 CrossRef CAS PubMed.
- F. Arjmand, B. Mohani and S. Ahmad, Eur. J. Med. Chem., 2005, 40, 1103–1110 CrossRef CAS PubMed.
- R. S. Hoonur, B. R. Patil, D. S. Badiger, R. S. Vadavi, K. B. Gudasi, P. R. Dandawate, M. M. Ghaisas, S. B. Padhye and M. Nethaji, Eur. J. Med. Chem., 2010, 45, 2277–2282 CrossRef CAS PubMed.
- R. P. Bakale, G. N. Naik, C. V. Mangannavar, I. S. Muchchandi, I. N. Shcherbakov, C. Frampton and K. B. Gudasi, Eur. J. Med. Chem., 2014, 73, 38–45 CrossRef CAS PubMed.
-
(a) H. N. Hafez and A. B. A. El-Gazzar, Bioorg. Med. Chem. Lett., 2008, 18, 5222–5227 CrossRef CAS PubMed;
(b) M. Fujita, T. Hirayama and N. Ikeda, Bioorg. Med. Chem., 2002, 10, 3113–3122 CrossRef CAS;
(c) A. T. Chaviara, E. E. Kioseoglou, A. A. Pantazaki, A. C. Tsipis, P. A. Karipidis, D. A. Kyriakidis and C. A. Bolos, J. Inorg. Biochem., 2008, 102, 1749–1764 CrossRef CAS PubMed;
(d) Y. Zhu and J. Zhou, ACS Med. Chem. Lett., 2012, 3, 844–849 CrossRef CAS PubMed.
-
(a) L. Laraia, J. Stokes, A. Emery, G. J. McKenzie, A. R. Venkitaraman and D. R. Spring, ACS Med. Chem. Lett., 2014, 5, 598–603 CrossRef CAS PubMed;
(b) Z. Yu, J. A. Brannigan, D. K. Moss, A. Marek Brzozowski, A. J. Wilkinson, A. A. Holder, E. W. Tate and R. J. Leatherbarrow, J. Med. Chem., 2012, 55, 8879–8890 CrossRef CAS PubMed.
-
(a) W. Xie, S. Xie, Y. Zhou, X. Tanga, J. Liu, W. Yang and M. Qiu, Eur. J. Med. Chem., 2014, 81, 22–27 CrossRef CAS PubMed;
(b) K. S. S. Kumar, A. Hanumappa, M. Hegde, K. H. Narasimhamurthy, S. C. Raghavan and K. S. Rangappa, Eur. J. Med. Chem., 2014, 81, 341–349 CrossRef PubMed;
(c) S. Bollinger, H. Hubner, F. W. Heinemann, K. Meyer and P. Gmeiner, J. Med. Chem., 2010, 53, 7167–7179 CrossRef CAS PubMed.
- N. Bharti, M. R. Maurya, F. Naqvi, A. Bhattacharya, S. Bhattacharya and A. Azam, Eur. J. Med. Chem., 2000, 35, 481–486 CrossRef.
- C. Manegold, U. Gatzemeier, J. von Pawel, R. Pirker, R. Malayeri, J. Blatter and K. Krejcy, Ann. Oncol., 2000, 11, 435–440 CrossRef CAS.
- B. Rosenberg, L. V. Camp, J. E. Trosko and V. H. Mansour, Nature, 1969, 222, 385–386 CrossRef CAS PubMed.
- E. R. Jamieson and S. J. Lippard, Chem. Rev., 1999, 99, 2467–2498 CrossRef CAS PubMed.
- Z. Wu, Q. Liu, X. Liang, X. Yang, N. Wang, X. Wang, H. Sun, Y. Luand and Z. Guo, J. Biol. Inorg. Chem., 2009, 14, 1313–1323 CrossRef CAS PubMed.
- Y. Jung and S. J. Lippard, Chem. Rev., 2007, 107, 1387–1407 CrossRef CAS PubMed.
- Vanadium and its Role in Life, Metal Ions in Biological Systems, ed. H. Sigel and A. Sigel, Marcel Dekker, New York, 1995, vol. 31 Search PubMed.
- D. C. Crans, J. J. Smee, E. Gaidamauskas and L. Yang, Chem. Rev., 2004, 104, 849–902 CrossRef CAS PubMed.
- A. S. Tracey, G. R. Willsky and E. S. Takeuchi, Vanadium Chemistry, Biochemistry, Pharmacology and Practical Applications, CRC Press, Boca Raton, 2007 Search PubMed.
- D. Rehder, Org. Biomol. Chem., 2008, 6, 957–964 CAS.
- A. Butler and J. V. Walker, Chem. Rev., 1993, 93, 1937–1944 CrossRef CAS.
- C. R. Cornman, E. P. Zovinka and M. H. Meixner, Inorg. Chem., 1995, 34, 5099–5100 CrossRef CAS.
- K. H. Thompson, J. H. McNeill and C. Orvig, Chem. Rev., 1999, 99, 2561–2571 CrossRef CAS PubMed.
- H. Yasui, Y. Adachi, A. Katoh and H. Sakurai, J. Biol. Inorg. Chem., 2007, 12, 843–853 CrossRef CAS PubMed.
- Y. Shechter, I. Goldwaser, M. Mironchik, M. Fridkin and D. Gefel, Coord. Chem. Rev., 2003, 237, 3–11 CrossRef CAS.
- A. M. B. Bastos, J. G. da Silva, P. I. S. Maia, V. M. Deflon, A. A. Batista, A. V. M. Ferreira, L. M. Botion, E. Niquet and H. Beraldo, Polyhedron, 2008, 27, 1787–1794 CrossRef CAS PubMed.
- R. R. Eady, Coord. Chem. Rev., 2003, 237, 23–30 CrossRef CAS.
- P. K. Sasmal, A. K. Patra and A. R. Chakravarty, J. Inorg. Biochem., 2008, 102, 1463–1472 CrossRef CAS PubMed.
- S. Patra, S. Chatterjee, T. K. Si and K. K. Mukherjea, Dalton Trans., 2013, 13425–13435 RSC.
- M. J. Xie, Y. F. Niu, X. D. Yang, W. P. Liu, L. Li, L. H. Gao, S. P. Yan and Z. H. Meng, Eur. J. Med. Chem., 2010, 45, 6077–6084 CrossRef CAS PubMed.
- N. H. Khan, N. Pandya, N. C. Maity, M. Kumar, R. M. Patel, R. I. Kureshy, S. H. R. Abdi, S. Mishra, S. Das and H. C. Bajaj, Eur. J. Med. Chem., 2011, 46, 5074–5085 CrossRef CAS PubMed.
- S. P. Dash, S. Pasayat, S. Bhakat, S. Roy, R. Dinda, E. R. T. Tiekink, S. Mukhopadhyay, S. K. Bhutia, M. R. Hardikar, B. N. Joshi, Y. P. Patil and M. Nethaji, Inorg. Chem., 2013, 52, 14096–14107 CrossRef CAS PubMed.
- L. H. A. Terra, M. C. Areias, I. Gaubeur and M. E. V. Suez-Iha, Spectrosc. Lett., 1999, 32, 257–271 CrossRef CAS PubMed.
-
(a) M. R. Maurya, S. Agarwal, M. Abid, A. Azam, C. Bader, M. Ebel and D. Rehder, Dalton Trans., 2006, 937–947 RSC;
(b) L. Savini, L. Chiasserini, V. Travagli, C. Pellerano and E. Novellino, Eur. J. Med. Chem., 2004, 39, 113–122 CrossRef CAS PubMed;
(c) Z. Cui, X. Yang, Y. Shi, H. Uzawa, J. Cui, H. Dohi and Y. Nishida, Bioorg. Med. Chem. Lett., 2011, 21, 7193–7196 CrossRef CAS PubMed.
-
(a) J. Easmon, G. Puerstinger, K. S. Thies, G. Heinisch and J. Hofmann, J. Med. Chem., 2006, 49, 6343–6350 CrossRef CAS PubMed;
(b) T. B. Chaston, R. N. Watts, J. Yuan and D. R. Richardson, Clin. Cancer Res., 2004, 10, 7365–7374 CrossRef CAS PubMed;
(c) G. Darnell and D. R. Richardson, Blood, 1999, 94, 781–792 CAS;
(d) L. R. Morgan, B. S. Jursic, C. L. Hooper, D. M. Neumann, K. Thangaraj and B. LeBlanc, Bioorg. Med. Chem. Lett., 2002, 12, 3407–3411 CrossRef CAS;
(e) G. S. Hassan, H. H. Kadry, S. M. Abou-Seri, M. M. Ali and A. E. Mahmoud, Bioorg. Med. Chem., 2011, 19, 6808–6817 CrossRef CAS PubMed.
-
(a) T. B. Chaston and D. R. Richardson, J. Biol. Inorg. Chem., 2003, 8, 427–438 CAS;
(b) Q. Wang, Z. Y. Yang, G. F. Qi and D. D. Qin, Eur. J. Med. Chem., 2009, 44, 2425–2433 CrossRef CAS PubMed;
(c) Y. Li, Z. Y. Yang and M. F. Wang, Eur. J. Med. Chem., 2009, 44, 4585–4595 CrossRef CAS PubMed;
(d) K. Ghosh, P. Kumar, N. Tyagi, U. P. Singh, V. Aggarwal and M. C. Baratto, Eur. J. Med. Chem., 2010, 45, 3770–3779 CrossRef CAS PubMed;
(e) P. Krishnamoorthy, P. Sathyadevi, A. H. Cowley, R. R. Butorac and N. Dharmaraj, Eur. J. Med. Chem., 2011, 46, 3376–3387 CrossRef CAS PubMed.
- D. S. Raja, N. S. P. Bhuvanesh and K. Natarajan, J. Biol. Inorg. Chem., 2012, 17, 223–237 CrossRef CAS PubMed.
- Y. C. Liu and Z. Y. Yang, Eur. J. Med. Chem., 2009, 44, 5080–5089 CrossRef CAS PubMed.
- Y. C. Liu and Z. Y. Yang, J. Inorg. Biochem., 2009, 103, 1014–1022 CrossRef CAS PubMed.
- F. Léonard, A. Andrémont and C. Tancréde, J. Appl. Bacteriol., 1985, 58, 545–553 CrossRef PubMed.
- Y. V. Shikova, V. A. Likhoded, A. G. Khasanov, S. V. Chuykin, T. A. Khasanov and D. G. Shaybakov, RU 2438650 C1 20120110, 2012.
- A. G. Tempone, R. A. Mortara, H. F. De Andrade Jr and J. Q. Reimão, Int. J. Antimicrob. Agents, 2010, 36, 159–163 CrossRef CAS PubMed.
- L. J. Rubin and R. H. Peter, J. Med., 1980, 302, 69–73 CAS.
- S. Todorovic, N. Juranic, S. Macura and F. Rusnak, J. Am. Chem. Soc., 1999, 121, 10962–10966 CrossRef CAS.
-
(a) C. D. Fan, H. Su, J. Zhao, B. X. Zhao, S. L. Zhang and J. Y. Miao, Eur. J. Med. Chem., 2010, 45, 1438–1446 CrossRef CAS PubMed;
(b) M. V. Angelusiu, S. F. Barbuceanu, C. Draghici and G. L. Almajan, Eur. J. Med. Chem., 2010, 45, 2055–2062 CrossRef CAS PubMed;
(c) G. Kumar, S. Devi, R. Johari and D. Kumar, Eur. J. Med. Chem., 2012, 52, 269–274 CrossRef CAS PubMed;
(d) D. S. Raja, E. Ramachandran, N. S. P. Bhuvanesh and K. Natarajan, Eur. J. Med. Chem., 2013, 64, 148–159 CrossRef PubMed;
(e) P. P. Netalkar, S. P. Netalkar, S. Budagumpi and V. K. Revankar, Eur. J. Med. Chem., 2014, 79, 47–56 CrossRef CAS PubMed.
-
(a) M. K. Sahani, U. Yadava, O. P. Pandey and S. K. Sengupta, Spectrochim. Acta, Part A, 2014, 125, 189–194 CrossRef CAS PubMed;
(b) M. R. Maurya, A. A. Khan, A. Azam, S. Ranjan, N. Mondal, A. Kumar, F. Avecilla and J. C. Pessoa, Dalton Trans., 2010, 1345–1360 RSC;
(c) R. C. Maurya and S. Rajput, J. Mol. Struct., 2007, 833, 133–144 CrossRef CAS PubMed;
(d) M. R. Maurya, S. Agarwal, C. Bader and D. Rehder, Eur. J. Inorg. Chem., 2005, 147–157 CrossRef CAS PubMed.
- S. P. Dash, A. K. Panda, S. Pasayat, R. Dinda, A. Biswas, E. R. T. Tiekink, Y. P. Patil, M. Nethaji, W. Kaminsky, S. Mukhopadhyay and S. K. Bhutia, Dalton Trans., 2014, 10139–10156 RSC.
- R. A. Rowe and M. M. Jones, Inorg. Synth., 1957, 5, 113–116 CAS.
- APEX2, SAINT and SADABS, BrukerAXS Inc, Madison, Wisconsin, USA, 2007 Search PubMed.
- CrysAlis PRO, Agilent Technologies, Yarnton, Oxfordshire, England, 2011 Search PubMed.
- G. M. Sheldrick, Acta Crystallogr., Sect. A: Found. Crystallogr., 2008, 64, 112–122 CrossRef CAS PubMed.
- L. J. Farrugia, J. Appl. Crystallogr., 2012, 45, 849–854 CrossRef CAS.
- H. D. Flack, Acta Crystallogr., Sect. A: Found. Crystallogr., 1983, 39, 876–881 CrossRef.
- J. Gans and D. Shalloway, J. Mol. Graphics Modell., 2001, 19, 557–559 CrossRef CAS.
- K. Brandenburg, DIAMOND. Crystal Impact GbR, Bonn, Germany, 2006 Search PubMed.
- A. L. Spek, Acta Crystallogr., Sect. D: Biol. Crystallogr., 2009, 65, 148–155 CrossRef CAS PubMed.
- P. Kumar, S. Gorai, M. K. Santra, B. Mondal and D. Manna, Dalton Trans., 2012, 7573–7581 RSC.
- S. Satpathi, A. Sengupta, V. M. Hridya, K. Gavvala, R. K. Koninti, B. Roy and P. Hazra, Sci. Rep., 2015, 5, 9137 CrossRef PubMed.
- D. Prieto, G. Aparicio, P. E. Morande and F. R. Zolessi, Histochem. Cell Biol., 2014, 142, 335–345 CrossRef CAS PubMed.
- Saswati, A. Chakraborty, S. P. Dash, A. K. Panda, R. Dinda, A. Biswas, S. Mukhopadhyay, S. K. Bhutia, A. Crochet and R. Acharyya, Dalton Trans., 2015, 6140–6157 CAS.
- S. K. Bhutia, S. K. Mallick, S. M. Stevens, L. Prokai, J. K. Vishwanatha and T. K. Maiti, Toxicol. In Vitro, 2008, 22, 344–351 CrossRef CAS PubMed.
- S. Mukhopadhyay, P. K. Panda, B. Behera, C. K. Das, M. K. Hassan, D. N. Das, N. Sinha, A. Bissoyi, K. Pramanik, T. K. Maiti and S. K. Bhutia, Food Chem. Toxicol., 2014, 64, 369–377 CrossRef CAS PubMed.
-
(a) R. Dinda, P. Sengupta, S. Ghosh and T. C. W. Mak, Inorg. Chem., 2002, 41, 1684–1688 CrossRef CAS;
(b) R. Dinda, P. Sengupta, M. Sutradhar, T. C. W. Mak and S. Ghosh, Inorg. Chem., 2008, 47, 5634–5640 CrossRef CAS PubMed.
- S. Das, G. P. Muthukumaragopal, S. N. Pal and S. Pal, New J. Chem., 2003, 27, 1102–1107 RSC.
-
(a) R. Dinda, P. K. Majhi, P. Sengupta, S. Pasayat and S. Ghosh, Polyhedron, 2010, 29, 248–253 CrossRef CAS PubMed;
(b) A. Hazra, S. Gupta, S. Roy, T. N. Mandal, K. Das, S. Konar, A. Jana, S. Ray, R. J. Butcher and S. K. Kar, Polyhedron, 2011, 30, 187–194 CrossRef CAS PubMed.
- M. Moon, M. Pyo, Y. C. Myoung, C. Ahn and M. S. Lah, Inorg. Chem., 2001, 40, 554–557 CrossRef CAS.
- Y. Jin, H. Lee, M. Pyo and M. S. Lah, Dalton Trans., 2005, 797–803 RSC.
-
(a) M. R. Maurya, A. Kumar, M. Ebel and D. Rehder, Inorg. Chem., 2006, 45, 5924–5937 CrossRef CAS PubMed;
(b) M. R. Maurya, C. Haldar, A. Kumar, M. L. Kuznetsov, F. Avecilla and J. C. Pessoa, Dalton Trans., 2013, 11941–11962 RSC.
- T. Ghosh, B. Mondal and R. Patra, Transition Met. Chem., 2007, 32, 468–474 CrossRef CAS.
- J. Chakravarty, S. Dutta, S. K. Chandra, P. Basu and A. Chakravorty, Inorg. Chem., 1993, 32, 4249–4255 CrossRef CAS.
- L. Z. Geng, J. Xing and Y. Z. Zhou, Chin. J. Struct. Chem., 2012, 31, 185–190 CAS.
- A. W. Addison, T. N. Rao, J. Reedijk, J. van Rijn and G. C. Verschoor, Dalton Trans., 1984, 1349–1356 RSC.
- V. M. Deflon, D. M. de Oliveira, G. F. de Sousa, A. A. Batista, L. R. Dinelli and E. E. Castellano, Z. Anorg. Allg. Chem., 2002, 628, 1140–1144 CrossRef CAS.
- Intramolecular N–H⋯N hydrogen bonding interactions in the crystal structure of 2. First independent molecule: N4–H2n⋯N3 = 2.02(2) Å, N4⋯N3 = 2.699(2) Å, with angle at H2n = 133.1(16)°; second independent molecule: N4a–H4n⋯N3a = 2.01(2) Å, N4a⋯N3a = 2.677(2) Å, with angle at H4n = 132.6(18)°.
- R. S. Veerapur, K. B. Gudasi, M. Sairam, R. V. Shenoy, M. Netaji, K. V. S. N. Raju, B. Sreedhar and T. M. Aminabhavi, J. Mater. Sci., 2007, 42, 4406–4417 CrossRef CAS.
- C. C. Gatto, E. S. Lang, R. A. Burrow and U. Abram, J. Braz. Chem. Soc., 2006, 17, 1612–1616 CrossRef CAS PubMed.
- F. H. Allen, Acta Crystallogr., Sect. B: Struct. Crystallogr. Cryst. Chem., 2002, 58, 380–388 CrossRef PubMed.
- C. Y. Wang, J. J. Hu, H. Y. Tu, P. F. Zhu and S. J. Sheng, Acta Crystallogr., Sect. E: Struct. Rep. Online, 2011, 67, m1475–m1476 CAS.
- M. K. Milčič, V. B. Medaković, D. N. Sredojević, N. O. Juranić, Z. D. Tomić and S. D. Zarić, Inorg. Chem., 2006, 45, 4755–4763 CrossRef PubMed.
- E. R. T. Tiekink and I. Haiduc, Prog. Inorg. Chem., 2005, 54, 127–319 CAS.
- E. R. T. Tiekink and J. Zukerman-Schpector, Chem. Commun., 2011, 47, 6623–6625 RSC.
- V. Rajendiran, M. Murali, E. Suresh, S. Sinha, K. Somasundaram and M. Palaniandavar, Dalton Trans., 2008, 148–163 RSC.
- F. Arjmand and M. Aziz, Eur. J. Med. Chem., 2009, 44, 834–844 CrossRef CAS PubMed.
- Y. An, S. D. Liu, S. Y. Deng, L. N. Ji and Z. W. Mao, J. Inorg. Biochem., 2006, 100, 1586–1593 CrossRef CAS PubMed.
- S. Banerjee, A. Hussain, P. Prasad, I. Khan, B. Banik, P. Kondaiah and A. R. Chakravarty, Eur. J. Inorg. Chem., 2012, 3899–3908 CrossRef CAS PubMed.
- N. Poklar, D. S. Pilch, S. J. Lippard, E. A. Redding, S. U. Dunham and K. J. Breslauer, Proc. Natl. Acad. Sci. U. S. A., 1996, 93, 7606–7611 CrossRef CAS.
- L. Li, Q. Guo, J. Dong, T. Xu and J. Li, J. Photochem. Photobiol., B, 2013, 125, 56–62 CrossRef CAS PubMed.
- A. K. Krey and F. E. Hahn, Biochemistry, 1975, 14, 5061–5067 CrossRef CAS.
- W. M. Dai, K. W. Lai, A. Wu, W. Hamaguchi, M. Y. Lee, L. Zhou, A. Ishii and S. Nishimoto, J. Med. Chem., 2002, 45, 758–761 CrossRef CAS PubMed.
- J. R. Hwu, C. C. Lin, S. H. Chuang, K. Y. King, T.-R. Suc and S.-C. Tsayd, Bioorg. Med. Chem., 2004, 12, 2509–2515 CrossRef CAS PubMed.
- P. K. Sasmal, S. Saha, R. Majumdar, S. De, R. R. Dighe and A. R. Chakravarty, Dalton Trans., 2010, 2147–2158 RSC.
- M. Ahmed and K. Jamil, Biol. Med., 2011, 3, 60–71 CAS.
- A. M. Ramadan, J. Inorg. Biochem., 1997, 65, 183–189 CrossRef CAS.
- P. G. Avaji, C. H. V. Kumar, S. A. Patil, K. N. Shivananda and C. Nagaraju, Eur. J. Med. Chem., 2009, 44, 3552–3559 CrossRef CAS PubMed.
- T. Rosu, E. Pahontu, S. Pasculescu, R. Georgescu, N. Stanica, A. Curaj, A. Popescu and M. Leabu, Eur. J. Med. Chem., 2010, 45, 1627–1634 CrossRef CAS PubMed.
- T. Yamaguchi, S. Watanabe, Y. Matsumura, Y. Tokuoka and A. Yokoyama, Bioorg. Med. Chem., 2012, 20, 3058–3064 CrossRef CAS PubMed.
Footnote |
† Electronic supplementary information (ESI) available: Table S1, Fig. S1–S12. CCDC 1007034–1007037. For ESI and crystallographic data in CIF or other electronic format see DOI: 10.1039/c4ra14369h |
|
This journal is © The Royal Society of Chemistry 2015 |
Click here to see how this site uses Cookies. View our privacy policy here.