DOI:
10.1039/C5RA07333B
(Paper)
RSC Adv., 2015,
5, 47439-47450
A multifunctional molecular entity CuII–SnIV heterobimetallic complex as a potential cancer chemotherapeutic agent: DNA binding/cleavage, SOD mimetic, topoisomerase Iα inhibitory and in vitro cytotoxic activities†
Received
22nd April 2015
, Accepted 1st May 2015
First published on 5th May 2015
Abstract
New chiral L-valine-derived Schiff base complexes with the bioactive heterocyclic ligand scaffold pyrazole (Hpz) were designed and synthesized with a view to find their potential as anticancer chemotherapeutic drug candidates. The monometallic chemical entities CuII (1) and ZnII (2), and heterobimetallic CuII–SnIV (3), and ZnII–SnIV (4) were synthesized and characterized adopting various spectroscopic (UV-vis, IR, 1H 13C and 119Sn NMR, EPR and ESI-MS) and analytical methods. In vitro, CT-DNA-binding profiles of 1–4 were studied by UV-vis, fluorescence spectroscopy, and circular dichroism. The results display the significantly higher binding affinity of heterobimetallic complexes 3 and 4 than monometallic complexes 1 and 2. This could be attributed to the dual binding mode facilitating a preferential electrostatic interaction via SnIV towards the surface phosphate oxygen of the sugar–phosphate backbone of the DNA double helix, in addition to the covalent overlap of CuII to N7 of the guanine of the DNA. Moreover, complex 3 exhibited significantly efficient DNA cleavage activity involving the formation of the superoxide radical as well as the hydroxyl radical as the reactive species. The SOD-like activity of 3 and 4 was evaluated using a xanthine/xanthine oxidase assay, which showed SOD activity in the micromolar range for both the heterobimetallic complexes viz., (IC50) 0.082 μM for 3 and 12 μM for 4. Furthermore, 3 showed high inhibitory activity against Topo-Iα at a concentration of 20 μM as IC50, suggesting that complex 3 is an efficient DNA cleaving agent. In vitro studies on the anticancer activity against the HepG2 hepatocellular carcinoma cell line revealed that both complexes 3 and 4 have the capability to kill the chosen cancer cell, but the efficiency of complex 3 is 10 times higher than 4. The mode of cell death induced by complex 3 is primarily apoptosis as revealed by AO/EB staining, Hoechst 33258 staining, and assessment of the mitochondrial trans-membrane potential.
Introduction
Cancer is a deadly menace, involving unregulated cell growth, invasion, and metastasis.1 Cancer is the third leading cause of death with ∼12 million new cases, and an estimated 7.6 million cancer deaths to have occurred globally in 2007.2 By 2030, this figure is expected to have increased exponentially (increase by +69%).3 The current treatment modalities include: (i) surgical procedures, which provide the most successful cure, followed by (ii) several chemotherapy regimens, which substantially improve local relapse rates and the overall survival of the patient, (iii) immunotherapy or hormone therapy,4a and (iv) radiotherapy.4b Neoadjuvant chemotherapy is administered earlier to the main treatment to reduce the size or extent of cancer before using a radical treatment intervention, thus making procedures easier and more likely to be successful.5 Globally, the sixth most frequent cancer is primary liver cancer. It is ranked as the second leading cause of cancer death. Only in 2012, the cases found were 782![[thin space (1/6-em)]](https://www.rsc.org/images/entities/char_2009.gif) 000 and led to 746000 deaths.6 Thus, liver cancer is a principal health concern. The chemotherapeutic drugs employed currently suffer from the development of resistance or are not specific to the target so that systemic toxicities arise.7 Transarterial chemoembolization of doxorubicin using drug-eluting beads is recommended as the principal intervention for liver cancer. Metal-based chemical entities are also in the pipeline in light of cisplatin having stimulated interest and spurred research into new metal-based anticancer drugs. Copper is an essential trace metal and regulates angiogenesis, i.e., the growth of tumor blood vessels that are important for tumor growth, invasion, and metastasis.8 It has been shown that tumors without adequate blood supply do not grow larger than 1 to 2 mm.3,9 A potential strategy for cancer chemotherapy is an organic scaffold with metallic species, particularly copper, that can bind with elevated copper in cancer cells and tissues. The accumulation of a high concentration of copper is a unique feature of cancer cells, which while leaving normal cells to suffer only minimally thereby converts pro-angiogenic cofactor copper into a cancer-specific killing agent.10 On the other hand, organotin(IV) is considered as an important class of compounds for fighting cancer. A large number of compounds have shown efficient cytotoxic activities against panels of human cancer cell lines both in vitro and in vivo.11 Among the organic ligands, Schiff bases are the most appropriate ligands owing to their versatile synthesis, metal binding domain, and novel structural features.12 A Schiff base can prove to be an ideal functional pharmacophore for metal-based drug design. Such Schiff base complexes are seldom reported. In the case of new Schiff base complexes, it is important to evaluate the mode of binding with DNA, the extent of binding and the cleavage mechanism13 that are the pre-criteria for efficacious metallodrugs for cancer. The Schiff base of O-vanillin and L-valine has unique structural features due to the presence of biocompatible motif viz., an amino acid, in combination with a biologically active pyrazole ancillary ligand.
000 and led to 746000 deaths.6 Thus, liver cancer is a principal health concern. The chemotherapeutic drugs employed currently suffer from the development of resistance or are not specific to the target so that systemic toxicities arise.7 Transarterial chemoembolization of doxorubicin using drug-eluting beads is recommended as the principal intervention for liver cancer. Metal-based chemical entities are also in the pipeline in light of cisplatin having stimulated interest and spurred research into new metal-based anticancer drugs. Copper is an essential trace metal and regulates angiogenesis, i.e., the growth of tumor blood vessels that are important for tumor growth, invasion, and metastasis.8 It has been shown that tumors without adequate blood supply do not grow larger than 1 to 2 mm.3,9 A potential strategy for cancer chemotherapy is an organic scaffold with metallic species, particularly copper, that can bind with elevated copper in cancer cells and tissues. The accumulation of a high concentration of copper is a unique feature of cancer cells, which while leaving normal cells to suffer only minimally thereby converts pro-angiogenic cofactor copper into a cancer-specific killing agent.10 On the other hand, organotin(IV) is considered as an important class of compounds for fighting cancer. A large number of compounds have shown efficient cytotoxic activities against panels of human cancer cell lines both in vitro and in vivo.11 Among the organic ligands, Schiff bases are the most appropriate ligands owing to their versatile synthesis, metal binding domain, and novel structural features.12 A Schiff base can prove to be an ideal functional pharmacophore for metal-based drug design. Such Schiff base complexes are seldom reported. In the case of new Schiff base complexes, it is important to evaluate the mode of binding with DNA, the extent of binding and the cleavage mechanism13 that are the pre-criteria for efficacious metallodrugs for cancer. The Schiff base of O-vanillin and L-valine has unique structural features due to the presence of biocompatible motif viz., an amino acid, in combination with a biologically active pyrazole ancillary ligand.
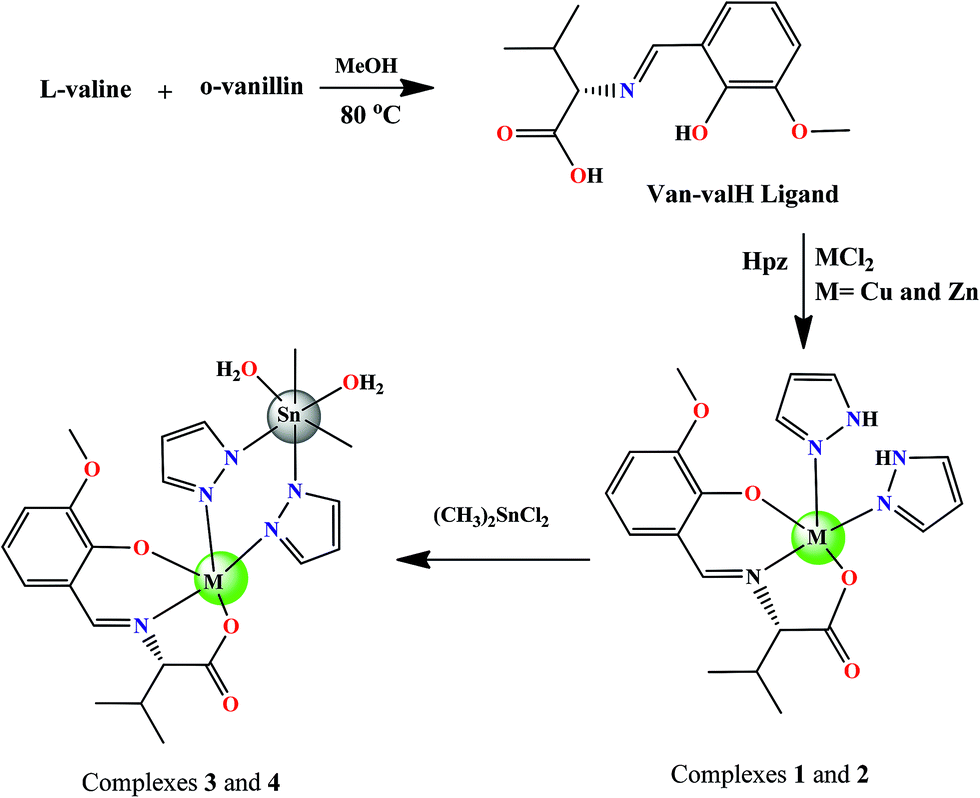
We describe the syntheses of new monometallic and heterobimetallic complexes with a chiral Schiff base motif (derived from O-vanillin and L-valine) and pyrazole as a secondary ligand. In vitro DNA binding and cleavage, studies were carried out to investigate the potential of the complexes as anticancer drug candidates. The cytotoxicity of the heterobimetallic complexes was investigated in a HepG2 (hepatocellular carcinoma) cell adopting MTT assay and a few assays for apoptosis to find their potential as candidates for the drug development of cancer drugs in general and liver cancer in particular wherein complex 3 was found to be the most efficient.
Results and discussion
Synthesis and characterization
Bioactive chiral complexes of the L-valine Schiff base scaffold with pyrazole in a 1:1:2 molar ratio of the formulation [Cu(Van–val)(HPz)2] (1), [Zn(Van–val)(Hpz)2] (2); and heterobimetallic entities [Cu(Van–val)(pz)2Sn(CH3)2(H2O)2] (3) and [Zn(Van–val)(pz)2Sn(CH3)2(H2O)2] (4), which were achieved by further addition of (CH3)2SnCl2 to complexes 1 and 2 (Scheme 1). The spectroscopic studies of 1–4 revealed the penta-coordinate coordination geometry of the central metal ions viz., CuII and ZnII while the SnIV atom exhibited an octahedral environment. All these complexes are soluble in DMSO. The molar conductance values of all the complexes 1–4 in DMSO (1 × 10⁻³ M) at 25 °C were observed in the range 7.4–8.8 ohm−1 cm2 mol−1, which ascertained the non-electrolytic nature of the complexes.
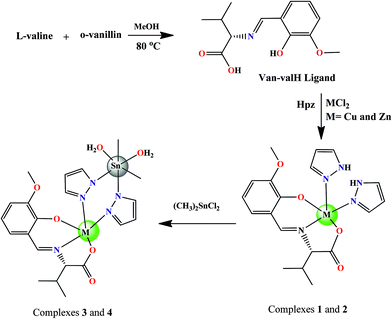 |
| | Scheme 1 A schematic representation of the complexes 1–4, and their synthetic procedure. | |
The IR spectra of all four complexes 1–4 possess strong characteristic bands attributed to the stretching vibration of azomethine [ν(C![[double bond, length as m-dash]](https://www.rsc.org/images/entities/char_e001.gif) N)] in the range 1653–1628 cm−1. A distinctive sharp band associated with ν(CN) of the coordinating pyrazole ligands appears at ca. 1569–1551 cm−1 (ref. 14) in complexes 1–4. The bands in the range 1358–1305 cm−1 correspond to the symmetric (COO) stretching vibrations.15 The significant shifts in these values confirm the coordination of the metal center with the tridentate Schiff base ligand (Van–valH). The presence of medium intensity bands at 595–550, 440–425 cm−1 corresponding to ν(M–O), and ν(M–N) vibrations, respectively, ascertain the formation of a coordinate bond with the metal center in all the complexes.16 Furthermore, the IR spectra of complexes 3 and 4 give rise to new peaks associated with ν(Sn–O) and ν(Sn–N) vibrations ∼556–554 cm−1 and 486–482 cm−1, respectively, which further confirms the proposed structure.17
N)] in the range 1653–1628 cm−1. A distinctive sharp band associated with ν(CN) of the coordinating pyrazole ligands appears at ca. 1569–1551 cm−1 (ref. 14) in complexes 1–4. The bands in the range 1358–1305 cm−1 correspond to the symmetric (COO) stretching vibrations.15 The significant shifts in these values confirm the coordination of the metal center with the tridentate Schiff base ligand (Van–valH). The presence of medium intensity bands at 595–550, 440–425 cm−1 corresponding to ν(M–O), and ν(M–N) vibrations, respectively, ascertain the formation of a coordinate bond with the metal center in all the complexes.16 Furthermore, the IR spectra of complexes 3 and 4 give rise to new peaks associated with ν(Sn–O) and ν(Sn–N) vibrations ∼556–554 cm−1 and 486–482 cm−1, respectively, which further confirms the proposed structure.17
The 1H NMR spectrum of complex 2 exhibited a characteristic broad peak at 7.57 ppm associated with the NH of pyrazole, whereas the NH signal disappeared from the spectrum of 4. The significant shifts in the signal of the pyrazole protons of 4 (7.53–7.51, 7.16–7.11 ppm) in comparison with 2 (7.77–7.76, 7.14–7.12 ppm), confirms the coordination of SnIV to the azole nitrogen atom via deprotonation. Along with these marked differences, the signals associated with the aromatic and aliphatic protons were observed in accordance with the proposed structure. The multiplicity pattern and the 2J[119Sn,1H] coupling constant values of the dimethyl tin moiety were calculated by the 1H NMR chemical shift. The dihedral C–Sn–C angle was evaluated using Lockhart’s equation. The coupling constant (2J[1H,119Sn]) value was found to be ∼93 and the dihedral C–Sn–C angle obtained was ∼151.2° for complex 4, which is consistent with a hexacoordinated environment around the SnIV atom.18
The 13C NMR spectra showed characteristic signals associated with O–CO, H–CN, and Hpz moiety carbons at 169.2, 168.5, 138.4–127.3 ppm for 2 and with significant downfield shift for 4 at 176.2, 175.8, 136.0–126.9 ppm, respectively. These downfield shifts in signals ascertain the coordination of the Sn(IV) atom with the nitrogen of the pyrazole moieties. Furthermore, phenyl ring aromatic carbon signals were observed in the range 118.2–99.5 ppm for complex 2 and 118.3–103.3 ppm for 4. The peaks associated with the methyl groups bonded to the Sn(IV) atom were found at 18.9 and 17.7 ppm. The coupling constant 1J(13C,119Sn) value for 4 was ∼941 Hz.
The 119Sn NMR spectrum of 4 displayed signals at −580.8 ppm. The 119Sn NMR chemical shift values validate the number and type of substituents linked to the tin atom. By applying the Lockhart and Holecek equations, the coupling constants 2J[1H,119Sn] and 1J[13C,119Sn] were used to reveal the stereochemistry of the tin atom, which permitted the calculation of the magnitude of the C–Sn–C bond angles. The chemical shift value is consistent with the hexacoordinated geometry of the tin atom and with those reported earlier.19
The EPR spectra of 1 and 3 in DMSO at LNT were recorded in the X-band region (ESI, Fig. S1†). The g factors were quoted relative to the standard marker TCNE (g = 2.00277). The EPR spectra of complexes 1 and 3 exhibited g‖ = 2.146, 2.213 and g⊥ = 2.057, 2.065 values, respectively. The frozen solution EPR spectra of complexes 1 and 3 revealed axial features (g‖ > g⊥ > 2.0023) and suggested a dx2−y2 ground state. The measurement of the exchange interaction between the copper centers in the polycrystalline compound can be given by the geometric parameter “G” using the relation: G = (g‖ − 2.0023)/(g⊥ − 2.0023). The exchange interaction may be negligible if G is greater than 4. A considerable exchange interaction is indicated in the solid complex if G is less than 4.20 The value g‖ > g⊥ > 2.0023 indicates a dx2−y2 or dz2 ground state that is consistent with square pyramidal geometry. The magnetic moments observed for complexes 1 and 3 are 1.79 BM and 1.85 BM, which are consistent with values expected for copper(II) with the spin S = 1/2.
In vitro DNA binding studies
Absorption titration studies. Upon the addition of increasing concentrations of CT-DNA (0.067–0.33 × 10⁻⁴ M) with constant concentrations of complexes 1–4 (0.067 × 10⁻⁴ M), the absorbance intensity increased, i.e., a “hyperchromic” effect. The absorption spectra of these complexes 1–4 exhibit hyperchromism of 29.57%, 21.47%, 41.52%, and 32.88%, respectively, at the intraligand absorption band (262–274 nm) (Fig. 1 and S4†). The observed hyperchromism could be attributed to the binding of the complexes to DNA either by an electrostatic (external groove) or partial intercalation mode.21
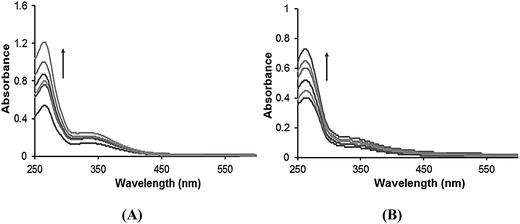 |
| | Fig. 1 The absorption spectral traces of (A) complex 3 and (B) complex 4 in 5% DMSO/5 mM Tris–HCl/50 mM NaCl buffer (pH 7.2), upon increasing the concentration of CT-DNA. | |
The binding strength of complexes 1–4 with CT-DNA was quantitatively compared by evaluating the intrinsic binding constants Kb of the complexes, which were determined using eqn (1) and by monitoring the changes in absorbance of the π–π* bands with increasing concentrations of CT-DNA:
| | |
[DNA]/|εa − εf| = [DNA]/|εb − εf| + 1/Kb|εb − εf|
| (1) |
where
εa,
εf, and
εb correspond to
Aobsd/[M], the extinction coefficient for the free complexes, and the extinction coefficient for the complex in the fully bound form, respectively. A plot of [DNA]/(
εa −
εf)
versus [DNA], where [DNA] is the concentration of DNA in the base pairs, gives
Kb as the ratio of the slope to the intercept.
17 The
Kb values obtained for complexes
1–4 were 1.89 × 10
4, 1.43 × 10
4, 2.70 × 10
4 and 2.40 × 10
4 M
−1, respectively. The strength of binding follows the order
3 >
4 >
1 >
2, which demonstrates that the heterobimetallic complexes bind more efficiently with DNA compared to the monometallic complexes.
22 The heterobimetallic complexes
3 and
4 exhibited a dual mode of binding at the molecular target site with preferential selectivity and recognition towards nucleobases.
21
Emission spectral studies. The emission spectra of the complexes 1–4 displayed weak luminescence at around 270–290 nm in 0.01 Tris–HCl/50 mM NaCl buffer at room temperature when excited at 260 nm. Upon increasing the CT-DNA concentration, a gradual increase in the emission intensity was observed (Fig. 2 and S5†). The enhancement in emission intensity is related to the extent to which the complex penetrates into the hydrophobic environment inside the DNA helix, so that the complex mobility is restricted at the binding site leading to a decrease in the vibrational mode of relaxation and thus avoiding the quenching effect of solvent molecules. The increase in emission intensity revealed that the complexes interact by hydrophobic contacts in the major and/or minor grooves of the DNA.23 The fluorescence enhancement can also be induced by energy transfer from CT-DNA to the metal complexes.21 The binding constant “K” values determined from the Scatchard equation for complexes 1–4 with a mean standard deviation (±0.04) were found to be 2.05 × 10⁴, 1.29 × 10⁴, 4.13 × 10⁴ and 3.65 × 10⁴ M−1, respectively. The binding constant K values were of the same order 3 > 4 > 1 > 2 as observed in the UV-vis spectral studies.
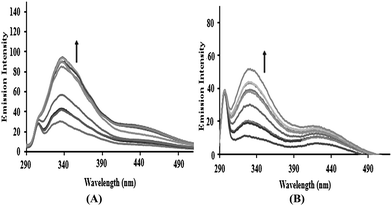 |
| | Fig. 2 The emission spectra of (A) complex 3 and (B) complex 4 in the presence of DNA in 5 mM Tris–HCl/50 mM NaCl buffer. Arrows show the intensity changes with increasing concentrations of DNA. | |
Phosphate binding studies. Furthermore, validation of the phosphate binding affinity of complexes 3 and 4 was performed by fluorescence titration in the presence of K2HPO4 at room temperature. On increasing the K2HPO4 concentration, the fluorescence intensity of complexes 3 and 4 showed a significant increase, confirming competitive binding behavior between the phosphate group of K2HPO4 and the phosphate component of the DNA backbone.24 This competitive interaction of the phosphate groups weakens the interaction of the complexes with DNA, which provides evidence for the electrostatic interaction of the SnIV complexes with the phosphate backbone of DNA25 (Fig. 3).
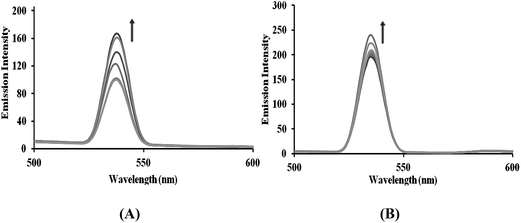 |
| | Fig. 3 The emission spectra of complexes 3 and 4 with increasing concentrations of K2HPO4, in the absence and presence of CT-DNA in Tris–HCl buffer at pH = 7.2 at room temperature. The arrows show the intensity changes with increasing concentrations of K2HPO4. | |
Ethidium bromide binding studies. The treatment of increasing the concentration of complexes 1–4 in CT-DNA pretreated with ethidium bromide ([DNA]/[EB] = 1) resulted in a quenching of the emission intensity in the order 3 > 4 > 1 > 2 (Fig. 4 and S6†). This quenching pattern is typical for competitive displacement of the bound ethidium bromide from the CT-DNA caused by complexes 3 and 4, which removes EB molecules from the EB–DNA system and ascertains the groove binding affinity. Further, the quenching extent of complexes 1–4 were quantitatively evaluated using the classical Stern–Volmer equation,
where, Io and I are the emission intensities in the absence and presence of the complex, r is the ratio of the [complex]/[DNA], and KSV is the linear Stern–Volmer quenching constant. The KSV values used to evaluate quenching efficiency for the complexes 1–4 were found to be 1.45 × 10⁴, 1.60 × 10⁴, 2.86 × 10⁴ and 2.37 × 10⁴ M−1, respectively.
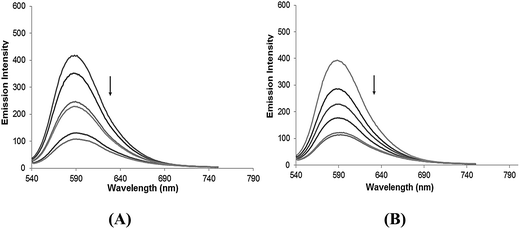 |
| | Fig. 4 The emission spectra of EB bound to DNA in the absence and presence of (A) complex 3 and (B) complex 4 in 5 mM Tris–HCl/50 mM NaCl buffer. Arrows show the intensity changes with increasing concentrations of the complexes. | |
Circular dichroism. To gain further information about the conformational change of the DNA helix, we carried out circular dichroism (CD) studies with CT-DNA altered by the presence of complexes 3 and 4. The observed CD spectrum of calf thymus DNA is characterized by a positive band at 275 nm (UV: λmax, 260 nm) and a negative band at 248 nm which is due to base stacking and helicity that is characteristic of DNA in the right-handed conical B form.26,27 Any change in the DNA spectrum below 300 nm is due to the DNA-induced CD (ICD) of the metal complex. At different concentrations ([DNA]/[complex], R = 0, 0.5, 1.0), the CD spectral characteristics were compared for CT-DNA in the absence and in presence of complexes 3 and 4. Simple groove binding and electrostatic interaction of the complexes with DNA show less or no perturbation on the base stacking and helicity bands while an intercalator enhances the intensities of both bands in complexes 3 and 4 (Fig. 5). This resembles the groove binding with the electrostatic interaction, since the intensity of the positive band is 275 nm, which reflects that the stacking interactions between the DNA bases decrease significantly. The binding of the complexes by disrupting the base stacking locally causes untwisting of the DNA helix. Moreover, the intensity of the DNA negative band (245 nm) increases suggesting the unwinding of the helix. The binding propensity of 3 in comparison with 4 is higher because when 3 is added to CT-DNA at a lower concentration the intensities of both the bands increase, but still the B-Form of DNA is maintained, which can be attributed to a partial intercalative mode of binding.
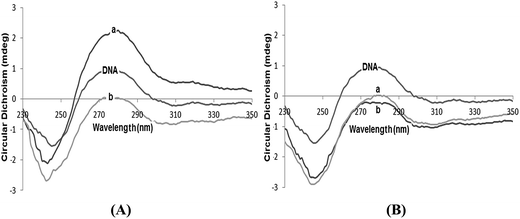 |
| | Fig. 5 The CD spectra of CT-DNA in the absence and presence of (A) complex 3 and, (B) complex 4 in 5 mM Tris–HCl/50 mM NaCl buffer with varying concentrations (a) R = 0.5 and (b) R = 1.0. | |
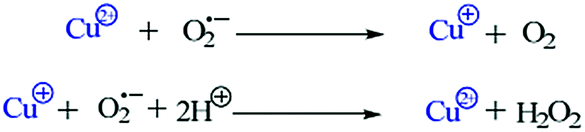
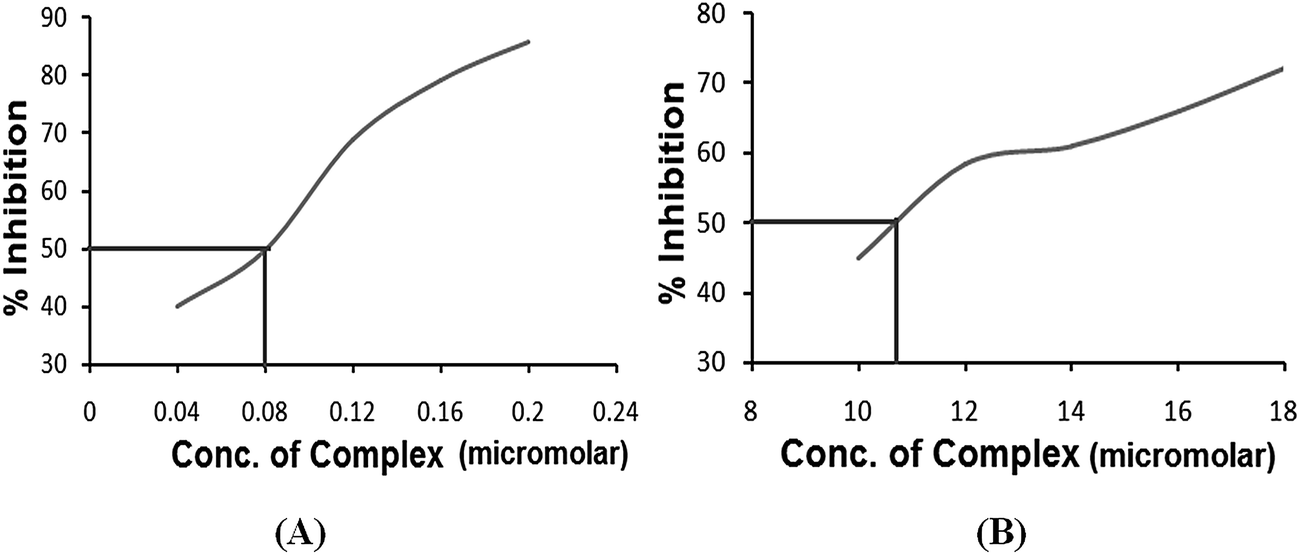
Superoxide dismutase activity. Superoxide dismutase (SOD) is one of the essential enzymes that eliminates superoxide radical anions (O2˙−) and consequently protects cells from damage induced by free radicals. The active O2˙− production and low SOD activity in cancer cells may hinder the malignant cells, as they are highly dependent on SOD for survival and sensitive to inhibition of SOD.28 Therefore, it was interesting to investigate the SOD-like activity of complexes 3 and 4 using a xanthine/xanthine oxidase assay due to their contributive solubility. SOD activity was monitored by the reduction of nitro blue tetrazolium (NBT) with O2˙− generated by the xanthine/xanthine oxidase system. The O2˙− scavenging activity (IC50) of complexes 3 and 4 was determined. The plots of NBT percent inhibition with an increase in the concentration of the complexes are shown in Fig. 6. Both the complexes demonstrated SOD activity in the micromolar range viz., (IC50) 0.08 μM for complex 3 and 12.00 μM for complex 4. Complex 3 possesses higher SOD mimetic activity as indicated by the high activity region of the spectrum. The reaction involves a Cu2+ ion at the active site of the enzyme that causes dismutation of the superoxide anions by redox cycling of the Cu2+ ions. A free radical such as O2˙− binds to the Cu2+ ion and transfers an electron that leads to a reduction of the Cu2+ ion to Cu+. In the second step, this electron is passed from the Cu+ ion back to another superoxide anion that then combines with two protons to make hydrogen peroxide (H2O2).
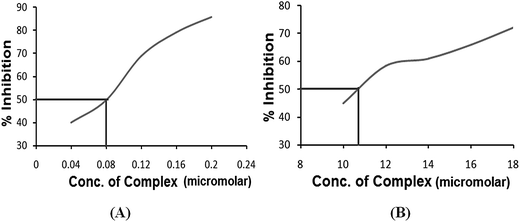 |
| | Fig. 6 The plots of the percentage of NBT inhibition reduction with an increase in the concentration of (A) complex 3 and (B) complex 4. | |
In addition, to ascertain the effectiveness of the present complexes as functional SOD mimics, we compared the IC50 of the complexes with several standard drugs that were previously determined using the NBT assay (Table 1).29,30
Table 1 The SOD activity profiles of complexes 1–4 with native Cu–Zn SOD, as assessed by the NBT assay
| Compounds |
(IC50) (μM) |
Ref. |
| 3 |
0.08 |
This work |
| 4 |
12.01 |
This work |
| [Cu2-(bpzbiap)Cl3] |
0.25 |
30 |
| [Cu(dicl)2·(H2O)]·2H2O |
2.13 |
48a |
| [Cu(3,5-DTBS)4(Eth)4] |
2.69 |
48a |
| CuZn SOD |
0.04 |
31 |
DNA cleavage studies
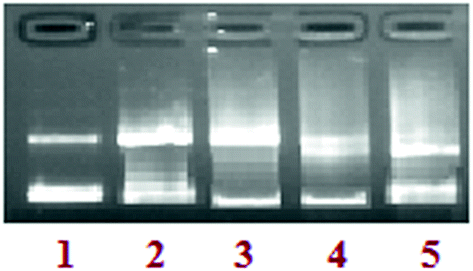
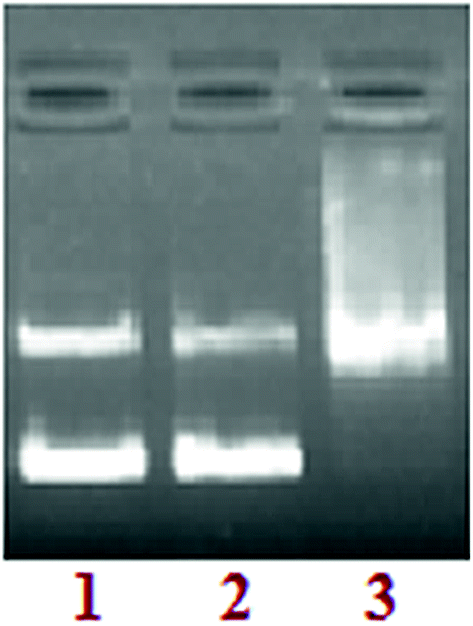
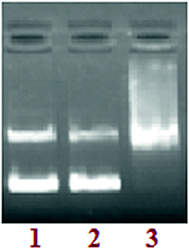
Concentration dependence. In order to explore the ability of complex 3 to cleave DNA, increasing concentrations of the complex with a fixed concentration of the supercoiled (SC) pBR322 DNA were incubated, in the absence of an activator. The pattern suggested the conversion of the supercoiled form (Form I, SC) to the nicked circular form (Form II, NC) with no linear open circular form (Form III, LC) DNA. The electrophoretic pattern observed for complex 3 with the increase in the concentration of the complex (5–25 μM), suggested that plasmid DNA was converted Form I to Form II. Upon the addition of 15 μM of 3, Form I was completely converted to Form II (∼99%). Furthermore, increasing the concentration of 3 to 20 & 25 μM led to characteristic patterns of faded bands ascribed to the presence of an organotin metal core and, thus, providing a measure of the extent of hydrolysis of the phosphodiester bonds of DNA (Fig. 7).
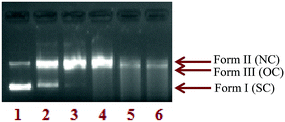 |
| | Fig. 7 The agarose gel electrophoresis results for the cleavage of pBR322 supercoiled DNA (300 ng) in the presence of complex 3 at 310 K after 45 min of incubation; lane 1: DNA control; lane 2: 5 μM of 3 + DNA; lane 3: 10 μM of 3 + DNA; lane 4: 15 μM of 3 + DNA; lane 5: 20 μM of 3 + DNA; lane 6: 25 μM of 3 + DNA. | |
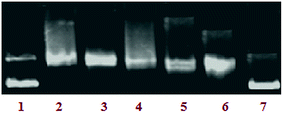
ROS is responsible for cleavage. To predict the mechanism underlying the cleavage of pBR322 DNA by complex 3 in the presence of various radical scavengers such as DMSO and EtOH as OH˙ radical scavengers,31 NaN3 as an 1O2 scavenger,32 and superoxide dismutase (SOD) as a superoxide anion radical (O2˙−) scavenger,33 relative cleavage reactions were carried out (Fig. 8). In the presence of SOD, significant inhibition was observed, thus confirming the participation of superoxide (O2˙). Furthermore, slight inhibition of the DNA cleavage was observed in the other cases viz., NaN3, DMSO, and EtOH, validating the presence of a hydroxyl (OH˙) radical. These results reveal the active role of the superoxide radical as well as the partial involvement of the hydroxyl radical (OH˙) in the DNA strand scission.
 |
| | Fig. 8 The agarose gel electrophoresis results for the cleavage of the pBR322 plasmid supercoiled DNA (300 ng) by complex 3 (5 μM) at 310 K after incubation for 45 min, along with radical scavengers. Lane 1: DNA control; lane 2: 3 + DMSO (0.4 M) + DNA; lane 3: 3 + EtOH (0.4 M) + DNA; lane 4: 3 + NaN3 (0.4 M) + DNA; lane 5: 3 + SOD (15 units) + DNA. | |
DNA groove binding. To probe the potential interacting site of complex 3 with supercoiled pBR322 DNA,32,33 the DNA recognition elements’ minor groove binding agent DAPI and major groove binding agent methyl green were used. The supercoiled pBR322 DNA was treated with DAPI and methyl green prior to the addition of complex 3. The cleavage reaction mediated by complex 3, as shown in Fig. 9, demonstrated that DNA cleavage was significantly repressed in the presence of DAPI (lane 2). However, DNA damage remained unaffected by methyl green (lane 3), suggesting that complex 3 has preferential selectivity towards the minor grooves of the DNA helix.
 |
| | Fig. 9 The agarose gel electrophoresis results for the cleavage of pBR322 plasmid DNA (300 ng) by complex 3 in presence of groove binding agents. Lane 1: DNA control; lane 2: DNA + DAPI (8 μM) + 3; lane 3: DNA + methyl green (2.5 μL of a 0.01 mg mL−1 solution) + 3. | |
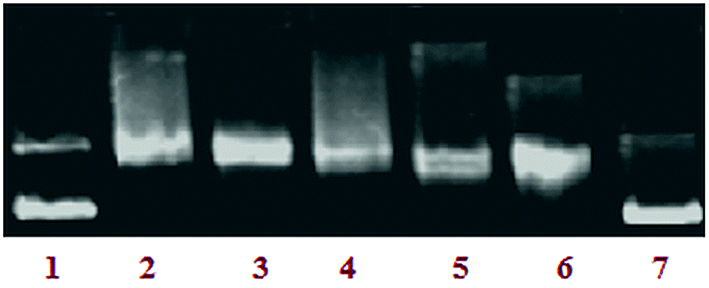
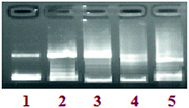
Topoisomerase Iα inhibition. In general, most of the malignant cells (kidney, colon, prostrate, ovary and esophagus) show significantly increased levels of topoisomerases, the isomerase enzymes that act on the topology of DNA and are required for rapid and unconstrained proliferation of cancer cells.34 Topoisomerase inhibitors restrict the proliferation of cancer cells and the cells arrested in division undergo death through apoptosis.35 Therefore, an assay was conducted to investigate the effect of complex 3 on the activity of topoisomerase I. The effect of a drug on the unwinding of a supercoiled (SC) duplex DNA to nicked open circular (NOC) and relaxed (R) DNA can be determined using a topoisomerase Iα inhibition assay. A significant inhibition in a concentration-dependent manner was observed in the activity pattern. On increasing the concentration of complex 3 (5–25 μM), the levels of the relaxed form were inhibited (lanes 3–7) as shown in Fig. 10. More than 85% of the DNA relaxation effect caused by Topo-Iα was inhibited by complex 3 (IC50-20 μM), which showed that complex 3 exhibited potent inhibitory activity towards Topo-Iα which can provide DNA cleavage. The Topo-Iα inhibitory activity of complex 3 was compared with some of the classical Topo-Iα inhibitors, which showed complex 3 to be more efficient in Topo-Iα inhibition than the established Topo-Iα inhibitors (Table 2).36–38
 |
| | Fig. 10 The inhibitory effect of complex 3 on human topoisomerase Iα. Agarose gel electrophoresis patterns present the effect of different concentrations of complex 3 on the action of DNA topoisomerase Iα (Topo-Iα). Lane 1: control DNA; lane 2: Topo-Iα + DNA; lane 3: 5 μM of 3 + DNA + Topo-Iα; lane 4: 10 μM of 3 + DNA + Topo-Iα; lane 5: 15 μM of 3 + DNA + Topo-Iα; lane 6: 20 μM of 3 + DNA + Topo-Iα; lane 7: 25 μM of 3 + DNA + Topo-Iα. | |
Table 2 The inhibitory effect of complex 3 on topoisomerase Iα in pBR322 plasmid DNA in comparison with some established topoisomerase inhibitors
| Complex |
Topo-Iα inhibitory activity (IC50 in μM) |
Ref. |
| Doxorubicin |
>100 |
36 |
| Novobiocin |
>100 |
36 |
| Etoposide |
>1000 |
37 |
| Hoechst 33258 |
30 |
38 |
| 3 |
20 |
This work |
In vitro anticancer activity
Efficient inhibition of the viability of HepG2 cells by complex 3. The cytotoxicity of complexes 3 and 4 on HepG2 hepatocellular carcinoma cells was evaluated in comparison with the extensively used drug cisplatin under identical conditions by adopting the MTT assay. The IC50 value determined for 3 (6.2 ± 0.1 μM at 24 h, Table 3) was found to be significant compared to cisplatin (IC50, 7.23 ± 0.036 μM).39 Because the efficiency with which complex 3 affects the viability of these cancer cells is better than cisplatin, complex 3 is a suitable candidate offering the potential for further investigation as an anticancer drug at the molecular level.
Table 3 In vitro cytotoxicity assay for complexes 3 and 4 against HepG2 human hepatocellular carcinoma cells
| Synthetic complex/standard drug |
IC50 for 24 h (μM) |
| 3 |
6.2 ± 0.10 |
| 4 |
70.0 ± 0.10 |
| Cisplatin |
7.2 ± 0.04 |
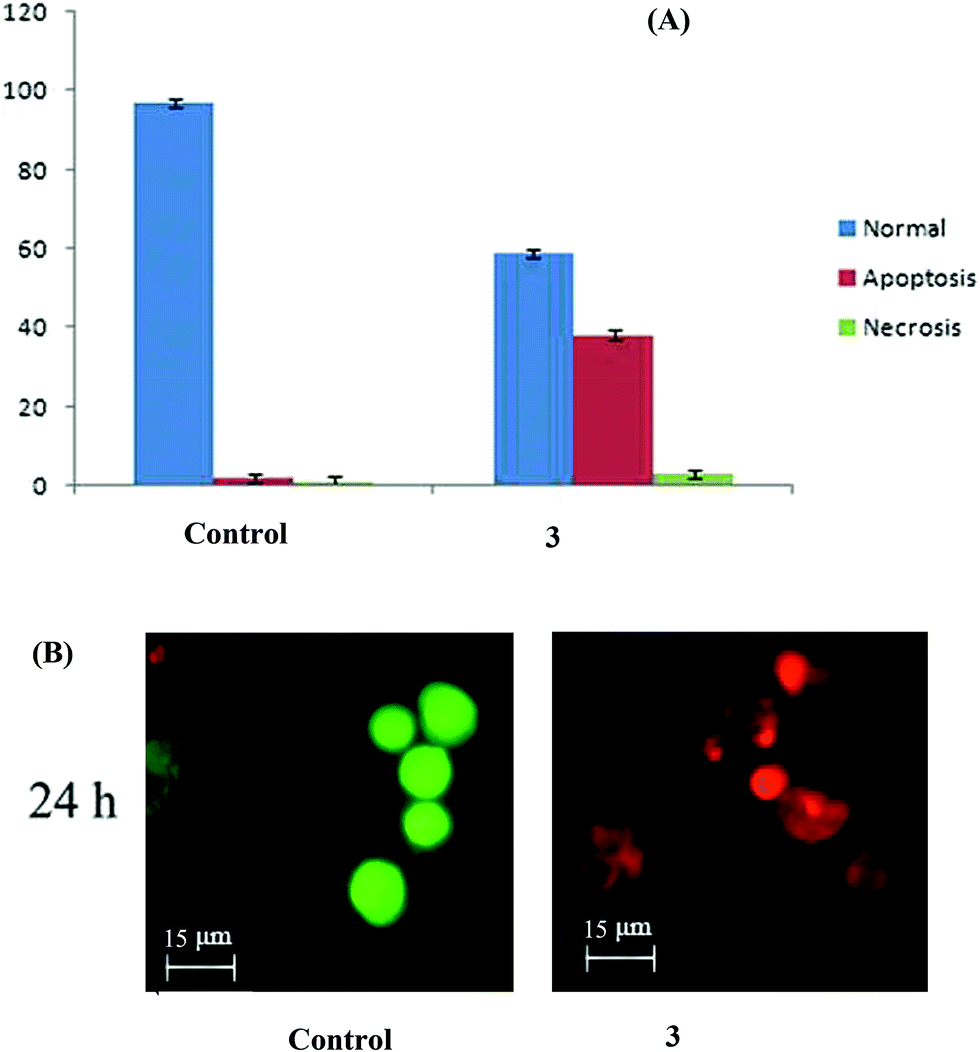
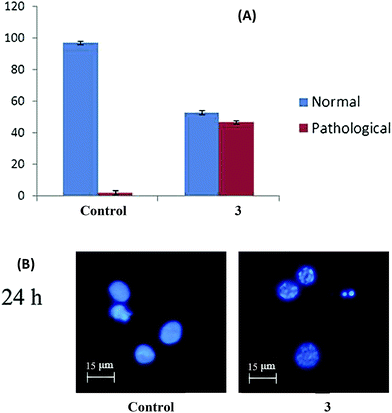
Complex 3 brings about apoptosis greatly and necrosis to a certain extent in HepG2 cells. The results obtained with AO & EB double staining of the control, and treated cells are in Fig. 11. The control cells uniformly green fluoresced and had standard features. Most of the cells treated with complex 3 fluoresced red and indicated apoptotic features such as cell shrinkage, chromatin condensation, nuclear fragmentation and apoptotic body formation40 which could be attributed to the efficient DNA binding and cleavage properties of this bimetallic complex, as discussed vide supra. A few cells indicated necrotic features such as cell swelling and lysis, which could be interpreted as caused due to the complex 3-induced generation of ROS.41 Both apoptosis and necrosis are desired end points in cancer chemotherapy.42
 |
| | Fig. 11 (A) AO/EB staining of the complex 3-induced apoptosis of HepG2 cells. The graph shows the manual count of apoptotic cells as a percentage (data are mean% ± SD% of three experiments). (B) Representative morphological changes observed in HepG2 cells treated with complex 3 by adopting AO/EB staining. | |
Complex 3 affects the integrity of the chromatin of HepG2 cells. Hoechst 33258 staining showed that there were significant changes in the chromatin of treated cells (Fig. 12). In the untreated cells, the chromatin was normal and intact. After treatment with complex 3, changes in the chromatin such as condensation, marginalization, and fragmentation were observed, which are clear indications of the induction of apoptosis,40 the most desired mechanism of cell death in the context of cancer.42
 |
| | Fig. 12 (A) Hoechst 33258 staining of the 3-induced apoptosis of HepG2 cells. The graph shows the manual count of apoptotic cells as a percentage (data are mean% ± SD% of three experiments). (B) Representative morphological changes observed in HepG2 cells treated with complex 3 by adopting Hoechst 33258 staining. | |
Complex 3 affects the mitochondrial transmembrane potential (ΔΨm). Early apoptosis is always accompanied by disruption of the mitochondrial transmembrane potential (ΔΨm), resulting in a rapid collapse of the electrochemical gradient. In this study, we explored the effect of the highly promising complex 3 on ΔΨm using a mitochondrion-specific dye, JC-1. The control cells emitted red fluorescence due to high ΔΨm. The cells treated with complex 3 showed a loss of red J-aggregate fluorescence and retention of only green monomer fluorescence at 24 h due to the loss of ΔΨm (Fig. 13), which is an early event in apoptosis.
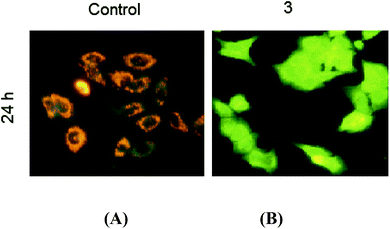 |
| | Fig. 13 The effect of complex 3 on the mitochondrial transmembrane potential in HepG2 cells after 24 h. (A) Untreated; most of the cells have strong J-aggregation (red). (B) Treated; the majority of cells fluoresce green due to low ΔΨm. | |
Conclusion
The results pertaining to the activity of complex 3 [Cu(Van–val)(pz)2Sn(CH3)2(H2O)2] reveals it to be an efficient DNA-cleaving agent through the dual binding mode. Based on the evidence set forth by DNA-damaging agents as potential anticancer agents, the exploration of complex 3 for antitumor activity on human hepatocarcinoma (HepG2) cells revealed that complex 3 induces cell death greatly through apoptosis, and to a certain extent through ROS-mediated necrosis, and effectively when compared to cisplatin. Further exploration of complex 3, including with a few more tumor cell lines and a normal cell, to understand the selectivity and the molecular mechanism underlying cell death can potentially lead to finding a modality for targeted delivery towards tumor cells.
Experimental
Reagents and instruments
All reagents were of the best commercial grade and were used without further purification. L-Valine, O-vanillin, pyrazole, dimethyl tin dichloride, disodium salt of calf thymus DNA (highly polymerized, stored at 4 °C), agarose (Sigma-Aldrich), Tris(hydroxymethyl)aminomethane, CuCl2·2H2O, anhydrous ZnCl2, (E. Merck), and supercoiled pBR322 plasmid DNA (Genei) were used as received. The Schiff base ligand was synthesized by the condensation of L-valine with O-vanillin in a 1:1 ratio with a slight modification of the previously reported procedure.43
The molar conductances were measured at room temperature with a Eutech CON 510 Conductivity Bridge. IR spectra (KBr pellets) in the range of 4000–400 cm−1 were recorded using an Interspec 2020 FTIR spectrometer. The digital polarimeter of JASCO P-1020 (Jasco International Co., Ltd., Tokyo, Japan) with a 10 cm optical length cell at 25 °C was used to measure specific rotation. 1H, 13C, and 119Sn NMR spectra were recorded using a Bruker Avance II 400 NMR spectrometer at 25 °C. The EPR spectrum was performed with a Varian E 112 spectrometer using X-band frequency (9.1 GHz) at LNT in the solid state. The magnetic moment was calculated with a Sherwood Scientific Magnetic Balance MSBAuto. Electronic spectra were recorded using a UV-1700 PharmaSpec UV-vis spectrophotometer (Shimadzu). Electrospray mass spectra were recorded with a Micromass Quattro II triple quadrupole mass spectrometer. Emission spectra were determined with a Shimadzu RF 5301 PC spectrofluorophotometer. Cleavage experiments were performed with the help of Axygen electrophoresis supported by a Genei power supply with a potential range of 50–500 volts, visualized and photographed using a Vilber-INFINITY gel documentation system. Solutions of CT-DNA in buffer gave a ratio of UV absorbance at 260 and 280 nm of ca. 1.9:1, indicating that the DNA was sufficiently free of protein. Absorption spectroscopy determined the DNA concentration per nucleotide with the molar absorption coefficient 6600 dm3 mol−1 cm−1 at 260 nm.44 Circular dichroism spectra of DNA were obtained using a Circular Dichroism (CD) Spectrometer with a Stop Flow-Applied PhotoPhysics Chirascan. All experiments were conducted using a 200 μL quartz cell. Each CD spectrum was collected after averaging over at least 3 accumulations using a scan speed of 100 nm min−1 and a 5 s response time. The machine and cuvette baselines were subtracted, and the resultant spectra were zeroed outside the absorption bands.
Synthesis
Synthesis of [Cu(Van–val)(HPz)2] (1). The monometallic complex 1 was synthesized by adding CuCl2·2H2O [0.170 g, 1 mmol, MeOH (5 mL)] to the Schiff base ligand [0.252 g, 1 mM, in MeOH (5 mL)] and stirring for 0.5 h. To this mixture the secondary ligand, Hpz [0.136 g, 2 mM, MeOH (5 mL)] was added drop-wise and stirred for another 4 h. The green-colored product was isolated, washed with methanol and dried in vacuo. Yield: 85%. m.p. = 276 °C. [α]25D = +28.8 (10−3 M, DMSO). ΛM (1 × 10⁻³ M, DMSO) = 7.4 ohm−1 cm2 mol−1. ESI-MS {in DMSO, +ve, observed (calcd)}: 449.1, (449.0), [C19H23N5O4Cu].
Synthesis of [Zn(Van–val)(HPz)2] (2). The monometallic complex 2 was synthesized adopting the procedure mentioned above for complex 1 except for using anhydrous ZnCl2 (0.136 g, 1 mM). The yellow-colored product was washed with methanol and dried in vacuo. Yield: 80%. m.p. = above 300 °C (decomposed). [α]25D = +28.0 (10−3 M, DMSO). ΛM (1 × 10⁻³ M, DMSO) = 7.9 ohm−1 cm2 mol−1. IR (νmax/cm−1): 1632, 1569, 1306, 748, 551, 440. 1H NMR (400 MHz, DMSO-d6, δ): 8.55 (s, 1H, –HCN imine proton), 7.57 (br, 2H, –NH, Hpz), 7.77–7.76 (d, 4H, Hpz), 7.14–7.12 (m, 2H, Hpz), 6.86–6.76 (m, 2H, phenyl ring), 6.26–6.22 (t, 1H, phenyl ring), 3.37 (s, 1H, N–CH–COO, valine), 3.10 (s, 3H, OCH3, vanillin), 2.51–2.49 (m, 1H, CH–(CH3)2, valine), 0.93–0.76 (m, 6H, CH–(CH3)2, valine). 13C NMR (100 MHz, DMSO-d6, δ): 169.17 (CO), 168.52 (CN), 155.85 (C–OCH3, aromatic carbon), 148.77 (C–O, aromatic carbon), 138.41, 137.72, 127.35 (Hpz, aromatic carbons), 118.25, 114.80, 113.54, 104.20, 103.32, 99.49 (phenyl ring), 76.08 (N–C–COO), 54.29 (OCH3), 48.57 (C–(CH3)2), 18.81, 17.98 (methyl carbons). ESI-MS {in DMSO, +ve, observed (calcd)}: 453.3 (453.8), [C19H23N5O4Zn + 3H+].
Synthesis of [Cu(Van–val)(pz)2Sn(CH3)2(H2O)2] (3). The heterobimetallic complex 3 was prepared by adding a methanolic solution of (CH3)2SnCl2 (0.219 g, 1 mM) (5 mL) to complex 1 (0.470 g, 1 mM) in a 1:1 ratio, drop-wise and stirring for 4 h at ambient temperature. The green-colored product was isolated, washed with methanol and dried in vacuo. Yield: 74%. m.p. = 130 °C (decomposed). [α]25D = +29.2 (10−3 M, DMSO). ΛM (1 × 10⁻³ M, DMSO) = 8.8 ohm−1 cm2 mol−1 for IR (νmax/cm−1): 1628, 1551, 1358, 743, 595, 556, 486, 425. 119Sn NMR (149.19 MHz, DMSO-d6, δ): −592.61. ESI-MS {in DMSO, +ve, observed (calcd)}: 667.0 (667.8), [C21H31N5O6CuSn]·2H2O.
Synthesis of [Zn(Van–val)(pz)2Sn(CH3)2(H2O)2] (4). The heterobimetallic complex 4 was synthesized using the monometallic complex 2, adopting the procedure mentioned for 3. The brown-colored product was isolated, washed with methanol and dried in vacuo. Yield: 82%. m.p. = above 300 °C (decomposed). [α]25D = +28.4 (10−3 M, DMSO). ΛM (1 × 10⁻³ M, DMSO) = 8.4 ohm−1 cm2 mol−1. IR (νmax/cm−1): 1653, 1558, 1317, 739, 593, 554, 482, 431.1H NMR (400 MHz, DMSO-d6, δ): 8.09 (s, 1H, –HCN imine proton), 7.53–7.51 (d, 4H, Hpz), 7.16–7.11 (m, 2H, Hpz), 6.98–6.79 (m, 3H, phenyl ring), 4.20 (s, 1H, N–CH–COO, valine), 3.77 (s, 3H, OCH3, vanillin), 2.52–2.50 (m, 1H, CH–(CH3)2, valine), 1.10 (s, 6H, –(CH3)2Sn), 1.08–0.98 (m, 6H, CH–(CH3)2, valine). 13C NMR (100 MHz, DMSO-d6, δ): 176.18 (CO), 175.81 (CN), 156.83 (C–OCH3, aromatic carbon), 150.99 (C–O, aromatic carbon), 136.04–126.90 (Hpz, aromatic carbon), 118.34, 117.69, 117.16, 114.23, 110.45, 103.28 (phenyl ring), 70.91 (N–C–COO), 55.42 (OCH3), 34.32 [C–(CH3)2], 21.62, 19.82 (methyl carbons of valine), 18.91, 17.70 [–(CH3)2Sn]. 119Sn NMR (149.19 MHz, DMSO-d6, δ): −580.86. ESI-MS {in DMSO, +ve, observed (calcd)}: 653.1 (653.6), [C21H31N5O6ZnSn + 2H·H2O].
DNA binding and cleavage studies
DNA binding experiments that included absorption spectral studies, fluorescence, circular dichroism, DNA cleavage and a topoisomerase inhibition assay conformed to the standard methods45–47 and practices previously adopted by our laboratory.48–50 Standard error limits were estimated using all data points.
Measurement of SOD-like activity
Superoxide dismutase (SOD)-like activity was investigated using Beauchamp and Fridovich’s method, as improved by Imanari et al.51 This method is based on the inhibitory effect of SOD on the reduction of nitro blue tetrazolium (NBT) by the O2˙− generated by the xanthine/xanthine oxidase system. The assay was carried out in the assay buffer containing 50 mM Tris–HCl, pH = 8.0, 0.1 mM DTPA and 0.1 mM hypoxanthine. The radical detector consisted of a tetrazolium salt and was diluted with assay buffer. Similarly, the solutions of SOD standards and xanthine oxidase were prepared in a sample buffer consisting of 50 mM Tris–HCl, pH 8.0. All the complexes were dissolved in DMSO and the absorbance was reported for each set of concentrations at 15 minute intervals. Results were graphed as the % inhibition of NBT reduction taken at various concentrations (0.04–0.20 μM) for each of the studied complexes. The IC50 values are reported as equivalent concentrations (μM) to 1 U bovine erythrocyte superoxide dismutase (native SOD).
Anticancer activity studies
MTT assay. Complex 3 was dissolved in DMSO, diluted in a culture medium and used to treat HepG2 hepatocellular carcinoma cells, in 96 well culture plates, over a complex concentration of 10 to 100 μM for a period of 24 h. Cisplatin was used as the reference drug and DMSO was used as the solvent control. A miniaturized viability assay using 3-(4,5-di-methyithiazol-2-yl)-2,5-diphenyl-2H-tetrazolium bromide (MTT) was carried out according to the method described by Mosman.52 The cells were assayed by the addition of 20 μL of the MTT solution (5 mg μL−1) prepared in phosphate-buffered saline (PBS). The plates were wrapped in aluminum foil and incubated for 4 h at 37 °C. The purple formazan product was dissolved by the addition of 100 μL of 100% DMSO to each well. The absorbance was monitored at 570 nm (measurement) and 630 nm (reference) using a 96 well plate reader (Bio-Rad, Hercules, CA, USA). Data were collected for duplicates and used to calculate the respective means.The percentage inhibition was calculated from this data using the formula:
The IC50 value was determined as the concentration of the complex/cisplatin that is required to decrease the absorbance to half that of the control.
Acridine orange (AO) and ethidium bromide (EB) staining. The HepG2 cells were seeded in 6-well plates and allowed to reach 80% confluence. The cells were then treated with the IC50 concentration of complex 3 and incubated for 24 h. The cells were trypsinized and pelleted and then suspended in PBS. A drop of the cell suspension was placed on a glass slide and stained with AO and EB (1% in PBS, separately; mixed in a 1:1 ratio) (Sigma Chemical Co., St. Louis, MO, USA), and a cover slip was laid over it to reduce light diffraction.53 At random, 300 cells were observed in a fluorescent microscope (Carl Zeiss, Jena, Germany) fitted with a 377–355 nm filter and examined at 400× magnification. The percentage of cells reflecting pathological changes was calculated.
Hoechst 33258 staining. The suspension of HepG2 cells from previous section was also stained with Hoechst 33258 (Sigma Chemical Co., St. Louis, MO, USA) and incubated at 37 °C for 15 min.53 At random, 300 cells were observed with the fluorescent microscope at ×400 magnification and the percentage of cells reflecting pathological changes was calculated.
Mitochondrial transmembrane potential (ΔΨm) measurement. The mitochondrial transmembrane potential, (ΔΨm), is a vital parameter of mitochondrial function that is used as a sign of cell health. JC-1 (5,5′,6,6′-tetrachloro-1,1′,3,3′-tetraethylbenzimidazolcarbocyanine iodide) is a lipophilic, cationic dye that can selectively go into the mitochondria and reversibly change color from green to red, due to aggregation, as ΔΨm increases, and the opposite happens when ΔΨm decreases. The HepG2 cells were grown on glass coverslips placed in 6-well plates and treated with the IC50 concentration of complex 3. The cells were stained with JC-1 dye (Sigma Chemical Co., St. Louis, MO, USA) prepared as stock in DMSO and made into a working solution by diluting it in a culture medium, after 12 h.54 The mitochondrial depolarization patterns of the cells were observed under the fluorescent microscope at ×400 magnification and the percentage of cells reflecting pathological changes was calculated.
Acknowledgements
The authors are grateful to DBT (Scheme no. BT/PR6345/MED/14/784/2005), the DST–PURSE Programme and DRS-1 (SAP) from UGC, New Delhi, India, for the financial support. Ahmad Asim is grateful to UGC for the BSR fellowship. The NMR and ESI-MS facilities of SAIF, Panjab University, Chandigarh; the Elemental Analysis facility of STIC, Cochin; the EPR studies by SAIF, IIT, Mumbai; and the CD facility of AIRF, JNU, New Delhi, are gratefully acknowledged. The Doerenkamp-Zbinden Foundation, Switzerland, is thanked for establishing the in vitro toxicology facility at MGDC, Bharathidasan University, Tiruchirappalli.
References
- F. Arjmand, F. Sayeed, S. Parveen, S. Tabassum, A. S. Juvekar and S. M. Zingde, Dalton Trans., 2013, 3390 RSC.
- ACS, Global cancer facts and figures 2007, American Cancer Society, Atlanta, GA, 2007 Search PubMed.
- T. O. Callaghan, Nature, 2011, 471, S2–S4 CrossRef PubMed.
-
(a) J. L. Alonso-Romero and A. Piñero-Madrona, World J. Obstet. Gynecol., 2013, 2, 21 CrossRef;
(b) S. Bhattacharyya and M. Dixit, Dalton Trans., 2011, 6112 RSC.
- I. Vergote, C. G. Trope, F. Amant, G. B. Kristensen, T. Ehlen, N. Johnson and N. S. Reed, N. Engl. J. Med., 2010, 363, 943 CrossRef CAS PubMed.
- World Health Organization, World Cancer Report 2014, 2014, Ch. 1.1, ISBN 9283204298 Search PubMed.
- V. Laquintana, A. Trapani, N. Denora, F. Wang, J. M. Gallo and G. Trapani, Expert Opin. Drug Delivery, 2009, 6, 1017 CrossRef CAS PubMed.
- A. Hordyjewska, L. Popiołek and J. Kocot, BioMetals, 2014, 27, 611 CrossRef CAS PubMed.
- G. M. Tozer, C. Kanthou, G. Lewis, V. E. Prise, B. Vojnovic and S. A. Hill, Br. J. Radiol., 2008, 81, S12–S20 CrossRef CAS PubMed.
- K. G. Daniel, D. Chen, S. Orlu, Q. C. Cui, F. R. Miller and Q. P. Dou, Breast Cancer Res., 2005, 7, R897 CrossRef CAS PubMed.
-
(a) Metallotherapeutic Drugs and Metal Based Diagnostic Agents. The Use of Metals in Medicine, ed. M. Gielen and E. R. T. Tiekink, J. Wiley & Sons, 2005, pp. 421–439 Search PubMed;
(b) R. A. Khan, S. Yadav, Z. Hussain, F. Arjmand and S. Tabassum, Dalton Trans., 2014, 2534 RSC.
- M. Nath and P. K. Saini, Dalton Trans., 2011, 7077 RSC.
-
(a) A. Terenzi, R. Bonsignore, A. Spinello, C. Gentile, A. Martorana, C. Ducani, B. Högberg, A. M. Almerico, A. Lauria and G. Barone, RSC Adv., 2014, 4, 33245 RSC;
(b) E. Sundaravadivel, S. Vedavalli, M. Kandaswamy, B. Varghese and P. Madankumar, RSC Adv., 2014, 4, 40763 RSC;
(c) F. Arjmand, M. Muddassir, Y. Zaidi and D. Ray, Med. Chem. Commun., 2013, 4, 394 RSC;
(d) Y. Zaidi, F. Arjmand, N. Zaidi, J. A. Usmani, H. Zubair, K. Akhtar, M. Hossain and G. G. H. A. Shadab, Metallomics, 2014, 6, 1469 RSC.
- S. Bhattacharyya, D. Ghosh, A. Endo, K. Shimizu, T. J. R. Weakley and M. Chaudhury, J. Chem. Soc., Dalton Trans., 1999, 3859 RSC.
- J. C. Pessoa, M. J. Calhorda, I. Cavaco, P. J. Costa, I. Correia, D. Costa, L. F. Vilas-Boas, V. Félix, R. D. Gillard, R. T. Henriquesa and R. Wiggins, Dalton Trans., 2004, 2855 RSC.
- S. Tabassum, S. Amir, F. Arjmand, C. Pettinari, F. Marchetti, N. Masciocchi, G. Lupidi and R. Pettinari, Eur. J. Med. Chem., 2013, 60, 216 CrossRef CAS PubMed.
-
(a) F. Marchetti, C. Pettinari, A. Cingolani, R. Pettinari, M. Rossi and F. Caruso, J. Organomet. Chem., 2002, 64, 5134 Search PubMed;
(b) M. A. Affan, Y. Z. Liew, F. B. Ahmad, M. B. Shamsuddin and B. M. Yamin, Indian J. Chem., Sect. A: Inorg., Phys., Theor. Anal., 2007, 46, 1063 Search PubMed.
- F. Caruso, D. Leonesi, F. Marchetti, E. Rivarola, M. Rossi, V. Tomov and C. Pettinari, J. Organomet. Chem., 1996, 51, 929 Search PubMed.
- C. Pettinari, F. Caruso, N. Zaffaroni, R. Villa, F. Marchetti, R. Pettinari, C. Phillips, J. Tanski and M. Rossi, J. Inorg. Biochem., 2006, 100, 58 CrossRef CAS PubMed.
-
(a) P. F. Rapheal, E. Manoj and M. R. P. Kurup, Polyhedron, 2007, 26, 818 CrossRef CAS;
(b) A. C. Mot, S. A. Syrbu, S. V. Makarov, G. Damian and R. S. Dumitrescu, Inorg. Chem. Commun., 2012, 18, 1 CrossRef CAS.
-
(a) E. Kikuta, M. Murata, N. Katsube, T. Koike and E. Kimura, J. Am. Chem. Soc., 1999, 121, 5426 CrossRef CAS;
(b) R. S. Kumar and S. Arunachalam, Eur. J. Med. Chem., 2009, 44, 1878 CrossRef CAS PubMed;
(c) S. Tabassum, R. A. Khan, F. Arjmand, A. S. Juvekar and S. M. Zingde, Eur. J. Med. Chem., 2010, 45, 4797 CrossRef CAS PubMed;
(d) M. Chauhan and F. Arjmand, J. Organomet. Chem., 2007, 692, 5156 CrossRef CAS.
-
(a) X. Dong, X. Wang, M. Lin, H. Sun, X. Yang and Z. Guo, Inorg. Chem., 2010, 49, 2541 CrossRef CAS PubMed;
(b) A. Jain, J. Wang, E. R. Mashack, B. S. J. Winkel and K. J. Brewer, Inorg. Chem., 2009, 48, 9077 CrossRef CAS PubMed;
(c) P. de Hoog, C. Boldron, P. Gamez, K. Sliedregt-Bol, I. Roland, M. Pitie, R. Kiss, B. Meunier and J. Reedijk, J. Med. Chem., 2007, 50, 3148 CrossRef CAS PubMed.
- F. Arjmand, A. Jamsheera, M. Afzal and S. Tabassum, Chirality, 2012, 24, 977 CrossRef CAS PubMed.
- C. Tong, Z. Hu and W. Liu, J. Agric. Food Chem., 2005, 53, 6207 CrossRef CAS PubMed.
- G. Han and P. Yang, J. Inorg. Biochem., 2002, 91, 230 CrossRef CAS PubMed.
- K. Karidi, A. Garoufis, A. Tsipis, N. Hadjiliadis, H. den Dulk and J. Reedijk, Dalton Trans., 2005, 1176 RSC.
- P. T. Selvi and M. Palaniandavar, Inorg. Chim. Acta, 2002, 337, 420 CrossRef CAS.
- P. Huang, L. Feng, E. A. Oldham, M. J. Keating and W. Plunkett, Nature, 2000, 407, 390 CrossRef CAS PubMed.
- G. Tabbi, W. L. Driessen, J. Reedijk, R. P. Bonomo, N. Veldman and A. L. Spek, Inorg. Chem., 1997, 36, 1168 CrossRef CAS PubMed.
- J. E. Weder, C. T. Dillon, T. W. Hambley, B. J. Kennedy, P. A. Laya, J. R. Biffin, H. L. Regtop and N. M. Davies, Coord. Chem. Rev., 2002, 232, 95 CrossRef CAS.
-
(a) C. A. Detmer III, F. V. Pamatong and J. R. Bocarsly, Inorg. Chem., 1997, 36, 3676 CrossRef PubMed;
(b) M. S. Melvin, M. W. Calcutt, R. E. Noftle and R. A. Manderville, Chem. Res. Toxicol., 2002, 15, 742 CrossRef CAS PubMed.
- C. J. Burrows and J. G. Muller, Chem. Rev., 1998, 98, 1109 CrossRef CAS PubMed.
- B. Selvakumar, V. Rajendiran, P. U. Maheswari, H. S. Evans and M. Palaniandavar, J. Inorg. Biochem., 2006, 100, 316 CrossRef CAS PubMed.
- L. F. Chin, S. M. Kong, H. L. Seng, K. S. Khoo, R. Vikneswaran, S. G. Teoh, M. Ahmad, S. B. A. Khoo, M. J. Maah and C. H. Ng, J. Inorg. Biochem., 2011, 105, 339 CrossRef CAS PubMed.
- B. Montaner, W. C. Ávila, M. Martinell, R. Öllinger, J. Aymami, E. Giralt and R. P. Tomas, Toxicol. Sci., 2005, 85, 870 CrossRef CAS PubMed.
- K. Suzuki and M. Uyeda, Biosci., Biotechnol., Biochem., 2002, 66, 1706 CrossRef CAS PubMed.
- K. Suzuki, F. Shono and M. Uyeda, Biosci., Biotechnol., Biochem., 1998, 62, 2073 CrossRef CAS PubMed.
- B. Bielawski, A. Bielawski, T. Anchim and S. Wolczynski, Biol. Pharm. Bull., 2005, 28, 1004 Search PubMed.
- S. A. S. Sakinah, S. T. Handayani and L. P. A. Hawariah, Cancer Cell Int., 2007, 7, 1 CrossRef PubMed.
- R. S. Wong, J. Exp. Clin. Cancer Res., 2011, 30, 87 CrossRef CAS PubMed.
- K. Choi, J. Kim, G. W. Kim and C. Choi, Curr. Neurovasc. Res., 2009, 6, 213 CrossRef CAS PubMed.
- M. V. Jain, A. M. Paczulla, T. Klonisch, F. N. Dimgba, S. B. Rao, K. Roberg, F. Schweizer, C. Lengerke, P. Davoodpour, V. R. Palicharla, S. Maddika and M. Łos, J. Cell. Mol. Med., 2013, 17, 12 CrossRef CAS PubMed.
-
(a) G. Wang and J. C. Chang, Synth. React. Inorg. Met.-Org. Chem., 1994, 24, 623 CrossRef CAS;
(b) S. Tabassum, A. Asim, R. A. Khan, Z. Hussain, S. Srivastav, S. Srikrishna and F. Arjmand, Dalton Trans., 2013, 16749 RSC.
- J. Marmur, J. Mol. Biol., 1961, 3, 208 CrossRef CAS.
- M. E. Reichmann, S. A. Rice, C. A. Thomas and P. Doty, J. Am. Chem. Soc., 1954, 76, 3047 CrossRef CAS.
- A. Wolfe, G. H. Shimer and T. Meehan, Biochemistry, 1987, 26, 6392 CrossRef CAS PubMed.
- J. R. Lakowicz and G. Weber, Biochemistry, 1973, 12, 4171 CrossRef CAS PubMed.
-
(a) S. Tabassum, M. Zaki, M. Afzal and F. Arjmand, Dalton Trans., 2013, 10029 RSC;
(b) S. Tabassum, A. Asim, F. Arjmand, M. Afzal and V. Bagchi, Eur. J. Med. Chem., 2012, 58, 308 CrossRef CAS PubMed;
(c) S. Tabassum, W. M. Al-Asbahy, M. Afzal, F. Arjmand and V. Bagchi, Dalton Trans., 2012, 4955 RSC.
-
(a) R. A Khan, A. Asim, R. Kakkar, D. Gupta, V. Bagchi, F. Arjmand and S. Tabassum, Organometallics, 2013, 32, 2546 CrossRef;
(b) M. Chauhan, K. Banerjee and F. Arjmand, Inorg. Chem., 2007, 30, 3072 CrossRef PubMed.
-
(a) F. Arjmand and M. Muddassir, Chirality, 2011, 23, 250 CrossRef CAS PubMed;
(b) S. Tabassum, S. Mathur, F. Arjmand, K. Mishra and K. Banerjee, Metallomics, 2012, 4, 205 RSC.
- C. Beauchamp and I. Fridovich, Anal. Biochem., 1971, 44, 276–287 CrossRef CAS PubMed.
- T. Mosmann, J. Immunol. Methods, 1983, 65, 55 CrossRef CAS PubMed.
- D. L. Spector, R. D. Goldmann and L. A. Leinwand, Cell: A Laboratory Manual; Culture and Biochemical Analysis of Cells, Cold Spring Harbor Laboratory Press, Cold Spring Harbor, New York, 1998, vol. 1, pp. 34.1–34.9 Search PubMed.
- S. Salvioli, A. Ardizzonim, C. Franceschi and A. Cossarizza, FEBS Lett., 1997, 411, 77 CrossRef CAS PubMed.
Footnote |
| † Electronic supplementary information (ESI) available: The ESI-MS, EPR, UV-vis, fluorescence spectra of the complexes (Fig. S1–S6). See DOI: 10.1039/c5ra07333b |
|
| This journal is © The Royal Society of Chemistry 2015 |
Click here to see how this site uses Cookies. View our privacy policy here.