Gate capacitance model for the design of graphene nanoribbon array field-effect transistors
Myungwoo Sona,
Hangil Kia,
Kihyeun Kima,
Sunki Chunga,
Woong Lee*b and
Moon-Ho Ham*a
aCenter for Emerging Electronic Devices, Department of Nanobio Materials and Electronics, School of Materials Science and Engineering, Gwangju Institute of Science & Technology, Gwangju 500-712, Republic of Korea. E-mail: mhham@gist.ac.kr; Tel: +82 62 7152321
bSchool of Materials Science and Engineering, Changwon National University, Changwon, Gyeongnam 641-773, Republic of Korea. E-mail: woonglee@changwon.ac.kr; Tel: +82 55 2133697
First published on 16th June 2015
Abstract
In graphene nanoribbon (GNR) array field-effect transistors with sufficiently narrow ribbon widths and ribbon-to-ribbon distances, the gate capacitance and relevant carrier mobility are strongly affected by fringe field effects at the ribbon edges and the fringe fields between neighboring GNRs may overlap. To overcome the difficulties of predicting the channel properties of GNR array devices in design and characterization and of extracting accurate carrier mobility with complex fringe field effects, a simplified model for the prediction of gate capacitances in the GNR array channels of field-effect devices was developed. Numerical analyses were carried out, first, using the finite element method to understand how the gate capacitance of the GNR array channel is affected by changes in the configuration of the GNR arrays and the choice of gate dielectrics. Based on this analysis, a general model for determining the gate capacitance as a function of various configurations and material variables was formulated. This model was verified by performing additional finite element analyses and by making comparisons with previously reported experimental results. Good agreement among this data implies the generality of this model.
Introduction
Graphene has drawn significant interest as a potential alternative to silicon, which is used in current complementary metal-oxide-semiconductor (CMOS) technologies, for nanoelectronic applications, because of its extraordinary electronic properties, including high carrier mobility and tunable bandgap.1–3 A two-dimensional monolayer graphene sheet intrinsically has a zero bandgap. It is, therefore, necessary to open and tune its bandgap by techniques including hydrogenation,4 doping,5 and lithographic patterning6–8 for use in device applications. Among these methods, patterning the graphene into nanoribbons with sub-10 nm widths was suggested as a promising strategy based on ab initio calculations9,10 and was verified experimentally.6–8,11,12 In these experiments, the bandgap scaled inversely with ribbon width because of quantum confinement. Theoretical predictions show that field-effect transistors (FETs) employing graphene nanoribbons (GNRs) as a channel material can meet the requirements of next-generation devices.3 The recent development of techniques used to achieve high-density aligned GNR arrays13–15 may allow the creation of wafer-scale devices based on GNRs.Understanding the key factors affecting carrier mobility in graphene is important for gauging and improving the performance of graphene-based electronic devices. Although the mobility in graphene sheets is extremely high, it decreases with decreasing ribbon width in GNRs.3 In general, the scaling of the dimensions of a material causes a change in carrier transport, resulting from charge redistribution and edge/boundary scattering, thus affecting the mobility. The reduction of mobility in GNRs is mainly due to edge scattering and fringe field effects at the ribbon edges.9,16 Particularly in GNR arrays, because both the ribbon width and the distance between GNRs are small, the fringe fields of individual GNRs may overlap (which does not occur for a single GNR). Consequently, complex fringe fields influencing the device performance will depend on both the channel dimensions such as ribbon width and ribbon-to-ribbon distance and the kind and thickness of the gate insulators.
Because the fringe field effect causes changes in the gate capacitance, and thus, the field-effect mobility of the GNR array channels, it is necessary to understand systematically how the gate capacitance changes with different configurations of GNR arrays when designing two-dimensional field-effect devices and extracting accurate carrier mobility. However, as yet, no general model is available to describe the effect of fringe fields on the gate capacitance because of the complex interference between fringe fields of individual GNRs in the array. Therefore, this study aims to develop a simple general model to predict the changes in the gate capacitance with different configurations and dimensions of GNR arrays and different kinds of gate insulator materials. Finite element (FE) analyses were carried out first; the results were summarized in a formula, which is a general capacitance model. The generality of this capacitance model has been verified with additional FE calculations and comparison with the experimental results in the literature.
Numerical modeling
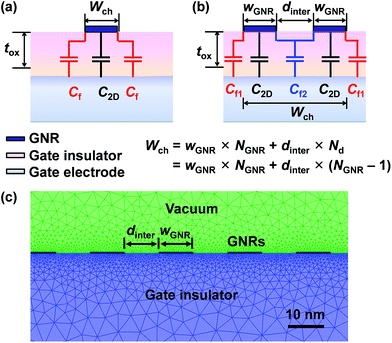
For a single GNR channel, the fringe effect of the GNR can significantly affect the gate capacitance as the width of the GNR becomes sufficiently narrower than the thickness of the dielectric layer. In such a case, the effective gate capacitance, Ctot, of a single GNR channel consists of the fringe capacitance, Cf, and the parallel plate capacitance of the GNR, C2D, as schematically illustrated in Fig. 1(a). Using the equivalent circuit representation, Ctot can be estimated via a semi-empirical model:17
 | (1) |
Results and discussion
Numerical results
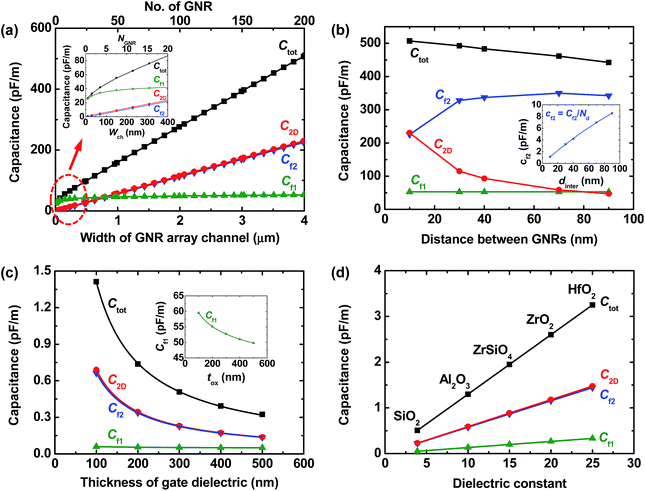
First, the effect of the geometric variables on the capacitances was investigated. Fig. 2(a) shows the changes in the component capacitances and total capacitance for different widths of GNR array channel, Wch. In this case, the gate dielectric was assumed to be a 300 nm-thick SiO2 layer. wGNR and dinter are both fixed at 10 nm; therefore, an increase in Wch corresponds to an increase in the number of GNRs within the channel, NGNR, and an increase in the number of inter-GNR trench regions, Nd = NGNR − 1. Both C2D and Cf2 increase linearly with increasing Wch = NGNR. On the other hand, the change in Cf1 with different values of Wch appears to be logarithmic. Cf1 increases relatively rapidly only for small values of Wch (smaller than roughly 50 nm (inset of Fig. 2(a))); thereafter, the rate of increase becomes smaller with increasing Wch. Consequently, Ctot is mainly influenced by C2D and Cf2, whereas the effect of Cf1 is limited, especially for large values of Wch.Fig. 2(b) shows the changes in the capacitances for different values of dinter. In this case, Wch and wGNR were fixed at 4 μm and 10 nm, respectively, and only dinter was varied. Therefore, as dinter increases, NGNR (and also Nd) will decrease. In this case, Cf1 remains practically constant, regardless of the value of dinter. Together with the results in Fig. 2(a), this result indicates that Cf1 is primarily dependent on Wch. Cf2 increases with increasing dinter and then decreases after reaching a maximum at dinter = 70 nm. Additionally, the average inner fringe capacitance or inner fringe capacitance per inter-GNR trench, cf2 (Cf2 divided by Nd), increases at a constantly decreasing rate as dinter increases (inset of Fig. 2(b)). On the contrary, C2D decreases with increasing dinter because a larger dinter value implies a smaller area fraction of GNR region for a fixed value of Wch – in fact, the C2D values in Fig. 2(b) divided by NGNR = Nd + 1 are almost constant. This result shows that the parallel plate capacitance of the GNR itself is independent of the channel geometry, unless Wch is very small. As in the relation of Wch and Ctot in Fig. 2(a), when dinter varies, Ctot is mainly influenced by C2D and Cf2.
Next, the material aspect of the changes in the capacitances is considered. When the thickness of the gate dielectric, tox, is varied for the SiO2 gate dielectric and the GNR array consists of 200 GNRs with wGNR = 10 nm and dinter = 10 nm, the FEM predicts that all of the capacitance components will decrease as a power of tox, as shown in Fig. 2(c). In this case, while the exponents for C2D and Cf2 seem to be almost identical, that for Cf1 is significantly smaller (inset of Fig. 2(c)). Thus, Ctot is again shown to be mainly affected by C2D and Cf2. If the SiO2 is replaced by an insulator material that has a higher dielectric constant and fixing tox at 300 nm for the same GNR array geometry, the FEM predicts that all of the capacitance components will increase linearly with the increasing dielectric constant, as shown in Fig. 2(d). That is, everything else being equal, the capacitances are affected only by the non-geometric parameter and the capacitances are proportional to the dielectric constant of the gate insulators.
Simplified capacitance model
Based on the numerical results shown in Fig. 2, the component capacitances – the parallel plate capacitance, C2D, the outermost fringe capacitance, Cf1, and the inner fringe capacitance, Cf2 – can now be described as functions of design variables in the formulations that follow. First, C2D, which is the capacitance of the GNR body itself, is predicted to be proportional to wGNR × NGNR – the total area of the GNRs – as seen in Fig. 2(a) and (b). It is, therefore, expressed as| C2D = a0 × wGNR × NGNR | (2) |
Next, the outermost fringe capacitance, Cf1, is logarithmically proportional to the total channel width, as seen in Fig. 2(a). This capacitance is expressed as
Cf1 = a1 + b1 × ln![[thin space (1/6-em)]](https://www.rsc.org/images/entities/char_2009.gif) Wch = a1 + b1 × ln(wGNR × NGNR + dinter × Nd) Wch = a1 + b1 × ln(wGNR × NGNR + dinter × Nd)
| (3) |
Finally, the average inner fringe capacitance, cf2 = Cf2/Nd, resulting from the overlap of the fringe fields of two neighboring GNRs, increases with the ribbon-to-ribbon distance, as shown in the inset of Fig. 2(b), yielding the relation:
| cf2 = Cf2/Nd = a2 × dinter + b2 × dinter2 | (4) |
In addition, all of the capacitance components are given by powers of tox for a given gate dielectric material (Fig. 2(c)); they show a linear dependence on εr for a given value of tox (Fig. 2(d)).
By fitting the numerical results to the formulae presented above with some trial and error, constants a0 through b2 and the exponents of the base tox were obtained. Subsequently, a simplified capacitance model formula for the total capacitance, Ctot, was derived:
 | (5) |
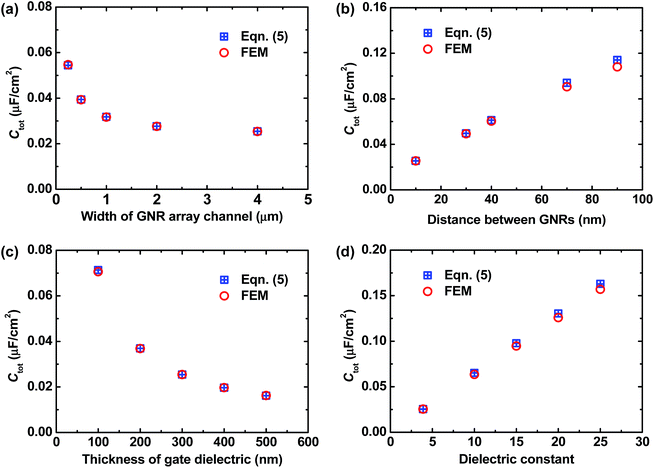
For simplicity, in this formula, the constant, 0.7, the coefficients, 0.03 and 1.25 × 10⁻⁶, and the exponents, 1.0 and 0.1, of the base tox, are chosen to be round numbers of the actual fitting parameters. Therefore, using eqn (5) to predict the gate capacitance may generate small errors. To assess whether the errors are acceptable, the Ctot values were calculated using eqn (5) and then compared to the FE solutions in Fig. 2, in terms of capacitance per unit area (square centimeter). As shown in Fig. 3, the total gate capacitances predicted using eqn (5) and FEM well coincide with tiny errors of 1.3 ± 1.8%, and therefore, the use of round numbers in place of the actual fitting parameters in eqn (5) is justified.
 | ||
| Fig. 3 Comparison of total gate capacitances predicted using eqn (5) and FEM, for GNR array channels with: (a) different widths of GNR array channels, (b) different distances between GNRs, (c) different thicknesses of gate dielectrics, and (d) different dielectric constants of the gate dielectric. The accuracy of the fitting coefficients and parameters in the simplified capacitance model of eqn (5) was assessed. | ||
Verification of the simplified capacitance model
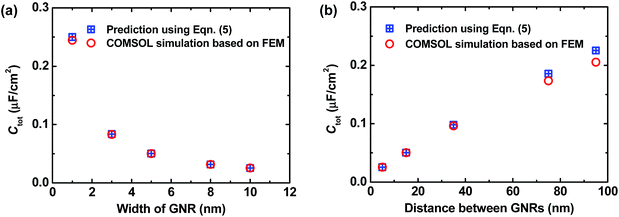
In each numerical analysis to obtain the capacitance models of eqn (2)–(5), the component capacitances were described as functions of a single design variable while the other variables were fixed. One may, therefore, question the generality of the simplified capacitance model. To verify whether the use of eqn (5) can be extended to other cases beyond those considered for Fig. 2 to derived itself, additional FEM simulations were carried out to obtain Ctot for the two cases of: (i) combinations of changing wGNR and dinter with wGNR + dinter = 20 nm and a fixed Wch value of 4 μm, and (ii) changing dinter with a fixed wGNR value of 5 nm and a fixed Wch value of 4 μm. At the same time, eqn (5) was used to calculate Ctot for these cases. Although these two additional cases had not been considered to derived eqn (5), once the Ctot values were calculated using eqn (5), the results agreed well with the FEM simulation results as shown in Fig. 4(a) and (b). This demonstrates that eqn (5) have general applicability. | ||
| Fig. 4 Comparison of total gate capacitances of GNR array channels for: (a) different widths of GNR and (b) different distances between GNRs. These two cases were not considered in the derivation of eqn (5). However, the total capacitances predicted using eqn (5) agree well with the FEM simulation results, demonstrating the generality of the simplified capacitance model of eqn (5). | ||
The generality of eqn (5) was further evaluated by comparing the field-effect mobilities, μFE, reported in the literature13,17 and the predicted μFE values based on the Ctot values estimated using eqn (5). As shown in Table 1, the mobilities predicted via eqn (5) are in good agreement with the previously reported values. In the last row in Table 1, there is a large discrepancy between the reported and predicted mobilities. In this case, the reported value was obtained without considering the effect of the fringe fields.18 Such a marked difference is a clear indication that the fringe field has a significant effect on the total gate capacitance. This result is very important both when designing field-effect devices based on GNR arrays and when extracting accurate carrier mobility from the devices because the omission of fringe field terms leads to an overestimation of the field-effect mobility.
Conclusions
The GNR array channels of field-effect devices were treated as a circuit consisting of capacitors connected in parallel, while considering the interference between fringe fields of each GNR. Numerical analysis showed that the component capacitances of these GNR array channels were dependent on the configuration of the GNR arrays and the choice of gate dielectrics, which allowed the mathematical formulation of the component capacitances. Based on these results, a simple formula describing the gate capacitance of a GNR array channel was derived as a function of the GNR width, the numbers of GNRs and inter-GNR trench regions, the distance between GNRs, and the thickness and dielectric constant of the gate dielectrics. This model was verified numerically and experimentally, showing good agreement and implying its generality. This simplified capacitance model can be used not only to facilitate the estimation of channel properties in the design and characterization of the devices, but also to interpret experimental data and extract accurate carrier mobility.Acknowledgements
This work was supported by Global Frontier R&D Program through the Global Frontier Hybrid Interface Materials (GFHIM) of the National Research Foundation of Korea (NRF) funded by the Ministry of Science, ICT & Future Planning (2013M3A6B1078873), the Future Semiconductor Device Technology Development Program (10044868) funded by Ministry of Trade, Industry & Energy (MOTIE) and Korea Semiconductor Research Consortium (KSRC), and Changwon National University in 2013–2014.Notes and references
- K. S. Novoselov, A. K. Geim, S. V. Morozov, D. Jiang, Y. Zhang, S. V. Dubonos, I. V. Grigorieva and A. A. Firsov, Science, 2004, 306, 666 CrossRef CAS PubMed
.
- K. S. Novoselov, V. I. Fal'ko, L. Colombo, P. R. Gellert, M. G. Schwab and K. Kim, Nature, 2012, 490, 192 CrossRef CAS PubMed
.
- F. Schwierz, Nat. Nanotechnol., 2010, 5, 487 CrossRef CAS PubMed
.
- J. S. Burgess, B. R. Matis, J. T. Robinson, F. A. Bulat, F. K. Perkins, B. H. Houston and J. W. Baldwin, Carbon, 2011, 49, 4420 CrossRef CAS PubMed
.
- S. Y. Zhou, D. A. Siegel, A. V. Fedorov and A. Lanzara, Phys. Rev. Lett., 2008, 101, 086402 CrossRef CAS
.
- M. Y. Han, B. Özyilmaz, Y. Zhang and P. Kim, Phys. Rev. Lett., 2007, 98, 206805 CrossRef
.
- X. Wang, Y. Ouyang, X. Li, H. Wang, J. Guo and H. Dai, Phys. Rev. Lett., 2008, 100, 206803 CrossRef
.
- Y. M. Lin, V. Perebeinos, Z. Chen and P. Avouris, Phys. Rev. B: Condens. Matter Mater. Phys., 2008, 78, 161409 CrossRef
.
- L. Yang, C. H. Park, Y. W. Son, M. L. Cohen and S. G. Louie, Phys. Rev. Lett., 2007, 99, 186801 CrossRef
.
- K. Wakabayashi, Phys. Rev. B: Condens. Matter Mater. Phys., 2001, 64, 125428 CrossRef
.
- L. Jiao, L. Zhang, X. Wang, G. Diankov and H. Dai, Nature, 2009, 458, 877 CrossRef CAS PubMed
.
- J. Bai, X. Duan and Y. Huang, Nano Lett., 2009, 9, 2083 CrossRef CAS PubMed
.
- X. Liang and S. Wi, ACS Nano, 2012, 6, 9700 CrossRef CAS PubMed
.
- J. G. Son, M. Son, K. J. Moon, B. H. Lee, J. M. Myoung, M. S. Strano, M. H. Ham and C. A. Ross, Adv. Mater., 2013, 25, 4723 CrossRef CAS PubMed
.
- A. N. Abbas, G. Liu, B. Liu, L. Zhang, H. Liu, D. Ohlberg, W. Wu and C. Zhou, ACS Nano, 2014, 8, 1538 CrossRef CAS PubMed
.
- M. Evaldsson, I. V. Zozoulenko, H. Xu and T. Heinzel, Phys. Rev. B: Condens. Matter Mater. Phys., 2008, 78, 161407 CrossRef
.
- A. Behnam, A. S. Lyons, M. H. Bae, E. K. Chow, S. Islam, C. M. Neumann and E. Pop, Nano Lett., 2012, 12, 4424 CrossRef CAS PubMed
.
- Y. Gong, M. Long, G. Liu, S. Gao, C. Zhu, X. Wei, X. Geng, M. Sun, C. Yang, L. Lu and L. Liu, Phys. Rev. B: Condens. Matter Mater. Phys., 2013, 87, 165404 CrossRef
.
| This journal is © The Royal Society of Chemistry 2015 |


