 Open Access Article
Creative Commons Attribution 3.0 Unported Licence
Photocatalytic inactivation of E. Coli by ZnO–Ag nanoparticles under solar radiation
Sangeeta
Adhikari
a,
Aditi
Banerjee
b,
Neerugatti KrishnaRao
Eswar
b,
Debasish
Sarkar
a and
Giridhar
Madras
 *b
*b
aDepartment of Ceramic Engineering, National Institute of Technology, Rourkela, India
bDepartment of Chemical Engineering, Indian Institute of Sciences, Bangalore, India. E-mail: giridharmadras@gmail.com; Tel: +91-080-2293-2321
First published on 1st June 2015
Abstract
Porous and fluffy ZnO photocatalysts were successfully prepared via simple solution based combustion synthesis method. The photocatalytic inactivation of Escherichia coli bacteria was studied separately for both Ag substituted and impregnated ZnO under irradiation of natural solar light. A better understanding of substitution and impregnation of Ag was obtained by Raman spectrum and X-ray photoelectron analysis. The reaction parameters such as catalyst dose, initial bacterial concentration and effect of hydroxyl radicals via H2O2 addition were also studied for ZnO catalyst. Effective inactivation was observed with 0.25 g L−1 catalyst loading having 109 CFU mL−1 bacterial concentration. With an increase in molarity of H2O2, photocatalytic inactivation was enhanced. The effects of different catalysts were studied, and highest bacterial killing was observed by Ag impregnated ZnO with 1 atom% Ag compared to Ag substituted ZnO. This enhanced activity can be attributed to effective charge separation that is supported by photoluminescence studies. The kinetics of reaction in the presence of different scavengers showed that reaction is significantly influenced by the presence of hole and hydroxyl radical scavenger with high efficiency.
1. Introduction
Nanostructures offer tailored and improved properties for versatile applications owing to their unique physicochemical properties such as large surface to volume ratios and nanosize dimensions.1,2 Microbial contamination has become a serious issue of debate due to the spread of the antibiotic resistant infections.3 Coliforms are present in the environment which makes their presence obvious in contaminated water contributes to diarrheal diseases.4,5 Therefore, antimicrobial agents in the form of powders, organic–inorganic nanocomposite coating or coating on cellulose fibers are studied extensively.6 Recently, inorganic materials like TiO2,7 SiO2,8 ZnO (ref. 9) and silver nanoparticles10 have been engineered to impart strong antimicrobial properties.In this respect, nanocrystalline ZnO is a promising material with exciton binding energy of 60 meV.11,12 It imparts superior chemical stability with lower toxicity that makes it appropriate for applications such as photocatalysts, solar cells, etc.13–15 Moreover, ZnO nanoparticles act as bacteriocide and can restrain the growth of both Gram-negative and Gram-positive bacteria with minimum damage to human cells.16–18 Gram positive and negative bacterium such as Bacillus atrophaeus and Escherichia coli (E. coli) were inactivated by hydrothermally synthesized ZnO nanorods.9 The photocatalytic bacterial killing takes place via excitation of semiconductor material forming electron–hole pair, which eventually disrupts the cell membrane and damages the cell wall due to peroxidation of the unsaturated phospholipids through short-lived but highly active radicals.19,20
Performance tuning and augmentation of activity by doped ZnO nanocrystals have been of research interest.21,22 Various studies have been employed to tune the properties of the material that depends on the synthesis method for inhibition of bacterial growth. Among the solution based methods, the combustion process produces highly pure porous nanopowders with easy control over composition, low processing temperature, and good homogeneity. Moreover, this method yields powder with fairly high surface area and also large scale fabrication is possible without any sophisticated instrumentation.23,24
Surface modification of the catalyst has a strong influence on the photocatalytic bacterial killing.25 Thus, ZnO is coupled with various elemental/compounded materials to prevent the recombination of electron–hole pair upon light interaction with the surface to obtain better efficacy. Ag is a potential material with bactericide properties. ZnO is an n-type semiconductor that becomes an effective p-type semiconductor upon Ag doping that changes the optoelectronic properties that influence photocatalytic activity. Recently, microwave technique was employed to synthesize micro/nanospheres of ZnO/Ag for inactivation of E. coli and photocatalytic degradation of methyl orange dye.26 Fan's group27 has reported the formation of unique honeycomb Ag/ZnO heterostructures and their photocatalytic efficiency against Rhodamine B. However, in this study, we have explored how silver substitution and impregnation in ZnO affects the photocatalytic killing of bacteria in comparison to the synthesized ZnO.
Thus, in the present work, we report the preparation of ZnO by a solution combustion method using alanine as fuel. The study and comparison of the photoactivity of Ag-substituted and Ag-impregnated ZnO has been carried out. Bacterial inactivation rate in the presence of H2O2 and other scavengers have also been studied to understand the inactivation mechanism. We further compare the activity of the synthesized material with the commercial catalyst.
2. Materials and methods
2.1. Materials
The precursor zinc nitrate hexahydrate (Zn(NO3)·6H2O) and hydrogen peroxide (30%) was purchased from Merck (India). Other chemicals, such as-L-alanine (CH3CH(NH2)COOH) and silver nitrate (AgNO3), were purchased from S.D. Fine Chemicals (India). Millipore double distilled water was used for all the experiments.2.2. Catalysts synthesis
Pristine ZnO nanopowder catalyst was prepared via solution combustion method. The typical synthesis process includes dissolving stoichiometric quantities of oxidizer zinc nitrate hexahydrate and the fuel L-alanine in a minimum amount of water. The mixture is stirred for 30 min for homogeneous mixing. The aqueous solution was subjected to combustion in a preheated muffle furnace at 370 °C for a short period to obtain ZnO nanopowders. For 1 atom % Ag-substituted ZnO (ZnO–Ag sub), stoichiometric amount of Zn(NO3)·6H2O, alanine, and AgNO3 were taken in the muffle furnace at 370 °C. On the other hand, Ag-impregnated ZnO (ZnO–Ag imp) was prepared by impregnating metal (1 atom %) on the pre-synthesized ZnO surface. For the preparation of ZnO–Ag imp, combustion synthesized ZnO was dispersed in water, and the appropriate amount of AgNO3 was introduced drop by drop into the system containing hydrazine hydrate. The process was followed by drying, in order to recover the catalyst at 150 °C for 24 h. Zinc oxide (∼100 nm, Sigma Aldrich) was used as the commercial catalyst and Ag was impregnated in this catalyst by the same method and this was designated as Zno Ag imp (comm). This catalyst was used for comparison of photocatalytic activity with the prepared materials.2.3. Catalysts characterization
The prepared catalysts were characterized by various analytical techniques. The X-ray diffraction (XRD) patterns of the catalyst were measured using Ni filtered CuKα radiation (Rigaku, Ultima IV system). Morphological analyzes were carried by FESEM (NOVA NANOSEM FEI-450 system) and TEM (JEOL JEM-2100 system). Specific surface areas of the catalysts were determined using N2 as adsorbate in Quatachrome Autosorb, USA. X-ray photoelectron spectra (XPS) of these samples were recorded with AXIS Ultra X-ray photoelectron spectroscopy. UV-DRS measurement was carried using Shimadzu spectrophotometer (UV-2450) and photoluminescence (PL) spectra of the prepared photocatalysts were measured using Hitachi F-4500 spectrofluorimeter.2.4. Microorganisms and growth media
The current study used Gram negative Escherichia coli (E. coli) K-12 (MG 1655) micro-organism as the host micro-organism. The bacterial strain was obtained locally from the culture collections. The bacteria were grown aerobically in Luria–Bertani (LB) media (HiMedia, India). Bacterial culture was prepared by the constant agitation of fresh inoculums in 100 mL of media in an incubator with constant shaking at 200 rpm (Scigenic biotech, India). In order to monitor the growth of the cells, optical density was measured at 600 nm. The exponential growth phase was used for cell culture collection. It was further centrifuged at 3500 rpm for 20 min followed by washing twice with germ-free deionized water. The re-suspension of bacterial cell plates in 100 mL deionized water was done. An initial E. coli concentration used was approximately 109 CFU mL−1 (CFU – colony forming units). It was used immediately without storing for all the photocatalytic inactivation experiments. Solid medium of agar plates was prepared using LB media and 2% agar powder (HiMedia, India). The agar plates were used in the viable count method for the analysis of inactivated bacterial samples. Further details of the bacterial strain, growth media and details of the experiments can be found elsewhere.282.5. Photochemical inactivation experiments
The antimicrobial experiments were carried under natural sunlight. A batch of solution containing bacteria-catalyst for which the catalyst activity is to be compared was simultaneously exposed to sunlight and the solutions were continuously stirred with a magnetic stirrer. All the experiments were carried out between 11 am to 3 pm since the solar intensity fluctuations are minimal in that duration and the variation in the solar intensity was recorded with a radiometer (Eppley PSP 32483F3, Newport, USA) and the average solar intensity was 0.753 kW m−2.2.6. Bacterial sample analysis
All the glasswares and plastics used for the preparation of medium, during photocatalytic experiments and inactivation study were autoclaved at 120 °C for 4 h. For antimicrobial activity determination of catalyst, 50 mL of the bacterial solution of known bacterial concentration was taken in 100 mL beaker with known catalyst loading and placed under sunlight. For analysis, 100 μl of suspension was collected at fixed intervals from the thoroughly stirred solution and the bacterial count was performed. The cell counting was done by standard viable count method/plate count method. The suspension collected was successively diluted in deionized water for the final count to be in between 10–100 CFU mL−1. A suspension of 100 μl was spread on nutrient agar plates. The agar plates containing inactivated samples were incubated overnight. The fully grown colonies on plates were counted and recorded. The number of colonies forming units (CFU's) was counted considering the dilution factor after incubation at 37 °C for 24 h. The respective data are the average values obtained from triplicate runs.2.7. Bacterial sample analysis
The stability of the catalyst was confirmed by conducting deactivation studies. Experiments were conducted with the ZnO–Ag (imp) with a loading of 0.25 g L−1. Once the bacterial inactivation was complete in 2 h, the reaction was stopped and the second cycle was started after making the initial concentration of E. coli to ∼1.1 × 10⁹ CFU mL−1. Similarly, the third cycle was also carried out. The catalyst is taken at the end of the first cycle and used for the second cycle and the catalyst at the end of the second cycle was used for the third cycle.29 This was repeated for seven cycles.3. Results and discussion
3.1. Catalyst characterizations
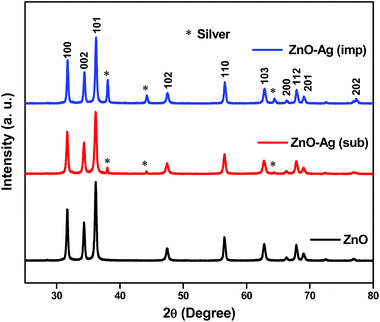
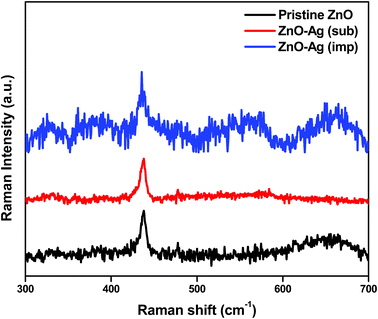
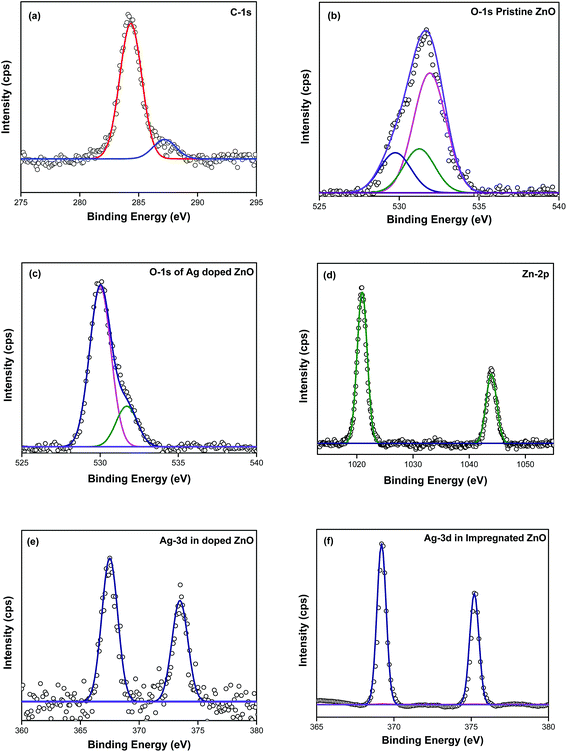
![[3 with combining macron]](https://www.rsc.org/images/entities/char_0033_0304.gif) m space symmetry according to JCPDS: 01-087-0717. The peak intensity for Ag in substituted catalyst is lesser compared to impregnated sample. Therefore, the presence of Ag in the X-ray pattern suggests that the silver has been successfully substituted and impregnated to zinc oxide nanoparticles. Substitution and impregnation of silver in zinc oxide can be well understood by Raman scattering and XPS analyzes.
m space symmetry according to JCPDS: 01-087-0717. The peak intensity for Ag in substituted catalyst is lesser compared to impregnated sample. Therefore, the presence of Ag in the X-ray pattern suggests that the silver has been successfully substituted and impregnated to zinc oxide nanoparticles. Substitution and impregnation of silver in zinc oxide can be well understood by Raman scattering and XPS analyzes.
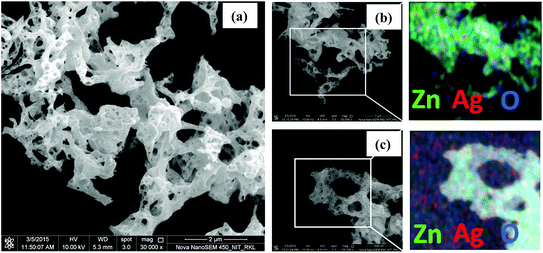 | ||
| Fig. 4 FESEM images of (a) pristine ZnO nanopowders, (b) ZnO–Ag (sub) and (c) ZnO–Ag (imp) with EDS-elemental mapping of composites. | ||
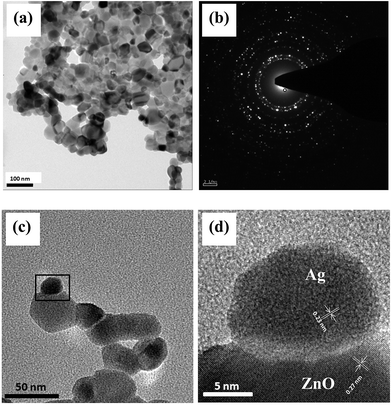
In order to better understand the impregnated distribution of silver in ZnO, transmission electron microscopy with HRTEM and SAED has been carried as shown in Fig. 5(a–d). TEM image of the silver impregnated zinc oxide clearly depicts non-uniform size particles with some nearly spherical particles as seen in Fig. 5(a). The porous zinc oxide mass constitutes agglomeration of small particles during combustion process where as silver remains as high dense particle probably due to its high atomic number. The average particle size from TEM image is found to be ∼35 nm. The SAED pattern shown in Fig. 5(b) shows number of distinct concentric rings with superimposed bright spots. In Fig. 5(c), we can see few particles softly agglomerated, indicating the particle size of silver to be approximately 20 nm. HRTEM image of Ag/ZnO heterojunction of the boxed region in Fig. 5(c) is shown in Fig. 5(d). The lattice fringes of ZnO are observed to be 0.27 nm consistent with the (100) reflection and lattice distance of 0.23 nm corresponds to the d-spacing of the (111) crystal plane of Ag, as shown in Fig. 5(d).
3.2. Photocatalytic inactivation of bacteria
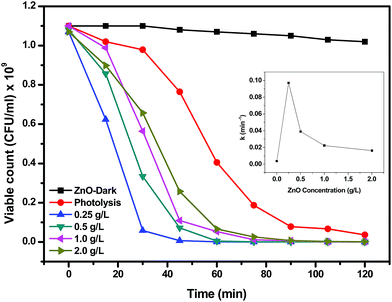
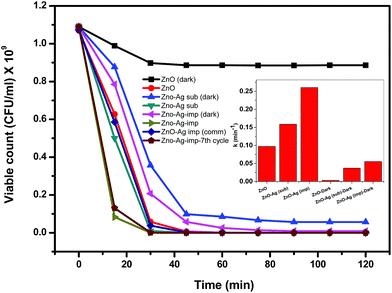
The reaction rate constant k in min−1 has been calculated following the kinetic equation: −ln(C/Co) = kt where, Co is the initial concentration, C is the concentration for given time interval, k is the reaction rate constant and t is the time for reaction. The t value has been considered 30 min for calculation of k as the photocatalytic reaction becomes almost stable after 30 min duration. The highest rate constant of 0.097 min−1 was achieved for 0.25 mg mL−1 ZnO loading supporting the inactivation profile with subsequent decrease in rate constant upon increasing the concentration of catalyst. The rate constant obtained with 0.25 mg mL−1 ZnO loading is nearly four times that obtained with 2 g L−1 loading of ZnO, as shown in the inset of the figure.
As mentioned in the previous reports, the photocatalytic inactivation of microorganisms depends on various parameters such as generation of reactive oxygen species (ROS), absorption of the irradiated light and influence of these on total biomass.36 The maximum inactivation of E. coli observed at a catalyst loading of 0.25 mg mL−1 in the present study could be due to the high absorption of sunlight that leads to the generation of high amount of ROS that maximally interacted with the bacterial mass. On the other hand, the decrease in bacterial inactivation at higher catalyst loading could be attributed to the shadowing or screening effect causing attenuation of sunlight reaching to the bacterial cells as a result of high amount of catalyst present in the medium. This shadowing/screening effect has been reported by others in previous studies on the photocatalytic inactivation of a microorganism as well as degradation of chemical contaminants.37,38 The results presented in Fig. 7 demonstrated that a catalyst loading of 0.25 mg mL−1 was the most efficient in terms of photocatalytic inactivation of E. coli in the present system. Similar observations were found by Zhang et al. where 0.3 mg mL−1 of ZnO nanoparticles showed highest inactivation against E. coli and S. aureus38 and 0.25 mg mL−1 of TiO2 showed the highest inactivation.35
As explained in Section 2.7, deactivation studies were conducted with ZnO–Ag (imp) for seven cycles. It is clearly observed from Fig. 10 that no significant deactivation was observed and the bacterial inactivation remained almost similar to the first cycle.
As discussed in Section 2.2, bacterial inactivation was also examined for Ag impregnated ZnO wherein ZnO was obtained commercially. Fig. 10 shows this catalyst, ZnO–Ag imp (comm), shows activity for bacterial inactivation that is higher than that of ZnO but is lower than that of ZnO–Ag imp prepared in this study. This clearly shows the superior activity of Ag impregnated ZnO prepared by solution combustion compared to the Ag impregnated commercial ZnO.
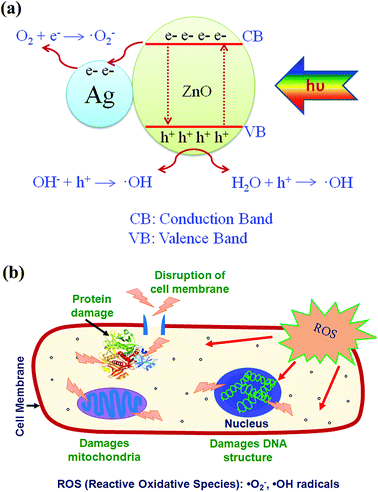 | ||
| Fig. 11 Proposed schematic of (a) photocatalytic mechanism for Ag impregnated ZnO and (b) process of E. coli disruption. | ||
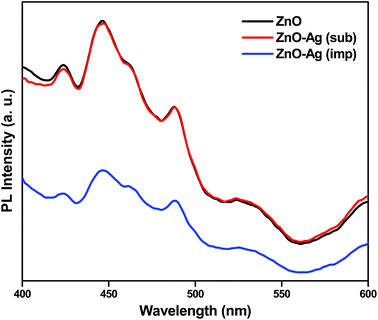
A better outlook to the functioning of photocatalysts can be given by PL analyses. Photoluminescence spectroscopy is one of the powerful tools in characterization of the optical properties of semiconductor materials. Fig. 12 shows the photoluminescence spectra of ZnO, Ag substituted ZnO and Ag impregnated ZnO. Room temperature excitation of zinc oxide nanoparticles at 325 nm shows photoluminescence at both UV and visible regions. However, UV emission corresponds to band gap of the zinc oxide nanoparticles, visible region emission should be noted with regard to Ag substitution and impregnation. The visible range emission is owed to the presence of oxygen defects and incorporation of silver into zinc oxide. The increase in emission of Ag substituted zinc oxide at visible region is due to that Ag+ ions has got substituted into Zn2+ lattice creating ionized oxygen vacancies. The Ag impregnated zinc oxide sample showed less photoluminescence intensity compared to substituted and pristine zinc oxide samples. This is because the impregnated Ag exists as such in metallic state associated with zinc oxide nanoparticles. Therefore, whenever zinc oxide gets excited, the charge carriers get separated by the metallic Ag which acts as electron sink and decrease the recombination.45 Hence, silver impregnated zinc oxide shows better photoactivity compared to pristine and Ag substituted zinc oxide catalysts.
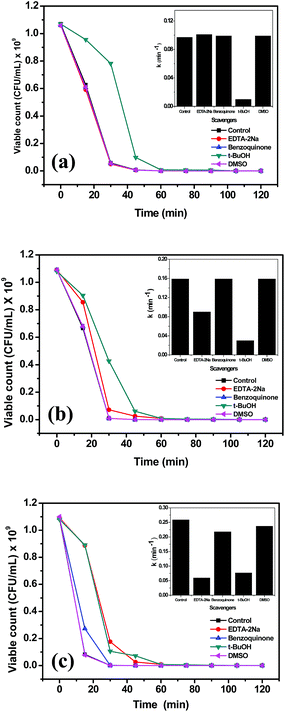
The proposed mechanism can be supported by the photochemical experiments by means of trapping agents for radicals and holes. Scavengers used were EDTA–2Na (hole scavenger), benzoquinone (˙O2− radical scavenger), t-BuOH (˙OH radical scavenger) and DMSO (electron scavenger). Control experiments were carried out only with the designated catalyst for bacterial inactivation. Fig. 13(a) shows the plot of viable bacterial count with time variation of the different reaction systems containing scavengers with pristine zinc oxide catalyst. The inset in the figure shows the rate constants in the presence of different scavengers. The reduced rate constant confirms the trapping of hydroxyl radicals by t-BuOH produced during the reaction. It suggests that the main oxidative species are ˙OH radicals. Hydroxyl radical scavengers greatly influence the bacterial killing. Fig. 13(b) and (c) show the viable count plot of Ag substituted and impregnated zinc oxide in the presence of different scavengers, respectively. Both EDTA–2Na and t-BuOH shows effective trapping of hole and ˙OH radical. This can be predicted that silver acts as sink for the electrons whereas hole reduces the hydroxyl ion on the surface to produce hydroxyl radical that further promotes the photochemical reaction for bacterial killing.27 The insets in Fig. 13(b) and (c) support the hole and radical trapping with lowest rate constants observed for EDTA–2Na and t-BuOH scavengers. However, rate constant for impregnated silver (0.06 min−1) is less than substituted silver (0.09 min−1) supporting the better activity of Ag impregnated ZnO in the presence of scavenger. It is observed that both hole and hydroxyl radical scavenger have nearly equal constants supporting the above result. This suggests that the hole and surface hydroxyls play very crucial role in the photocatalytic killing of bacteria.
4. Conclusions
Successful synthesis of hexagonal wurtzite ZnO was carried having BET surface area of 16.8 m2 g−1. A modification to ZnO was performed by Ag substitution and impregnation bearing surface area of 14.2 m2 g−1 and 12.4 m2 g−1, respectively. Substitution and impregnation of silver as Ag+ ion and metallic Ag was confirmed from XPS. The photocatalytic tests showed that Ag impregnated ZnO exhibits excellent bacterial inactivation. The porous and open structure of ZnO favored the effective inactivation by increasing the number of active sites and effective charge separation observed in presence of Ag. Ag acts as an electron sink and hole as hydroxyl radical former for the photochemical killing of bacteria. The experiments for different radical and electron–hole trapping showed that the photogenerated holes and ˙OH radicals are the main oxidative species for E. coli inactivation.Acknowledgements
This research work was financially supported by NRCM, IISc. Bangalore. The authors would like to acknowledge Ms. Shreya Shetty for conducting preliminary experiments, Mr. Satyapaul Singh for helpful discussion on XRD and Ms. Leelavathi Annamalai for discussion on TEM. The authors gratefully acknowledge the Centre of Nanoscience and Engineering for characterization facilities.References
- C. Wang, Y. Ao, P. Wang, J. Hou and J. Qian, Colloids Surf., A, 2014, 360, 184–189 CrossRef.
- Y. R. Smith, A. Raj, K. Joseph, V. Ravi Subramanian and B. Viswanathan, Colloids Surf., A, 2010, 367, 140–147 CrossRef CAS.
- A. Fujishima, T. N. Rao and D. A. Tryk, J. Photochem. Photobiol., C, 2000, 1, 1–21 CrossRef CAS.
- O. Yamamoto, Int. J. Inorg. Mater., 2001, 3, 643–646 CrossRef CAS.
- L. Fiksdal, I. Tryland and H. Nelis, Water Sci. Technol., 1997, 35, 415–418 CrossRef CAS.
- R. Brayner, R. Ferrari-Iliou, N. Brivois, S. Djediat, M. F. Benedetti and F. Fiévet, Nano Lett., 2006, 6, 866–870 CrossRef CAS PubMed.
- R. Asahi, T. Morikawa, T. Ohwaki, K. Aoki and Y. Taga, Science, 2001, 293, 269–271 CrossRef CAS PubMed.
- S. Krishnan, T. Chinnasamy, S. Veerappan, K. Senthilkumar and D. Kannaiyan, Mater. Sci. Eng., C, 2014, 45, 337–342 CrossRef CAS PubMed.
- K. H. Tam, A. B. Djurisic, C. M. N. Chan, Y. Y. Xi, C. W. Tse, Y. H. Leung, W. K. Chan, F. C. C. Leung and D. W. T. Au, Thin Solid Films, 2008, 516, 6167–6174 CrossRef CAS.
- H. Shi, G. Li, H. Sun, T. An, H. Zhao and P. K. Wong, Appl. Catal., B, 2014, 158, 301–307 CrossRef.
- Z. Wang, J. Phys.: Condens. Matter, 2004, 16, 829–858 CrossRef.
- H. Song, H. Yang and X. Ma, J. Alloys Compd., 2013, 578, 272–278 CrossRef CAS.
- S. Sharma, R. Vyas, N. Sharma, V. Singh, A. Singh, V. Kataria, B. Kumar Gupta and Y. K. Vijay, J. Alloys Compd., 2013, 552, 208–213 CrossRef CAS.
- H. Li, Z. Zhang, J. Huang, R. Liu and Q. Wang, J. Alloys Compd., 2013, 550, 526–530 CrossRef CAS.
- M. Zhang, F. Jin, M. Zheng and J. Liu, RSC Adv., 2014, 4, 10462–10466 RSC.
- L. Zhang, Y. Ding, M. Povey and D. York, Prog. Nat. Sci., 2008, 18, 939–944 CrossRef CAS.
- J. Das and D. Khushalani, J. Phys. Chem. C, 2010, 114, 2544–2550 CAS.
- A. Hagfeldt and M. Gratzel, Chem. Rev., 1995, 95, 49–68 CrossRef CAS.
- Y. Liu, J. Yang, Q. Guan, L. Yang, H. Liu, Y. Zhang, Y. Wang, D. Wang, J. Lang, Y. Yang, L. Fei and M. Wei, Appl. Surf. Sci., 2010, 256, 3559–3562 CrossRef CAS.
- L. Zhang, Y. Jiang, Y. Ding, N. Daskalakis, L. Jeuken, P. Malcolm, A. J. O’Niell and D. W. York, J. Nanopart. Res., 2010, 12, 1625–1636 CrossRef CAS.
- Y. Zheng, C. Chen, Y. Zhan, X. Lin, Q. Zheng, K. Wei and J. Zhu, J. Phys. Chem. C, 2008, 112, 10773–10777 CAS.
- M. K. Lee, T. G. Kim, W. Kim and Y. M. Sung, J. Phys. Chem. C, 2008, 112, 10079–10082 CAS.
- K. Nagaveni, G. Sivalingam, M. S. Hegde and G. Madras, Environ. Sci. Technol., 2004, 38, 1600–1604 CrossRef CAS PubMed.
- K. C. Patil, M. S. Hegde, T. Rattan and S. T. Aruna, Chemistry of nanocrystalline oxide materials-combustion synthesis, properties and applications, World Scientific, New Jersey, 2008, pp. 1–20 Search PubMed.
- T. Sun, J. Qiu and C. Liang, J. Phys. Chem. C, 2008, 112, 715–721 CAS.
- Z. Li, F. Zhang, A. Meng, C. Xie and J. Xing, RSC Adv., 2015, 5, 612–620 RSC.
- Y. Cai, H. Fan, M. Xu and Q. Li, Colloids Surf., A, 2013, 436, 787–795 CrossRef CAS.
- S. Sontakke, J. Modak and G. Madras, Appl. Catal., B, 2011, 106, 453–459 CrossRef CAS.
- K. Nagaveni, G. Sivalingam, M. S. Hegde and G. Madras, Appl. Catal., B, 2004, 48(2), 83–93 CrossRef CAS.
- R. S. Zeferino, M. B. Flores and U. Pal, J. Appl. Phys., 2011, 109, 14308 CrossRef.
- J. M. Liu, C. K. Ong and L. C. Lim, Ferroelectrics, 1999, 231, 223–229 CrossRef.
- C. Gu, C. Cheng, H. Huang, T. Wong, N. Wang and T. Zhang, Cryst. Growth Des., 2009, 9, 3278–3285 CAS.
- D. Lin, H. Wu, R. Zhang and W. Pan, Chem. Mater., 2009, 21, 3479–3484 CrossRef CAS.
- N. Serpone, D. Lawless and R. Khairutdinov, J. Phys. Chem., 1995, 99, 16646–16654 CrossRef CAS.
- S. Sontakke, C. Mohan, J. Modak and G. Madras, Chem. Eng. J., 2012, 189, 101–107 CrossRef.
- D. S. Bhatkhande, V. G. Pangarkar and A. A. Beenackers, J. Chem. Technol. Biotechnol., 2002, 77, 102–116 CrossRef CAS.
- A. K. Benabbou, Z. Derriche, C. Felix, P. Lejeune and C. Guillard, Appl. Catal., B, 2007, 76, 257–263 CrossRef CAS.
- Y. Zhang, X. Gao, L. Zhi, X. Liu, W. Jiang, Y. Sun and J. Yang, J. Inorg. Biochem., 2014, 130, 74–83 CrossRef CAS PubMed.
- S. K. Mohanty and A. B. Boehm, Environ. Sci. Technol., 2014, 48, 11535–11542 CrossRef CAS PubMed.
- N. R. Asad, L. M. B. O. Asad, A. B. Silva, I. Felzenszwalb and A. C. Leitão, Acta Biochim. Pol., 1998, 45, 677–690 CAS.
- O. Legrini, E. Oliveros and A. M. Braun, Chem. Rev., 2002, 93, 671–698 CrossRef.
- R. van Grieken, J. Marugán, C. Sordo, P. Martínez and C. Pablos, Appl. Catal., B, 2009, 93, 112–118 CrossRef CAS.
- J. Manna, S. Goswami, N. Shilpa, N. Sahu and R. K. Rana, ACS Appl. Mater. Interfaces, 2015, 7, 8076–8082 CAS.
- Y. Liu and H. Kim, Carbohydr. Polym., 2012, 89, 111–116 CrossRef CAS PubMed.
- C. Karunakaran, V. Rajeshwari and P. Gomathisankar, J. Alloys Compd., 2010, 508, 587–591 CrossRef CAS.
| This journal is © The Royal Society of Chemistry 2015 |

