A highly efficient and magnetically retrievable functionalized nano-adsorbent for ultrasonication assisted rapid and selective extraction of Pd2+ ions from water samples

R. K. Sharma*, Harish Kumar and Anil Kumar
Green Chemistry Network Centre, Department of Chemistry, University of Delhi, Delhi-110007, India. E-mail: rksharmagreenchem@hotmail.com; Fax: +91-011-27666250; Tel: +91-011-27666250

Received 8th April 2015 , Accepted 7th May 2015

First published on 8th May 2015


Abstract

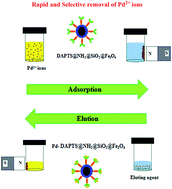
A novel magnetically retrievable core–shell structured nano-adsorbent (DAPTS@NH2@SiO2@Fe3O4) was fabricated for selective extraction of Pd2+ ions from water samples. The nano-adsorbent was well characterized by XRD, TEM, FE-SEM, FTIR, EDS, ED-XRF and VSM. The influence of various factors on adsorption and desorption such as the amount of nano-adsorbent, pH variation, adsorption time, eluting agent type and its volume were investigated. The maximum adsorption capacity was found to be 64.8 (mg g−1) which perfectly fitted with a Langmuir isotherm model of adsorption. Also, the adsorption time of 5 minutes suggested faster adsorption kinetics which was in agreement with a pseudo second order kinetic model. Besides, the presence of a rich magnetic core facilitated the ease of separation of the nanoadsorbent. The overall results suggested the potential use of the nano-adsorbent for the faster, selective and quantitative extraction of Pd2+ ions from aqueous and catalytic converter samples.

Introduction

Palladium, besides being an important metal in the field of catalysis, plays a major and versatile role in industries such as jewelry, electronics, medicine, automobiles, etc., due to its exceptional chemical and physical properties.1–3 The excessive exploitation of this metal from its natural resources as a consequence of rapid industrialization has raised serious economic and ecological concerns. Besides, although, living organisms very rarely come in contact with Pd, extraction from ores, leaching of catalysts and wastes from an automobile's catalytic converter result in a dense accumulation of Pd in the environment and its migration to the food chain causes carcinogenic and toxic effects.4–6 Therefore, there is an urgent need for the development of effective materials that can recover and accurately determine Pd from various waste samples. An extensive literature survey reveals that several methodologies such as solvent extraction, co-precipitation, dispersive liquid–liquid microextraction, cloud point extraction, ion exchange, electro-deposition, and membrane filtration7–11 have been established for the extraction of Pd. However, they suffer from severe limitations such as poor sensitivity and selectivity, cumbersome separation techniques requiring excess volumes of toxic organic solvents which restrict their wide scale utility. Solid phase extraction (SPE),12,13 a widely accepted technique, has emerged as a very powerful and very effective separation tool because of its unique and excellent features such as operational simplicity, higher selectivity, better separation, higher preconcentration of metal ions, lesser utilization of organic solvents and reagents, lower operational cost, reversibility and reusability.

Recently, iron based magnetic nanomaterials such as Fe3O4[thin space (1/6-em)]14–20 have gained huge attention as new solid phase nano-adsorbents due to their significant properties like large surface area, ease of surface modification including the choice of chemical modifications as per application requirements, excellent magnetic response which reduces the time consuming separation of nano-adsorbent from large volumes of solution.

Till date, a number of adsorbents based on magnetic as well as non-magnetic materials have been reported for Pd2+ extraction. However, despite their utility, unfortunately they possess a number of drawbacks such as longer adsorption and desorption time, harsh elution conditions, requirement of large amount of adsorbent dosages, low adsorption capacity etc., that necessitates the development of superior adsorbents that would not only offer better adsorption capacity but would also work under milder optimized parameters.21–25

In continuation of our research efforts directed towards the development of organic–inorganic hybrid materials for the efficient determination and recovery of heavy metals, we herein, report the synthesis of a magnetically driven core–shell nano-adsorbent through the covalent immobilization of 2,6-diacetylpyridine monothiosemicarbazide on amine functionalized silica coated magnetic nanoparticles.26–30 The newly fabricated nano-adsorbent was then applied for the selective extraction of Pd2+ ions from different water samples. It was found that, in comparison to the previous reports the DAPTS@NH2@SiO2@Fe3O4 nano-adsorbent not only exhibited exceptional adsorption characteristics by rapidly, efficiently and selectively adsorbing Pd2+ ions from the bulk solution containing the complex matrix of multiple interfering ions but also showed higher reusability.2,21–26 To, the best of our knowledge, this is the first report wherein, magnetic DAPTS@NH2@SiO2@Fe3O4 adsorbent has been developed for the extraction of Pd2+ ions.

Experimental section

Reagents and solutions

3-Aminopropyltriethoxy silane (APTES) was purchased from Fluka. Tetraethoxyorthosilicate (TEOS), 2,6-diacetyl pyridine and thiosemicarbazide were obtained from Sigma Aldrich. All other reagents used were of analytical grade and procured from Spectrochem Pvt. Ltd. Stock solutions of metal ions (1000 mg l−1) were used and working solutions were prepared by appropriate dilution of stock solutions. The pH of samples was adjusted with buffer solutions. Double distilled water was employed throughout the experiments.

Instrumentation

The morphologies of the synthesized magnetic NPs and their derivatives obtained after modifications were examined through transmission electron microscope (TEM JEM-2010 JEOL, JAPAN) equipped with energy dispersive X-ray spectrometer (EDS) and operated at an accelerating voltage of 300 KV. The X-ray diffraction patterns of magnetic NPs and DAPTS@NH2@SiO2@Fe3O4 NPs were recorded using CuKα radiation (λ = 1.5406 Å) on a powder X-ray diffractometer (Bruker, D8 Advanced, Germany) at room temperature in a 2θ interval of 10–70°. The FT-IR spectra were recorded on PERKIN ELMER 2000 FTIR spectrophotometer at room temperature in the range of 400–4000 cm−1 using KBr pellets. The magnetic properties were determined with a vibrating sample magnetometer (EV-9, Microsense, ADE) in the magnetic field range of −20[thin space (1/6-em)]000 Oe to +20[thin space (1/6-em)]000 Oe at room temperature. The pHs of solutions were adjusted on ELICO LI 120 pH meter. LABINDIA AA 7000 Atomic absorption spectrometer was used for determination of metal ion concentrations. Further, EDXRF FISCHER was used for determining the presence of metals in solid samples. FE-SEM images were collected using Tescan Mira 3.

Preparation of 2,6-diacetylpyridine monothiosemicarbide

2,6-Diacetylpyridine monothiosemicarbazide was prepared according to a reported method.31 A hot solution of thiosemicarbazide (5 mmol) in 8 ml of methanol containing 2 ml of acetic acid was added to the hot solution of 2,6-diacetyl pyridine (5 mmol) in 10 ml of methanol. The mixture was refluxed until the solution become clear and then allowed to cool at room temperature. The solid product obtained was filtered off and washed with 1[thin space (1/6-em)]:[thin space (1/6-em)]1 (methanol + water), dried and recrystallized from 1[thin space (1/6-em)]:[thin space (1/6-em)]1 (methanol + water).

Preparation of Fe3O4

Fe3O4 NPs were prepared by co-precipitation method as reported in literature.32 FeSO4·7H2O (4.2 g) and Fe2(SO4)3 (6.0 g) were dissolved in 250 ml water in a 500 ml beaker. Ammonium hydroxide (25%) was slowly added to adjust the pH of the solution to 10. Then, the reaction mixture was stirred continuously for 1 h at 60 °C. The black precipitated NPs were separated by external magnet, washed with de-ionized water until the pH reached to 7, and then dried under vacuum.

Preparation of NH2@SiO2@Fe3O4

The synthesized Fe3O4 NPs were coated with SiO2 in order to impart stability to them and provide the sites for functionalization. To obtain SiO2 encapsulated Fe3O4 NPs sol gel method was followed.33 A dispersed solution of Fe3O4 (0.5 g in 5 ml of 0.1 M HCl) was ultrasonicated in a mixture of ethanol and double distilled water (100 ml + 50 ml), to which 5 ml of ammonium hydroxide was added, followed by the addition of 1 ml of TEOS, and finally stirred for 6 h at 60 °C. The resulting silica coated magnetic Fe3O4 (SiO2@Fe3O4) NPs were separated from the solution by an external magnet, washed with ethanol and double distilled water and then dried under vacuum. The SiO2@Fe3O4 NPs were thereafter functionalized using APTES. The APTES functionalized SiO2@Fe3O4 allows the covalent binding of the synthesized DAPTS. For obtaining NH2@SiO2@Fe3O4, APTES (3 ml) was added to disperse solution of SiO2@Fe3O4 (0.5 g) in 150 ml of ethanol and the resulting mixture was stirred for 6 h at 60 °C.34 The amine functionalized silica coated (NH2@SiO2@Fe3O4) NPs obtained were separated magnetically, washed several times with dry ethanol and then dried under vacuum.

Preparation of nano-adsorbent, DAPTS@NH2@SiO2@Fe3O4

Finally for synthesizing the nano-adsorbent, equivalent moles of NH2@SiO2@Fe3O4 and 2,6-diacetylpyridine monothiosemicarbazide were taken in dry methanol (20 ml) in 100 ml round bottom flask, sonicated for 5 min and then refluxed for 1 h. The resulting nano-adsorbent (DAPTS@NH2@SiO2@Fe3O4) was washed with dry methanol and vacuum dried for experimental works (Scheme 1).
image file: c5ra06265a-s1.tif
Scheme 1 Fabrication of DAPTS@NH2@SiO2@Fe3O4 nanoadsorbent.

Sample preparation for application

The grounded portion of catalytic converter (0.5 g) was taken in a 100 ml beaker containing 25 ml of aqua-regia and was heated almost to dryness. Then, 25 ml of double distilled water was added to dried solid and insoluble solids were filtered out. The remaining filtrate was made up to 100 ml in a graduated flask. For analysis the sample solutions were taken at desired pH.

Preparation of water samples

For analysis, water sample was taken directly from the tap, spiked with recognized amounts of Pd2+ ions and pH was adjusted to 4. Apart from that, drinking water samples from commercially available water bottles containing multiple interfering ions of known concentration were taken, spiked with known amounts of Pd2+ ions at desired pH.

Adsorption and desorption

Batch method using ultrasonication. 5 mg of nano-adsorbent was suspended in a glass vial containing 10 ml of Pd2+ (10 mg l−1) solution, pre-adjusted to pH 4 and ultrasonicated for a maximum of 10 min using the ultrasonic water bath. The nano-adsorbent was separated from the bulk solution to the wall of the glass vial using the external magnet as shown in Fig. S1, ESI. The concentration of the remaining filtrate was checked against FAAS, and the percent adsorption (Q%) was calculated using the eqn (1),
 
image file: c5ra06265a-t1.tif(1)
where Cini and Ce (mg l−1) denoted the initial and equilibrium concentration of Pd2+ solution. For desorption of adsorbed Pd2+ ions, 5 mg of nano-adsorbent equilibrated with Pd2+ was taken in a glass vial and washed with double distilled water. Then sonicated with 2 ml (0.01 M HCl + 0.2 M thiourea) of eluent for a maximum of 5 min to allow the complete desorption of Pd2+ ions. After that, eluent concentration was checked against FAAS to get the concentration of recovered Pd2+ amount. Lastly, the nano-adsorbent was washed with double distilled water to remove any traces of eluent, dried and stored for the next adsorption run.
Adsorption isotherm and kinetics. For determination of the maximum adsorption capacity of the nano-adsorbent for Pd2+, 5 mg of nano-adsorbent was sonicated with 10 ml of Pd2+ solution of varying concentration (10–100 mg l−1) at room temperature using the batch method of adsorption. For kinetics study, the solution was sonicated for a maximum time of 30 min, and at regular interval the concentration of Pd2+ solution was analyzed using FAAS.

Result and discussion

Characterization of nano-adsorbent

XRD analysis. The crystal phase purity and structure stability of naked Fe3O4 NPs and DAPTS@NH2@SiO2@Fe3O4 NPs were examined, and their respective diffraction peak positions were compared with standard 2θ (deg.). JCPDS card no. 19-0629. The sharp and intense peaks of synthesized Fe3O4 NPs at 30.234°, 35.571°, 43.219°, 53.743°, 57.280°, 62.793°, matched well with standard peaks at 30.091°, 35.422°, 43.052°, 53.391°, 56.942°, 62.515° referred to [220], [311], [400], [422], [511], [440] planes. So, it confirmed the formation of pure crystalline magnetite NPs (Fe3O4) with cubic inverse spinel structure and ruled out the formation of Fe2O3 NPs (Fig. 1a and b). The average size of NPs calculated using Debye Scherrer equation was found to be about 24 nm respectively, using the most intense peak. Besides, the six characteristic peaks, and no other sharp and intense peaks, even after the amorphous coatings of SiO2, APTES, and DAPTS, clearly indicated the persistence of high stability and purity of the crystalline phase of Fe3O4 as revealed in Fig. 1c.
image file: c5ra06265a-f1.tif
Fig. 1 XRD patterns of (a) pure Fe3O4 (JCPDS card no. 19-0629), synthesized (b) Fe3O4 NPs and (c) DAPTS@NH2@SiO2@Fe3O4.
TEM analysis. In order to get information about nanoparticles size and their surface morphologies, TEM micrographs were obtained. TEM image of synthesized Fe3O4 NPs (Fig. 2a) at low magnification, showed the high dispersibility of NPs. The high resolution TEM (HRTEM) image (Fig. 2b) of single Fe3O4 NP was obtained, which found to be spherical in shape with a diameter of 25 nm and was in agreement with the average nanoparticle size obtained from XRD measurement.
image file: c5ra06265a-f2.tif
Fig. 2 (a) TEM image of synthesized Fe3O4 NPs, (b) HRTEM image of the single nanocrystal entity with lattice fringe, (c) SAED pattern of Fe3O4 and (d) TEM image of SiO2@Fe3O4.

Also, the 0.29 nm spaced lattice fringe corresponded to [220] plane of the cubic inverse spinel structure of pure Fe3O4 (JCPDS card no. 19-0629) NPs. The selected area electron diffraction (SAED) pattern (Fig. 2c) revealed the crystalline behavior of synthesized NPs, where [220], [311], [400], [422], [511], [440] planes corresponded to pure Fe3O4 planes were clearly indexed. The TEM image of SiO2@Fe3O4 NPs (Fig. 2d) suggested the homogenous coatings of amorphous SiO2 over the Fe3O4 NPs with uniform thickness of around 5 nm.

TEM EDS. With peaks for Fe, Si, O, C and N atoms, the EDS images as shown in Fig. 3 confirmed the immobilization of amorphous layer of SiO2 and APTES on the Fe3O4 NPs.
image file: c5ra06265a-f3.tif
Fig. 3 EDS images of (a) SiO2@Fe3O4 NPs and (b) NH2@SiO2@Fe3O4 NPs.
FE-SEM. For a better surface morphology and structure elucidation, FE-SEM images of the synthesized Fe3O4 NPs were obtained and have been depicted in Fig. 4. The image further, supported the formation of spherically shaped Fe3O4 NPs with an average diameter of around 25 nm (inset Fig. 4) and which was found to be in accordance with XRD and TEM measurements.
image file: c5ra06265a-f4.tif
Fig. 4 FE-SEM image of Fe3O4 NPs at lower magnification, inset image shows Fe3O4 NPs at higher magnification.
VSM. Magnetization measurements were mainly investigated in order to obtain the magnetic parameters and behaviour of Fe3O4 NPs, NH2@SiO2@Fe3O4 and DAPTS@NH2@SiO2@Fe3O4 NPs at room temperature in the external magnetic range of −20[thin space (1/6-em)]000 to +20[thin space (1/6-em)]000 Oe. As can be seen in Fig. 5a, the synthesized Fe3O4 NPs showed saturation magnetization value of 68 emu g−1, lower than bulk magnetite NPs (92 emu g−1),35 which further decreased to 23 emu g−1 and 17 emu g−1 for NH2@SiO2@Fe3O4 and DAPTS@NH2@SiO2@Fe3O4 (Fig. 5b and c) NPs.
image file: c5ra06265a-f5.tif
Fig. 5 Field dependent magnetization curves of (a) Fe3O4 NPs, (b) NH2@SiO2@Fe3O4 NPs, (c) DAPTS@NH2@SiO2@Fe3O4 NPs and (inset) show enlarged view near the origin.

The decrease was ascribed to the contribution from non-magnetic amorphous coatings of SiO2, APTES, and DAPTS over the crystalline surface of Fe3O4 NPs. Although, the decrease was profound one for nano-adsorbent yet, it showed ease of separation from bulk solution using the external magnets. The inset curves suggested the superparamagnetic behaviour of synthesized Fe3O4 NPs and their modified entities without any hysteresis and remanence at room temperature.

FTIR. FTIR technique was employed for detection and confirmation of various functional groups present on the surface of the Fe3O4 NPs and their modified allied. A comparative studies for FTIR spectra of powdered samples were studied in the range of 400–4000 cm−1 using KBr pellets.

As shown in Fig. 6a the vibration band peak at 572.17 cm−1 in the range of 560–590 cm−1 corresponded to metal oxygen bond, Fe–O of Fe3O4 NPs. The introduction of the amorphous layer of SiO2 on Fe3O4 gave some new peaks (Fig. 6b) at 1090.10 cm−1 assigned to the characteristic stretching vibration of Si–O–Si and Si–OH bond, while the characteristic peaks at 806.62 cm−1, 960.75 cm−1, 467.32 cm−1 corresponded to asymmetric, symmetric vibrations of Si–OH and bending vibration of Si–O–Si. Also, the reduction in characteristic peak of Fe3O4 suggested the formation of desired SiO2@Fe3O4 NPs.


image file: c5ra06265a-f6.tif
Fig. 6 Fourier Transform-infrared spectra (a) Fe3O4 NPs, (b) SiO2@Fe3O4 and (c) DAPTS@NH2@SiO2@Fe3O4.

Further, the introduction of APTES and 2,6-diacetylpyridine monothiosemicarbazide on SiO2@Fe3O4 NPs gave peaks (Fig. 6c) at 2932.7 cm−1 and 2876.16 cm−1 for combined stretching of C–H bond of APTES and DAPTS. A sharp peak at 1665.57 cm−1 appeared due to collective stretching of the C[double bond, length as m-dash]O bond of DAPTS and C[double bond, length as m-dash]N bond (formed between DAPTS and an amine group of APTES). However, the reduction in intensity of peak 960.75 cm−1 suggested the coatings of APTES and DAPTS on the nano-adsorbent.

EDXRF. The EDXRF technique is considered to be a very easy and faster analytical technique for determining the presence of the heavy metals in the solid samples. For the analysis, dry samples of nano-adsorbent before and after the adsorption of Pd2+ ions were taken. As shown in Fig. S2, ESI a sharp and intense peak for Pd, without any disturbance in the peak for Fe, not only confirmed the adsorption of Pd2+ ions but also signified the stability of nano-adsorbent before and after adsorption.

Analytical studies

Effect of pH on adsorption. Solubility of metal ions in aqueous medium and their complexation with DAPTS present on the surface of nano-adsorbent largely depends on the action of pH. In lower acidic medium, protons strongly competed with Pd2+ ions for the binding sites available on the nano-adsorbent. Once the proton get adsorbed, it creates a positive field around the nano-adsorbent, which strongly repels the incoming Pd2+ ions. While, the precipitation of metals ions at pH greater 7, results in low adsorption. In Fig. 7, the nano-adsorbent showed high affinity for the Pd2+ ions, with maximum adsorption at pH 4–5. Here, the possible reasons of high adsorption were mainly: (a) the interaction of the lone pairs available on N and S atoms with Pd2+ ions, (b) the Pearson's theory of hard-soft acid–base (HSAB), the soft sulphur and nitrogen atoms as base showed great interaction towards soft acid Pd2+ ions and (c) the insignificant competition between the Pd2+ and H+ for the binding sites at pH above 3.0.3,25
image file: c5ra06265a-f7.tif
Fig. 7 Effects of pH on adsorption of Pd2+ ions by nano-adsorbent at 298 K (conditions: amount of nano-adsorbent 5 mg, sample volume 10 ml Pd2+ (10 mg l−1), equilibrium contact time 10 min).
Effects of nano-adsorbent amount. For the quantitative extraction of Pd2+ ions, the amount of nano-adsorbent remained a crucial criteria. For the analysis, the 10 ml (10 mg l−1) Pd2+ solution at optimum pH was ultrasonicated with fixed amounts of nano-adsorbent and the concentrations of the solutions were checked at an interval of 2, 5 and 10 min. As shown in Fig. S3, ESI both 5 mg and 10 mg of nano-adsorbent showed capabilities to reach their respective adsorption equilibrium within 5 min of ultrasonication. The fast adsorption of Pd2+ ions by both was basically observed due to the presence of large availability of binding sites on nano-adsorbent such that, more than 60 percent adsorption was completed in 2 min. However, taking an increased amount of 10 mg as the optimized amount would require large volume of eluent for desorption of Pd2+ ions. Therefore, 5 mg nano-adsorbent with adsorption equilibrium time of 5 minutes was selected as the best optimized condition for the quantitative adsorption.
Adsorption isotherm and maximum adsorption capacity. For determining the maximum adsorption capacity of the nano-adsorbent, the Langmuir (monolayer) and Freundlich (multilayer) isotherm were studied using the optimized conditions at room temperature. For the investigation, 5 mg of nano-adsorbent with 10 ml of varying concentration (10–100 mg l−1) was ultrasonicated for maximum of 30 minutes to allow the maximum adsorption of Pd2+ ions at room temperature. The data for adsorption equilibrium have reported in Table 1 fitted with Langmuir and Freundlich isotherm eqn (2) and (3).
 
image file: c5ra06265a-t2.tif(2)
 
image file: c5ra06265a-t3.tif(3)
where qe and qm are equilibrium and maximum adsorption capacity (mg g−1), Ce (mg l−1) is equilibrium Pd2+ ions concentration, KL (l mg−1) is the Langmuir constant and related to energy of adsorption. KF is Freundlich isotherm constant and is associated with adsorption capacity and n is Freundlich intensity.
Table 1 Isotherm study of adsorption of nano-adsorbent for Pd2+ ions. (Conditions: nano-adsorbent amount 5 mg, sample volume 10 ml of Pd2+ (100 mg l−1), pH 4.0, ultrasonication time 30 min)
Isotherm models Parameters
Langmuir isotherm qm (mg g−1) 67.11 KL (l mg−1) 0.5539 R2 0.9992
RL 0.017–0.15    
Freundlich isotherm n 3.5 KF 23.86 R2 0.7507
Experimental found qm (mg g−1) 64.8    


As can be seen from Fig. 8 and Table 1, with the higher value of correlation coefficient (R2 > 0.99), the Langmuir isotherm fits well and the adsorption process followed monolayer adsorption with the homogenous distribution of adsorption sites. A dimensionless constant called a separation factor, RL given by eqn (4), related to the Langmuir constant further indicated the adsorption process is favoured36,37 by RL lying between 0 and 1.

 
image file: c5ra06265a-t4.tif(4)
where Ci is the initial concentration of Pd2+. Further, in order to differentiate between physical (physisorption) and chemical (chemisorption) adsorption, the Dubinin–Radushkevich (D–R) model,38 given in eqn (5) was studied.
 
ln[thin space (1/6-em)]qe = ln[thin space (1/6-em)]qmaxβε2 (5)
here, β is the activity coefficient and related to mean adsorption energy and ε is the Polanyi potential, derived from eqn (6).
 
image file: c5ra06265a-t5.tif(6)
T is the temperature (K), R is the gas constant (8.314 J mol−1 K−1). By plotting the graph for eqn (5), β was calculated and used for calculating mean adsorption energy, E (kJ mol−1), i.e., the energy released when the adsorbate transfer to the adsorbent site from the infinity and can be found by the eqn (7). If it lies between the 8–16 kJ mol−1, the adsorption was found to be chemical adsorption otherwise the adsorption occurred through the physical process.
 
image file: c5ra06265a-t6.tif(7)


image file: c5ra06265a-f8.tif
Fig. 8 Linearized plot of Langmuir isotherm for adsorption of Pd2+ on nano-adsorbent (condition: sample volume 10 ml Pd2+ (10–100 mg l−1), nano-adsorbent amount 5 mg, adsorption time 30 min).

From the experiments, the magnitude of the E was found to be 9.55 kJ mol−1, which signified that the adsorption occurred through a chemical process.

Adsorption kinetics. To understand the kinetics and the effect of contact time for Pd2+ ions adsorption with the nano-adsorbent, kinetic models such as the pseudo first order and a pseudo second order were taken for the investigation as given in eqn (8) and (9)
 
ln(qeqt) = ln[thin space (1/6-em)]qek1t (8)
 
image file: c5ra06265a-t7.tif(9)

Although, the equilibrium adsorption reached within 5 minutes, however to ensure the complete adsorption, the ultrasonication was done for 30 minutes. The obtained results were tabulated in Table 2.

Table 2 Kinetic study parameters for adsorption of Pd2+ by nano-adsorbent at 298 K. (Conditions: sample volume 10 ml of Pd2+ (100 mg l−1), pH 4.0, ultrasonication time 30 min)
Model Parameters
Pseudo first order qe,cal (mg g−1) 74.71 k1 (min−1) 0.6796 R2 0.9505
qe,exp (mg g−1) 64.8   χ2 0.3478
Pseudo second order qe,cal (mg g−1) 66.67 k2 (g mg−1 min−1) 0.0274 R2 0.9993
qe,exp (mg g−1) 64.8   χ2 0.0503


As apparent from Fig. 9, high (R2 > 0.99) correlation coefficient suggested that the adsorption followed the pseudo second order kinetic model. Besides, the values of qe (cal.) and qe (exp.) were found to be in agreement with each other. Thus, it would concluded that the adsorption was occurring via a chemisorption process. Further, chi-squares38 values were calculated for the kinetic models, using the eqn (10). The lower value suggested the similarity of the data calculated for the kinetic models with the experimental data.

 
image file: c5ra06265a-t8.tif(10)


image file: c5ra06265a-f9.tif
Fig. 9 Linearized plots of (above) pseudo first order and (below) pseudo second order for adsorption of Pd2+ on nano-adsorbent.

On seeing further in Table 2, with low value of χ2, the pseudo second order model found to be the best model for understanding the kinetics of adsorption of Pd2+ on the surface of nano-adsorbent.

Selection of eluting agent. The selection of eluting agent mainly comprised of those parameters at which the nano-adsorbent showed lesser affinity for adsorption at binding sites. As concluded from the pH study, Pd2+ showed less affinity for adsorption at lower acidic condition. Hence acids such as HCl, HNO3, H2SO4 and its various combinations with thiourea were taken for the elution study. As tabulated in Table S1, ESI 2 ml solution of 0.01 M HCl + 0.2 M thiourea, with equilibration elution time of 2 min was selected as best elution condition for maximum recovery of Pd2+. Here, while HCl removes the Pd2+ ions reversibly, thiourea forms stable complex with Pd2+ due to the presence of S atoms. Thus, the low volume and mild elution parameters made the separation faster and environment friendly.

Thereafter, the selection of acids was done and the acid was chosen in such a way that it did not affect the DAPTS and the core–shell structure of nano-adsorbent. For this, 5 mg of nano-adsorbent was ultrasonicated with 10 ml of HNO3, H2SO4, HCl of varying concentration (0.1–1.0 M) to observe the surface-to-central core stability of the nano-adsorbent. As evident from Table S2 ESI, leaching of Fe occurred from the nano-adsorbent under harsh acidic conditions, which tremendously affected the saturation magnetization value, adsorption capacity, and reusability counts. While in 0.1 M HCl, no such leaching was observed which indicated the stability of nano-adsorbent at the core and surface level.

Effect of interfering ions. From the selection point of view, the nano-adsorbent should be such that it is selectively able to extract Pd2+ ions in the presence of other metal ions and electrolytes. For this, 10 ml solution containing a fixed amount of Pd2+ (1.0 μg ml−1) was taken with varying amounts of added metal ions and electrolytes for the recovery of Pd2+ at optimized parameters. The tolerance limit (maximum amount of added metal ions or electrolytes causing a relative error of not more than 5%) of various added metal ions and electrolytes (Table S3 ESI) suggested no appreciable interference in the quantitative recovery of Pd2+ ions, which supported the selectivity of nano-adsorbent towards the Pd2+ ions.

The possible reasons for the selectivity of nano-adsorbent mainly comprised of (a) low hydration energy of Pd2+ ions compared with other added metal ions and electrolytes, which facilitates its easier availability to active binding sites and (b) active involvement of imine nitrogens, pyridyl nitrogen, and S atom of thiocarbonyl. In fact, Sharma et al. found the significant contribution of these groups for the selective adsorption of Pd2+. Besides, Zhou et al. reported that Pd2+ can form stable complexes with these sites, due to their characteristics of soft bases. The tendency of preferential uptake of Pd2+ on different adsorbents containing imine and thiocarbonyl functional groups has already been reported in other studies. Therefore, complexation appears to be the principal mechanism for the adsorption of Pd2+ ions.30,39–44

Apart from these factors, earlier, Inoue et al. pointed out that the type of supporting material may significantly affect the interaction behaviour of adsorbent. In the present case, the orientation of functional groups present on DAPTS allow stable metal complexation with Pd2+ ions.45

Analytical performance and reusability of the nano-adsorbent. The limit of detection (LOD), accuracy, precision and validity of the nano-adsorbent were evaluated at optimized conditions. A calibration curve was obtained for 10–30 (μg ml−1) standard solutions of Pd2+ with a correlation coefficient of (R2) 0.9998, and having a slope of 0.0085 l μg−1 and an intercept of 0.0064. The detection limit as defined by IUPAC was calculated from three times of standard deviation of a blank (n = 11), and found to be 0.9 (ng ml−1) with relatively a low relative standard deviation (4%).

Apart from that, reusability test was evaluated for the nano-adsorbent. For this, a fixed amount of nano-adsorbent (5 mg) was ultra-sonicated with 10 ml of Pd2+ (100 mg l−1) solution at pH 4 for a maximum adsorption equilibration time of 5 min, washed with double-distilled water and further ultra-sonicated with 2 ml of eluting agent for a maximum elution time of 2 min for the desorption of adsorbed Pd2+ ions. The recovered amount of Pd2+ in terms of qt (mg g−1) was plotted against for first 15 runs with relative standard deviation remained between 1 and 2%. As can be seen in Fig. 10, the nano-adsorbent showed recovery of more than 95% for the first 9 consecutive runs, which decreased to 90% for the 12th run and ultimately decreased to 80% for 15th run.


image file: c5ra06265a-f10.tif
Fig. 10 Reusability runs performance of nano-adsorbent for recovery of Pd2+ at 298 K (experimental conditions: sample solution volume 10 ml, Pd2+ concentration 100 (mg L−1), equilibrium adsorption and desorption time 5 and 2 min, pH 4.0, nano-adsorbent amount 5 mg).

The steady decrease in recovery was possibly expected due to following consequences: (a) decrease in number of active binding sites due to pre-occupancy by Pd2+ ions (b) low acidic elution condition that causes protonation of few active binding atoms with H+. These two unwanted factors effectively impacted the recovery of Pd2+. Further, the use of the ultrasonication technique with mild elution condition and short lifespan of 7 min for 1 adsorption–desorption cycle kept the nano-adsorbent to its originality for a longer time which unargumently help in increasing its reusability. Thus, the nano-adsorbent found to be suitable for the quantitative recovery of Pd2+ at a faster rate with a high number of effective reusability runs.

Application of the nano-adsorbent. The applications of nano-adsorbent mainly consisted of recovery of Pd2+ from (1) catalytic converter samples, (2) water samples from tap water and (3) water samples from commercial drinking water bottles containing a matrix of interfering ions. The observed results have been depicted in Table 3 which clearly show that the DAPTS@NH2@SiO2@Fe3O4 works efficiently in the recovery of Pd2+ ions from various water samples and catalytic converter sample.
Table 3 Application of nano-adsorbent (conditions: nano-adsorbent amount 5 mg, adsorption time 5 min, elution time 2 min, sample volume 10 ml, pH 4, temperature 298 K)
Sample Added (μg) Founda (μg) Recoveryb (%)
a An average of 2 determination.b R.S.D (0.1–1.7%).c Contains Ca2+ (62 μg ml−1), HCO3 (263 μg ml−1), Mg2+ (15 μg ml−1), F (0.2 μg ml−1), Na+ (20 μg ml−1), K+ (2 μg ml−1), NO3 (8 μg ml−1), Cl−1 (8 μg ml−1).d Contains Ca2+ (39 μg ml−1), HCO3 (128 μg ml−1), Mg2+ (6 μg ml−1), Na+ (7 μg ml−1), K+ (7 μg ml−1), Cl−1 (20 μg ml−1).
Catalytic converter 10.2 99.0
10.0 20.0 99.0
20.0 29.7 98.3
40.0 39.2 97.5
Tap water (spiked)  
10.0 9.8 98.0
15.0 14.8 98.6
20.0 19.4 97.0
Water samplec (spiked)  
10.0 9.9 99.0
20.0 19.6 98.0
30.0 29.2 97.3
Water sampled (spiked)  
10.0 9.8 98.0
20.0 19.7 98.5
30.0 29.3 97.6


Comparison with other work. Various analytical outcomes of the present nano-adsorbent, were compared with the reported solid phase extractant, based on different solid support materials. As evident from Table 4, although MIONPs showed faster adsorption of Pd2+ ions yet it suffered from serious limitations such as low adsorption capacity and requirement of higher dosages of adsorbent. The mesoporous adsorbent on the other hand required longer elution time despite exhibiting a high adsorption capacity. In comparison to all these adsorbents, DAPTS@NH2@SiO2@Fe3O4 possessed a higher adsorption capacity, lesser adsorption–desorption time and required low dosages of adsorbent. All these factors collectively established the supremacy of newly fabricated magnetic silica based core–shell DAPTS@NH2@SiO2@Fe3O4 nano-adsorbent.
Table 4 Comparison of nano-adsorbent with various others reported solid adsorbents at optimized parameters
Adsorbent type (amounta) Adsorption capacity (mg g−1) Adsorption/desorption time (min) Desorption condition LODd (ng ml−1) Ref.
a Amount of adsorbent taken for adsorption.b Magnetic iron oxide nanoparticles.c Amount of Pd2+ recovered in 5 cycles of adsorption–desorption taking a total time of 35 min.d LOD limit of detection.
Fe3O4 NPs (10) 10.96 60/120 0.5 M HNO3 21
Ethylenediamine modified magnetic cross-linking chitosan NPs (50) 138.0 40/— 0.4 M HNO3 + 1.0 M thiourea 22
MIONPsb (20) 27.2 2/— 1.0 M HCl 2.9 23
Pyridine functionalized MIONPs (15) 42.0 4/5 0.4 M HCl + 0.5 M thiourea 0.15 24
Murexide functionalized halloysite nano-tube (10) 42.86 5/— 0.01 M HCl + 3% thiourea 0.29 2
6-((2-(2-hydroxy-1-naphthoyl)hydrazono)methyl)benzoic acid based mesoporous adsorbent (8) 172.53 40/30 0.1 M HCl + 0.1 M thiourea 0.11 25
DAPTS@NH2@SiO2@Fe3O4 (5) 64.8 (322.82)c 5/2 0.01 M + 0.2 M thiourea 0.9 Present study


Conclusion

In conclusion, we have successfully developed a novel and highly efficient, magnetically driven solid phase nano-adsorbent through the covalent immobilization of 2,6-diacetylpyridine monothiosemicarbazide on amine functionalized silica encapsulated magnetic nanoparticles for the determination and extraction of Pd2+ from different water samples and wastes of catalytic converter. The DAPTS@NH2@SiO2@Fe3O4 shows excellent selectivity towards Pd2+ ions because of presence of well oriented binding groups and favourable experimental conditions. Besides, the newly fabricated nano-adsorbent offers several other advantages such as high adsorption capacity, less adsorption–desorption time, mild elution conditions that results in higher reusability and low adsorbent dosage. Additionally, the incorporation of ultrasonic irradiation in the adsorption–desorption process promotes faster recovery of Pd2+ without damaging the structural properties of nano-adsorbent. Thus, the collective contribution of superior efficiency, selectivity and reusability of the DAPTS@NH2@SiO2@Fe3O4 nano-adsorbent renders this protocol highly competent in comparison to the literature precedents.

Acknowledgements

One of the authors, Harish Kumar thank the University Grant Commission (UGC), Delhi, India, for the award of Senior Research Fellowship. The authors also thank USIC-CLF, DU, Delhi, India for FE-SEM and XRD analysis.

Notes and references

  1. M. Safdarian, P. Hashemi and M. Adeli, Anal. Chim. Acta, 2013, 774, 44–50 CrossRef CAS PubMed.
  2. R. Li, Q. He, Z. Hu, S. Zhang, L. Zhang and X. Chang, Anal. Chim. Acta, 2012, 713, 136–144 CrossRef CAS PubMed.
  3. M. R. Awual, T. Yaita, S. A. El-Safty, H. Shiwaku, Y. Okamoto and S. Suzuki, Chem. Eng. J., 2013, 222, 172–179 CrossRef CAS PubMed.
  4. M. Marafi and A. Stanislaus, Resour., Conserv. Recycl., 2008, 52, 859–873 CrossRef PubMed.
  5. A. Troupis, A. Hiskia and E. Papaconstantinou, Appl. Catal., B, 2004, 52, 41–48 CrossRef CAS PubMed.
  6. M. V. Balarama Krishna, M. Ranjit, K. Chandrasekaran, G. Venkateswarlu and D. Karunasagar, Talanta, 2009, 79, 1454–1463 CrossRef PubMed.
  7. N. Ozturk, V. N. Bulut, C. Duran and M. Soylak, Desalination, 2011, 270, 130–134 CrossRef CAS PubMed.
  8. M. Ghaedi, A. Shokrollahi, K. Niknam, A. Najibi and M. Soylak, J. Hazard. Mater., 2009, 168, 1022–1027 CrossRef CAS PubMed.
  9. A. N. Anthemidis, D. G. Thermelis and J. A. Stratis, Talanta, 2001, 54, 37–43 CrossRef CAS.
  10. S. Daniel, R. S. Praveen and T. P. Rao, Anal. Chim. Acta, 2006, 570, 79–87 CrossRef CAS PubMed.
  11. F. Shemirani and B. Majidi, Food Chem. Toxicol., 2010, 48, 1455–1460 CrossRef PubMed.
  12. R. K. Sharma and P. Pant, J. Hazard. Mater., 2009, 163, 295–301 CrossRef CAS PubMed.
  13. R. K. Sharma and P. Pant, Int. J. Environ. Anal. Chem., 2009, 89, 503–514 CrossRef CAS PubMed.
  14. S. Sadeghi, H. Azhdari, H. Arabi and A. Z. Moghaddam, J. Hazard. Mater., 2012, 215–216, 208–216 CrossRef CAS PubMed.
  15. F. L. Fan, Z. Qin, J. Bai, W. D. Rong, F. Y. Fan, W. Tian, X. L. Wu, Y. Wang and L. Zhao, J. Environ. Radioact., 2012, 106, 40–46 CrossRef CAS PubMed.
  16. T. Poursaberi, M. Hassanisadi, K. Torkestani and M. Zare, Chem. Eng. J., 2012, 189–190, 117–125 CrossRef CAS PubMed.
  17. Y. Y. Xu, M. Zhou, H. J. Geng, J. J. Hao, Q. Q. Qu, S. D. Qi, H. L. Chen and X. G. Chen, Appl. Surf. Sci., 2012, 258, 3897–3902 CrossRef CAS PubMed.
  18. F. Ge, M. M. Li, H. Ye and B. X. Zhao, J. Hazard. Mater., 2012, 211–212, 366–372 CrossRef CAS PubMed.
  19. T. Madrakian, A. Afkhami and M. Ahmadi, Chemosphere, 2013, 90, 542–547 CrossRef CAS PubMed.
  20. J. Ye, S. Liu, M. Tian, W. Li, B. Hu, W. Zhou and Q. Jia, Talanta, 2014, 118, 231–237 CrossRef CAS PubMed.
  21. A. Uheidaa, M. Iglesias, C. Fontàs, M. Hidalgo, V. Salvadó, Y. Zhang and M. Muhammed, J. Colloid Interface Sci., 2006, 301, 402–408 CrossRef PubMed.
  22. L. Zhou, J. Xu, X. Liang and Z. Liu, J. Hazard. Mater., 2010, 182, 518–524 CrossRef CAS PubMed.
  23. S. Z. Mohammadi, M. A. Karimi, H. Hamidian, Y. M. Baghelani and L. Karimzadeh, Sci. Iran., Trans. F, 2011, 18(6), 1636–1642 CrossRef CAS PubMed.
  24. A. Bagheri, M. Behbahani, M. M. Amini, O. Sadeghi, A. Tootoonchi and Z. Dahaghin, Microchim. Acta, 2012, 178, 261–268 CrossRef CAS.
  25. M. R. Awual, I. M. M. Rahman, T. Yaita, M. A. Khaleque and M. Ferdows, Chem. Eng. J., 2014, 236, 100–109 CrossRef CAS PubMed.
  26. R. K. Sharma, A. Pandey, S. Gulati and A. Adholeya, J. Hazard. Mater., 2012, 209–210, 285–292 CrossRef CAS PubMed.
  27. R. K. Sharma, A. Pandey, S. Gulati and A. Adholeya, Chem. Eng. J., 2012, 210, 490–499 CrossRef CAS PubMed.
  28. R. K. Sharma, A. Puri, A. Kumar and A. Adholeya, J. Environ. Sci., 2013, 25(6), 1251–1261 Search PubMed.
  29. R. K. Sharma, A. Puri, A. Kumar, Y. Monga, G. Gaba and A. Adholeya, Sep. Sci. Technol., 2014, 49(5), 709–720 CrossRef CAS PubMed.
  30. R. K. Sharma, A. Puri, Y. Monga and A. Adholeya, J. Mater. Chem. A, 2014, 2, 12888–12898 CAS.
  31. J. S. Casasa, E. E. Castellanob, M. S. Garcia-Tasende, A. Sancheza, J. Sordoa and J. Zukerman-Schpector, Z. Anorg. Allg. Chem., 1997, 623, 825–831 CrossRef PubMed.
  32. V. Polshettiwar and R. S. Varma, Org. Biomol. Chem., 2009, 7, 37–40 CAS.
  33. Z. Zhang, F. Zhang, Q. Zhu, W. Zhao, B. Ma and Y. Ding, J. Colloid Interface Sci., 2011, 360, 189–194 CrossRef CAS PubMed.
  34. M. Kokate, K. Garadkar and A. Gole, J. Mater. Chem. A, 2013, 1, 2022–2029 CAS.
  35. L. M. Rossi, F. P. Silva, L. L. R. Vono, P. K. Kiyohara, E. L. Duarte, R. Itri, R. Landers and G. Machado, Green Chem., 2007, 9, 379–385 RSC.
  36. H. Yong-Mei, C. Man and H. Zhong-Bo, J. Hazard. Mater., 2010, 184, 392–399 CrossRef PubMed.
  37. B. H. Hameed, D. K. Mahmoud and A. L. Ahmad, J. Hazard. Mater., 2008, 158, 65–72 CrossRef CAS PubMed.
  38. H. K. Boprai, M. Joseph and D. M. O'Carroll, J. Hazard. Mater., 2011, 186, 458–465 CrossRef PubMed.
  39. R. K. Sharma, A. Pandey and S. Gulati, Appl. Catal., A, 2012, 431–432, 33–41 CrossRef CAS PubMed.
  40. L. Zhou, J. Xua, X. Lianga and Z. Liu, J. Hazard. Mater., 2010, 182, 518–524 CrossRef CAS PubMed.
  41. M. R. Jamali, Y. Assadi, F. Shemirani and M. Salavati-Niasari, Talanta, 2007, 71, 1524–1529 CrossRef CAS PubMed.
  42. B. Godlewska-Zyłkiewicz, B. Lesniewska and I. Wawreniuk, Talanta, 2010, 83, 596–604 CrossRef PubMed.
  43. Y. Jiang and D. Kim, Chem. Eng. J., 2013, 232, 503–509 CrossRef CAS PubMed.
  44. S. Sharma and N. Rajesh, Chem. Eng. J., 2014, 241, 112–121 CrossRef CAS PubMed.
  45. K. Inoue, K. Yoshizuka and K. Ohto, Anal. Chim. Acta, 1999, 388, 209–218 CrossRef CAS.

Footnote

Electronic supplementary information (ESI) available. See DOI: 10.1039/c5ra06265a

This journal is © The Royal Society of Chemistry 2015