
 Open Access Article
 This Open Access Article is licensed under a
 Creative Commons Attribution 3.0 Unported Licence
Thermal runaway of commercial 18650 Li-ion batteries with LFP and NCA cathodes – impact of state of charge and overcharge
Andrey W.
Golubkov
 *a,
Sebastian
Scheikl
a,
René
Planteu
a,
Gernot
Voitic
b,
Helmar
Wiltsche
c,
Christoph
Stangl
d,
Gisela
Fauler
d,
Alexander
Thaler
a and
Viktor
Hacker
b
*a,
Sebastian
Scheikl
a,
René
Planteu
a,
Gernot
Voitic
b,
Helmar
Wiltsche
c,
Christoph
Stangl
d,
Gisela
Fauler
d,
Alexander
Thaler
a and
Viktor
Hacker
b
aKompetenzzentrum – Das Virtuelle Fahrzeug Forschungsgesellschaft mbH, Inffeldgasse 21a, A-8010 Graz, Austria. E-mail: andrej.golubkov@alumni.tugraz.at
bInstitute of Chemical Engineering and Environmental Technology, Graz University of Technology, Inffeldgasse 25/C/II, 8010 Graz, Austria
cInstitute of Analytical Chemistry and Food Chemistry, Graz University of Technology, Stremayrgasse 9/III, 8010 Graz, Austria
dVarta Micro Innovation GmbH, Stremayrgasse 9, 8010 Graz, Austria
First published on 22nd June 2015
Abstract
Thermal runaway characteristics of two types of commercially available 18650 cells, based on LixFePO4 and Lix (Ni0.80Co0.15Al0.05)O2 were investigated in detail. The cells were preconditioned to state of charge (SOC) values in the range of 0% to 143%; this ensured that the working SOC window as well as overcharge conditions were covered in the experiments. Subsequently a series of temperature-ramp tests was performed with the preconditioned cells. Charged cells went into a thermal runaway, when heated above a critical temperature. The following thermal runaway parameters are provided for each experiment with the two cell types: temperature of a first detected exothermic reaction, maximum cell temperature, amount of produced ventgas and the composition of the ventgas. The dependence of those parameters with respect to the SOC is presented and a model of the major reactions during the thermal runaway is made.
1 Introduction
Li-ion batteries1,2 excel in energy density and cycle life. Unfortunately those benefits come with a price: when Li-ion batteries are mistreated with high over-temperature or strong overcharge, they can transit into a so-called thermal runaway. During the thermal runaway, the battery temperature increases due to exothermic reactions. In turn, the increased temperature accelerates those degradation reactions and the system destabilizes. At the end of the thermal runaway, battery temperatures higher than 1000 °C can be reached and high amounts of burnable and harmful gases can be released.Because Li-ion batteries are widely used, the possible hazards of Li-ion batteries are a key issue for automotive, aerospace and consumer electronics industries. The safety characteristics of Li-ion battery systems depend (a) on the used cell type (geometry, materials), (b) on the initial conditions before misuse (state of charge, ageing effects), (c) on the type of misuse (over-temperature, over-charge) and (d) on external measures (built-in safety devices, forced cooling, confinement).3–5
In the past, accelerated rate calorimetry (ARC) tests with limited maximum temperature6–12 and without limitation13 as well as fire experiments and mechanical abuse14–17 with complete Li-ion cells were done. Recently over-temperature and over-charge tests with large format cells (which may be used for automotive applications) were published.18–20 It is known that the severity of the thermal runaway event in over-temperature experiments increases with increasing SOC.4,21–27 It is also known, that a thermal runaway can be triggered by strong overcharge beyond safe voltage limits of the cell.28–34 Even if the overcharge condition does not trigger a thermal runaway, safety may be compromised by Li-plating on the anode.35
In our previous publication36 the safety characteristics of three different commercial Li-ion batteries charged to 100% SOC were investigated. It was demonstrated, that cells with cathodes based on iron-phosphate as well as on metal-oxide material exhibit a thermal runaway in thermal-ramp experiments. The severity of the thermal runaway showed a strong dependence on the material composition of the cells.
In this publication two cell types are introduced and the mass inventory of the cells is calculated based on tear down results. The thermal runaway testing method is explained and the outcomes of experiments with discharged, partially charged, fully charged and over-charged cells are presented. Possible chemical reactions are listed and quantitative calculations of ventgas generation are made for two cases.
2 Samples
The two types of commercially available Li-ion batteries, with the geometrical format 18650, were purchased from two well known manufacturers. The first cell, rated to a nominal capacity of Cnom = 1.1 A h is based on a LixFePO4 (LFP) cathode. The LFP material is considered as relatively safe. Unfortunately commercial LFP-based cells have lower capacity and nominal voltage compared to metal-oxide based cells. According to the datasheet the LFP cell is designed for a maximum discharge current of 30 A and has a cycle life of >1000 full discharge cycles.The second cell has a much higher nominal capacity Cnom = 3.35 A h and is based on a Lix(Ni0.80Co0.15Al0.05)O2 (NCA) cathode. To our knowledge, this mass produced cell has the highest energy density which is commercially available as of 2013. It is specified to a maximum discharge current of 6.7 A h and its cycle life is >300 cycles.
In the following, the two cell types will be denoted as LFP and NCA for easy reading.
2.1 Cell composition, methods
For the interpretation of the misuse experiment results it is beneficial to know the mass split of the cell components. Unfortunately information regarding detailed cell composition is kept confidential by the manufacturers. We had to make a tear down and an analysis of the cell components for both cell species by ourselves. The following parameters were measured directly using the same methods and equipment as in ref. 36:• Mass of the anode and cathode coating, the electrolyte, the current collector foils, the separator and the housing material.
• The solvent mass-ratios of the electrolyte. Detected solvents were dimethyl carbonate (DMC), ethyl methyl carbonate (EMC), ethylene carbonate (EC), propylene carbonate (PC) and methyl phenyl carbonate (MPC).
• The mole-ratios of the different transition metals and phosphor in the cathode coating.
Additionally, separator foils were examined with differential scanning calorimetry coupled with thermal gravimetric analysis (DSC-TGA, NETZSCH STA 449 C). Separator samples were rinsed with diethyl carbonate and dried in a desiccator for 12 hours. During the test the DSC-TGA was flushed with and the heat ramp was set to 10 K min−1.
2.2 Cell composition, results and discussion
It is not in the scope of this work to compile an exhaustive material inventory of the two commercial cell types. Nevertheless, to obtain some insight into chemical reactions taking place during cell misuse, it is helpful to make at least rough estimations for cell components that were not accessible to direct measurements (Table 1). Estimations for the amount and composition of active material, particle coating, binder, carbon black and the SEI in the electrode coatings as well as for the amount of salt, additives and soluble SEI in the electrolyte were discussed with our project partners. Effects of cell formation were considered. The compositions of the separators were estimated from DSC measurements.| Component | NCA cell | LFP cell | ||||||||||
|---|---|---|---|---|---|---|---|---|---|---|---|---|
| Mass ratio | Mass (g) | Formula | M (g mol−1) | n (mmol) | Li-capacity (A h) | Mass ratio | Mass (g) | Formula | M (g mol−1) | n (mmol) | Li-capacity (A h) | |
| Cathode coating: | ||||||||||||
| Active material | 95.0% | 17.04 | Li0.925(Ni0.80Co0.15Al0.05)O2 | 95.6 | 178.2 | 4.78 | 80.0% | 7.73 | Li0.882FePO4 | 156.9 | 49.2 | 1.32 |
| Particle coating | — | — | — | — | — | 10.0% | 0.97 | C | 12.0 | 80.5 | ||
| Carbon black | 2.5% | 0.45 | C | 12.0 | 37.4 | 5.0% | 0.48 | C | 12.0 | 40.2 | ||
| Binder (PVDF) | 2.5% | 0.45 | (C2H2F2)n | 64.0 | 7.0 | 5.0% | 0.48 | (C2H2F2)n | 64.0 | 7.5 | ||
| Sum | 100% | 17.93 | 100% | 9.66 | ||||||||
![[thin space (1/6-em)]](https://www.rsc.org/images/entities/char_2009.gif) |
||||||||||||
| Anode coating: | ||||||||||||
| Graphite | 93.5% | 10.92 | Li0.008C6 | 72.1 | 151.5 | 4.06 | 93.5% | 4.84 | Li0.006C6 | 72.1 | 67.2 | 1.80 |
| Binder (CMC) | 5.0% | 0.58 | (C7.4H10.7O6.4)n | 202.1 | 2.9 | 5.0% | 0.26 | (C7.4H10.7O6.4)n | 202.1 | 1.3 | ||
| SEI, lithium fluoride | 0.4% | 0.04 | LiF | 25.9 | 1.7 | 0.4% | 0.02 | LiF | 25.9 | 0.8 | ||
| SEI, lithium carbonate | 1.1% | 0.13 | Li2CO3 | 73.9 | 1.7 | 1.1% | 0.06 | Li2CO3 | 73.9 | 0.8 | ||
| Sum | 100.0% | 11.67 | 100.0% | 5.18 | ||||||||
|
||||||||||||
| Separator: | ||||||||||||
| PP | — | — | — | — | — | 66% | 0.76 | (C3H6)n | 42.1 | 18.0 | ||
| PE | — | — | — | — | — | 34% | 0.39 | (C2H4)n | 28.1 | 13.9 | ||
| UHMWPE | 100% | 0.70 | (C2H4)n | 28.1 | 25.0 | — | — | — | — | — | ||
| Sum | 100% | 0.70 | 100% | 1.15 | ||||||||
|
||||||||||||
| Electrolyte: | ||||||||||||
| SEI, polymer organic | 2.0% | 0.09 | (C6H4O6)n | 86.1 | 1.0 | 2.0% | 0.13 | (C6H4O6)n | 172.1 | 0.7 | ||
| SEI, organic | 12.7% | 0.56 | (CH2OCO2Li)2 | 162.0 | 3.5 | 3.9% | 0.25 | (CH2OCO2Li)2 | 162.0 | 1.5 | ||
| EC | 17.1% | 0.75 | C3H4O3 | 88.1 | 8.5 | 24.8% | 1.59 | C3H4O3 | 88.1 | 18.1 | ||
| DMC | 49.7% | 2.19 | C3H6O3 | 90.1 | 24.3 | 33.0% | 2.12 | C3H6O3 | 90.1 | 23.5 | ||
| EMC | 5.3% | 0.23 | C4H8O3 | 104.1 | 2.2 | 16.5% | 1.06 | C4H8O3 | 104.1 | 10.2 | ||
| PC | — | — | — | — | — | 8.3% | 0.53 | C4H6O3 | 102.1 | 5.2 | ||
| MPC | 2.7% | 0.12 | C8H8O3 | 196.1 | 0.6 | — | — | — | — | — | ||
| Salt | 10.6% | 0.46 | LiPF6 | 151.9 | 3.1 | 11.5% | 0.74 | LiPF6 | 151.9 | 4.9 | ||
| Sum | 100.0% | 4.41 | 100.0% | 6.41 | ||||||||
|
||||||||||||
| Inactive components: | ||||||||||||
| Housing (metal can) | 5.71 | 10.45 | ||||||||||
| Cathode Al foil | 1.20 | 2.14 | ||||||||||
| Anode Cu foil | 2.72 | 3.86 | ||||||||||
| Other components | 1.05 | — | ||||||||||
| Sum | 10.69 | 16.46 | ||||||||||
| Total sum | 45.40 | 38.87 | ||||||||||
Additionally a conducting agent is needed to improve the electrical conductivity between the cathode particles and cathode substrate-foil. We suppose that 2.5% (NCA) or 5% (LFP) of cathode coating consists of carbon black. We justify the increased amount of binder and conducting agent of the LFP cell with its higher power capability.
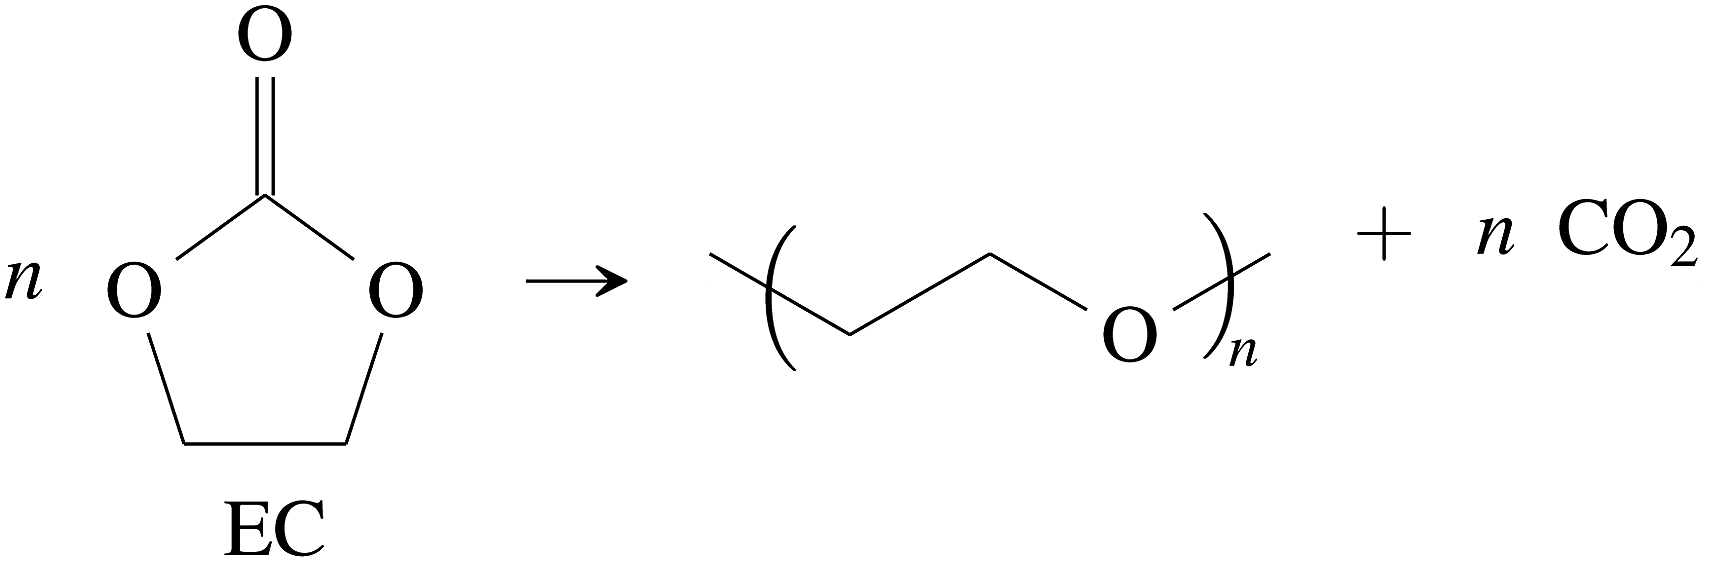
Vinylene carbonate (VC) is a common solid electrolyte interface (SEI) improving additive.41 We assume that 2% of VC was added to the electrolyte.42 During initial charging VC and EC undergo reduction reactions and form the SEI at the surface of the graphite particles of the anode. A fully developed SEI prevents further reduction of the electrolyte solvents.43 The SEI composition and formation reactions can be complicated41,44,45 and lie beyond the scope of this work. Instead, for further calculations, we treat the SEI as being made of only four components:
(1) The polymerization product of VC41,46
 | (1) |
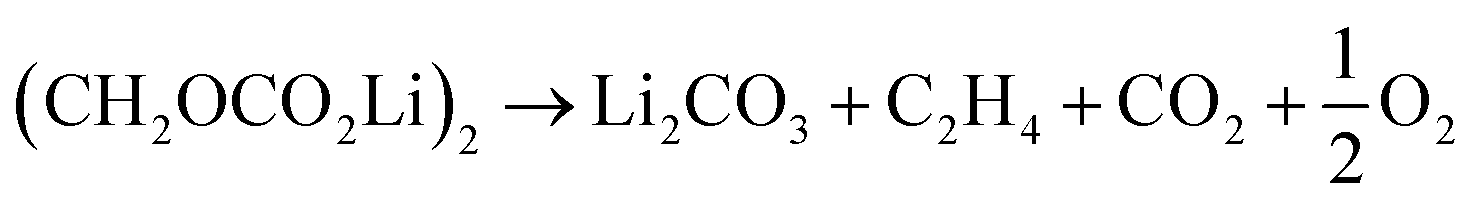
(2) The organic Li-carbonate from EC reduction47–49
| 2C3H4O3 (EC) + 2Li+ + 2e− → (CH2OCO2Li)2 + C2H4 | (2) |
(3) The inorganic Li-carbonate Li2CO3 from EC reduction50–52
| C3H4O3 (EC) + 2Li+ + 2e− → Li2CO3 + C2H4 | (3) |
(4) And LiF which can be produced from decomposition of the salt and the Li-carbonate53
 | (4) |
We assume that all VC (2% of electrolyte) goes into polymerization (1) and that the additional SEI components (CH2OCO2Li)2:Li2CO3:LiF are in the ratio 1/2:1/4:1/4.44 The components of the SEI are listed (Table 1) as a part of either anode or electrolyte depending on their solubility in the electrolyte solvent.54 To calculate the actual amounts of lithium containing SEI we need to take the irreversible capacity loss into account.
 | (5) |
| Cirr = FnirrLi | (6) |
 is the amount of graphite units C6 in the anode (in mol). We assumed that all trapped lithium is integrated and immobilized in the SEI according to the chemical reactions (2)–(4). The calculated values for the NCA and LFP cell are nirrLi(NCA) = 12.1 mmol and nirrLi(LFP) = 5.4 mmol respectively. As a consequence, after formation, the cathode can never again be fully lithiated. Even when the cell is fully discharged, nirrLi is missing, and the amount of Li per stoichiometric formula in the cathode is <1. The effect of the missing lithium nirrLi (proportional to Cirr) in the cathode is taken into account in further stoichiometric calculations.
| Cres = 0.01Cnom | (7) |
| nresLi = 1/FCres | (8) |
The amount of residual lithium is considered in further calculation of the lithiation states of both electrodes.
2.3 Available capacities in the electrodes
With identified amount of active cathode material nacat and with known Cirr and Cres the theoretically usable capacity of the cathode after cell formation can be calculated| Cucat = Fnacat − Cirr − Cres | (9) |
In the case of LFP cell Cucat = 1.16 A h. In theory, LFP material can be fully delithiated, and Cucat should be equal to Cnom. In our work, the calculated Cucat exceeded Cnom. According to the data sheet the LFP cell is rated to Cnom = 1.1 A h and the measured capacities in the allowed voltage range were even smaller (Fig. 1). The discrepancy may be caused by incomplete utilization of the LFP material of a real cell or by ageing effects of the cathode.
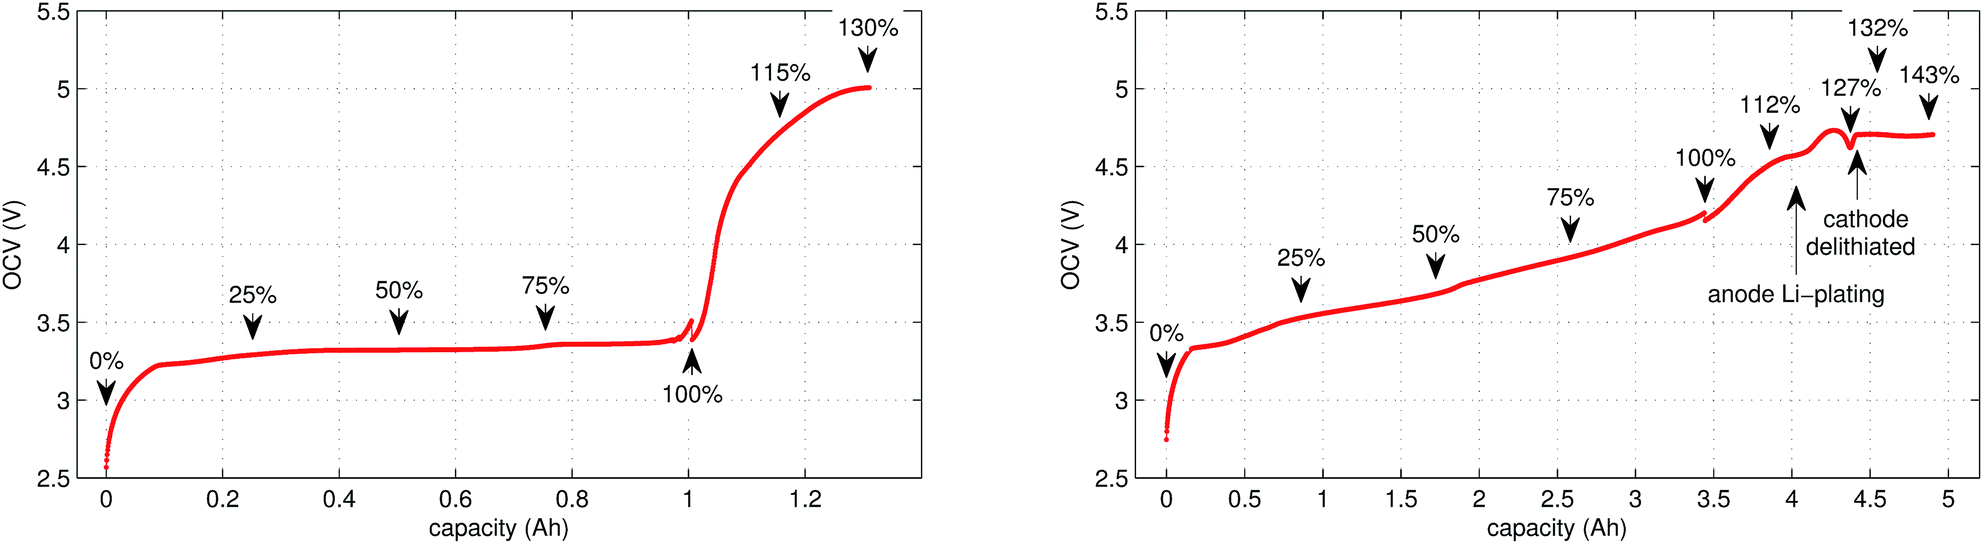 | ||
| Fig. 1 OCV characteristics of the (left) LFP and (right) NCA cells. Measured values in the allowed voltage range and additionally in the overcharge region are given. SOC points, at which temperature-ramp experiments were done, are marked. Rough estimates, where Li-plating and complete cathode delithiation may occur, are indicated for the NCA cell. The discontinuities at 100% are caused by relaxations during the time-gaps between cycling and the overcharge experiments. | ||
It is noteworthy that the available capacity of the LFP anode
 | (10) |
In contrast to LFP, the NCA cathodes should not be fully delithiated during normal operation. Correspondingly, the theoretically available capacity of the NCA cell of 4.42 A h was higher than the nominal capacity 3.35 A h. The calculated capacity of the active material in the anode was 4.06 A h. That means the NCA anode was slightly overbalanced by 21%.
The separator of the NCA cell showed only one indistinct endothermic peak at ∼130 °C. We assume that the NCA separator consists of ultra-high molecular weight polyethylene (UHMWPE) membrane.57,58
3 Experimental
In this work a total of 23 thermal ramp experiments with the two cell types were done at different SOC. Each experiment consisted of the following steps; the cell underwent a open circuit voltage (OCV) check, was charged to the selected SOC and inserted into the sample holder. The sample holder was attached inside a sealed reactor and the thermal ramp experiment was started (the test-rig and thermal ramp method is described in ref. 36). After the thermal ramp experiment gas samples were taken and analysed.3.1 Initial OCV check
We applied the same OCV measurement procedure as in ref. 36. Each sample was fully discharged to 0% SOC (2.5 V) and then fully charged to 100% SOC (LFP: 3.5 V, NCA: 4.2 V). The health status of the cells was checked by comparing the measured capacities with the nominal capacity from the manufacturer. Typical OCV profiles are given in Fig. 1. BaSyTec CTS cell test system and Heiden Power DC-source-load were used for battery cycling.3.2 Sample preparation
After the OCV check the insulation foil was stripped from the cell and the sample was weighed. Three K-type thermocouples were spot-welded to the cell housing. Then the sample was wrapped in a thermal insulation layer and inserted into the heating sleeve of the sample holder. Finally, the sample holder was installed inside the reactor, the electrical connections were made and the reactor was sealed.3.3 SOC set-point
The cell was brought to the desired SOC by charging or discharging, starting from 100% SOC. The coulomb counting method was used for SOC calculation and the charge/discharge was stopped when the required SOC was reached. For experiments with SOC < 100% the cell was discharged outside of the reactor. For SOC > 100% the cell was overcharged inside the reactor, for safety reasons. In order to prevent cell heating, the overcharge current was set to very low values. The SOC set-points of all experiments are marked in Fig. 1.3.4 Thermal-ramp experiment
The sealed reactor was evacuated and flushed with inert gas. The heaters were turned on. The sample inside the reactor was heated slowly with a rate of 2 °C min−1 (NCA) or 4 °C min−1 (LFP). Cell temperatures, gas temperatures and the pressure in the sealed reactor were recorded. At some point the cell transited into thermal runaway and ventgas was released in the reactor. The amount of gas inside the reactor nidealsum was calculated using the ideal gas law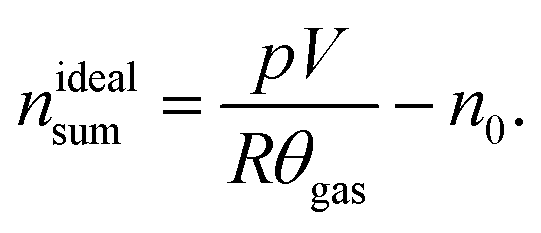 | (11) |
Here p denotes the pressure in the reactor, V = 0.0027 m3 is the reactor volume, R is the gas constant, θgas is the gas temperature in the reactor (in K) and n0 is the initial amount of gas in the reactor at the start of the experiment.
The eqn (11) is only valid, when θgas is equal to the mean gas temperature in the reactor. During the thermal runaway a violent cell venting may take place and hot gases are released into the pressure vessel. In the first seconds after venting, when the gas temperature inside the reactor is not homogeneous, nidealsum may be over or underestimated. Thus, given nidealsum values were calculated when the gas temperature was in equilibrium.
3.5 Ventgas analysis
Gas samples were taken after the thermal runaway reaction. If no thermal runaway occurred, then the gas samples were taken after the cell temperature exceeded 250 °C. The gas was analysed with a gas chromatograph system (GC, Agilent Technologies 3000 Micro GC, two columns, Mol Sieve and PLOTU). A thermal conductivity detector (TCD) was used to detect permanent gases. The GC was calibrated for H2, O2, N2, CO, CO2, CH4, C2H2, C2H4 and C2H6. The GC used Ar and He as carrier gases.3.6 Role of the inert gas
Before each experiment, the reactor was filled with inert gas to prevent reactions of the vent-gas with the reactor atmosphere. We used either N2 or Ar as inert gas. Both gases have advantages and disadvantages.• Advantages of using Ar as inert gas: in this case N2 is not present in the reactor. There are no reactions which can produce N2 during thermal runaway. The only possible source of N2 in a ventgas sample is leakage from ambient air. Therefore, the presence of N2 (accompanied by O2) in the GC results indicates gas leakage. The amount of Ar in the samples could not be quantified, because it was used as a carrier gas in the GC setup.
• Advantages of using N2 as inert gas: in this case N2 fulfils two functions. It serves as inert gas and also as an internal standard. Since the amount of N2 in the reactor is known (VN2 = 0.0027 m3), absolute amounts of other detected gas components can be derived from their relative GC results rGCi
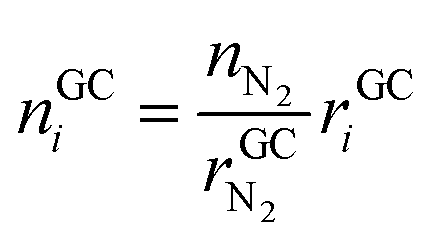 | (12) |
The absolute amount of vent-gas nGCsum can be calculated from the GC results.
 | (13) |
The amount of ventgas calculated with the ideal gas eqn (11) can be compared with the total amount of gas from GC results (13). If nidealsum = nGCsum than it is likely, that all formed gases were detected by the GC.
However, there is also one strong disadvantage of using N2. If leaks from ambient air occur, leaked N2 falsifies the internal standard. Therefore, for the most experiments we used Ar as inert gas in the reactor and detected N2 indicated gas leaks. Only in the last three experiments, after enough experience was gained, we were confident to use N2 as the inert gas.
4 Results
We did 23 thermal-ramp experiments with NCA and LFP cells set to different SOC. The results are summarized in Tables 2 and 3. Typical experiment runs are shown in Fig. 2 and 4. The dependence of the thermal runaway parameters on the SOC is visualised in Fig. 3 and 5.| No. | Cell | SOC (%) | θ R (°C) | θ m (°C) | Δm (g) | n idealsum (mmol) | H2 (%) | CO2 (%) | CO (%) | CH4 (%) | C2H4 (%) | C2H6 (%) |
|---|---|---|---|---|---|---|---|---|---|---|---|---|
| 1 | NCA | 0 | — | 302 | — | 65 | 1.7 | 94.6 | 1.6 | 1.6 | 0.3 | — |
| 2 | NCA | 0 | 160 | 316 | 4.4 | 52 | 1.8 | 94.7 | 1.9 | 1.2 | 0.4 | — |
| 3 | NCA | 0 | 160 | 315 | 4.5 | 55 | 1.2 | 96 | 1.5 | 1.1 | 0.2 | — |
| 4 | NCA | 0 | 161 | 214 | 4.4 | 39 | 0.9 | 96.2 | 1.1 | 1.4 | 0.3 | — |
| 5 | NCA | 0 | 150 | 243 | 4.4 | 59 | 0.8 | 96.6 | 1 | 1.3 | 0.3 | — |
| 6 | NCA | 25 | 150 | 739 | 5.9 | 67 | 15.5 | 62.7 | 5.5 | 8.7 | 7.5 | — |
| 7 | NCA | 50 | 140 | 970 | 8.5 | 157 | 17.5 | 33.8 | 39.9 | 5.2 | 3.2 | 0.4 |
| 8 | NCA | 75 | 140 | 955 | — | 217 | 24.2 | 20.8 | 43.7 | 7.5 | 3.3 | 0.5 |
| 9 | NCA | 100 | 144 | 904 | — | 273 | 22.6 | 19.7 | 48.9 | 6.6 | 2.4 | — |
| 10 | NCA | 100 | 138 | 896 | 20.5 | 314 | 26.1 | 17.5 | 44 | 8.9 | 2.7 | 0.9 |
| 11 | NCA | 100 | 136 | 933 | 20.9 | 244 | 28.5 | 22.7 | 41.5 | 5.9 | 1.3 | 0.3 |
| 12 | NCA | 112 | 144 | — | 19.2 | 252 | 25.1 | 18.8 | 48.1 | 5.9 | 2.1 | — |
| 13 | NCA | 120 | 80 | 929 | — | 281 | 23.5 | 20.8 | 48.7 | 5.4 | 1.6 | — |
| 14 | NCA | 127 | 80 | 983 | — | 317 | 28.8 | 16.2 | 46.6 | 6.4 | 1.3 | 0.3 |
| 15 | NCA | 132 | 80 | 943 | 17 | 262 | 25.8 | 18.9 | 49.2 | 4.7 | 1.4 | — |
| 16 | NCA | 143 | 65 | 1075 | 20.1 | 303 | 26.2 | 22 | 43.4 | 6.9 | 1.5 | — |
| 17 | LFP | 0 | — | 251 | 6.1 | 55 | 2.7 | 93.5 | 1.8 | 0.7 | 0.7 | 0.7 |
| 18 | LFP | 25 | 195 | 231 | 6.1 | 31 | 7.1 | 85.3 | 3.1 | 1.2 | 3.1 | 0.2 |
| 19 | LFP | 50 | 130 | 283 | 6.1 | 32 | 20.8 | 66.2 | 4.8 | 1.6 | 6.6 | — |
| 20 | LFP | 75 | 149 | 362 | 6.3 | 41 | 21.8 | 62.6 | 6.4 | 1.9 | 6.3 | 1 |
| 21 | LFP | 100 | 140 | 440 | 7.1 | 32 | 29.4 | 48.3 | 9.1 | 5.4 | 7.2 | 0.5 |
| 22 | LFP | 115 | 155 | 395 | 6.2 | 61 | 34 | 52.2 | 6.4 | 2.6 | 4.7 | 0.1 |
| 23 | LFP | 130 | 80 | 448 | — | 58 | 30.1 | 55.8 | 7.7 | 6.4 | — | — |
| No. | SOC (%) | n idealsum (mmol) | n GCsum (mmol) | H2 (mmol) | CO2 (mmol) | CO (mmol) | CH4 (mmol) | C2H4 (mmol) |
|---|---|---|---|---|---|---|---|---|
| 1 | 0 | 65.4 | 23.2 | 0.4 | 21.9 | 0.4 | 0.4 | 0.1 |
| 13 | 120 | 281.3 | 279.1 | 65.5 | 57.9 | 136 | 15.1 | 4.6 |
| 14 | 127 | 317 | 317.1 | 91.6 | 51.6 | 148.6 | 20.2 | 4.1 |
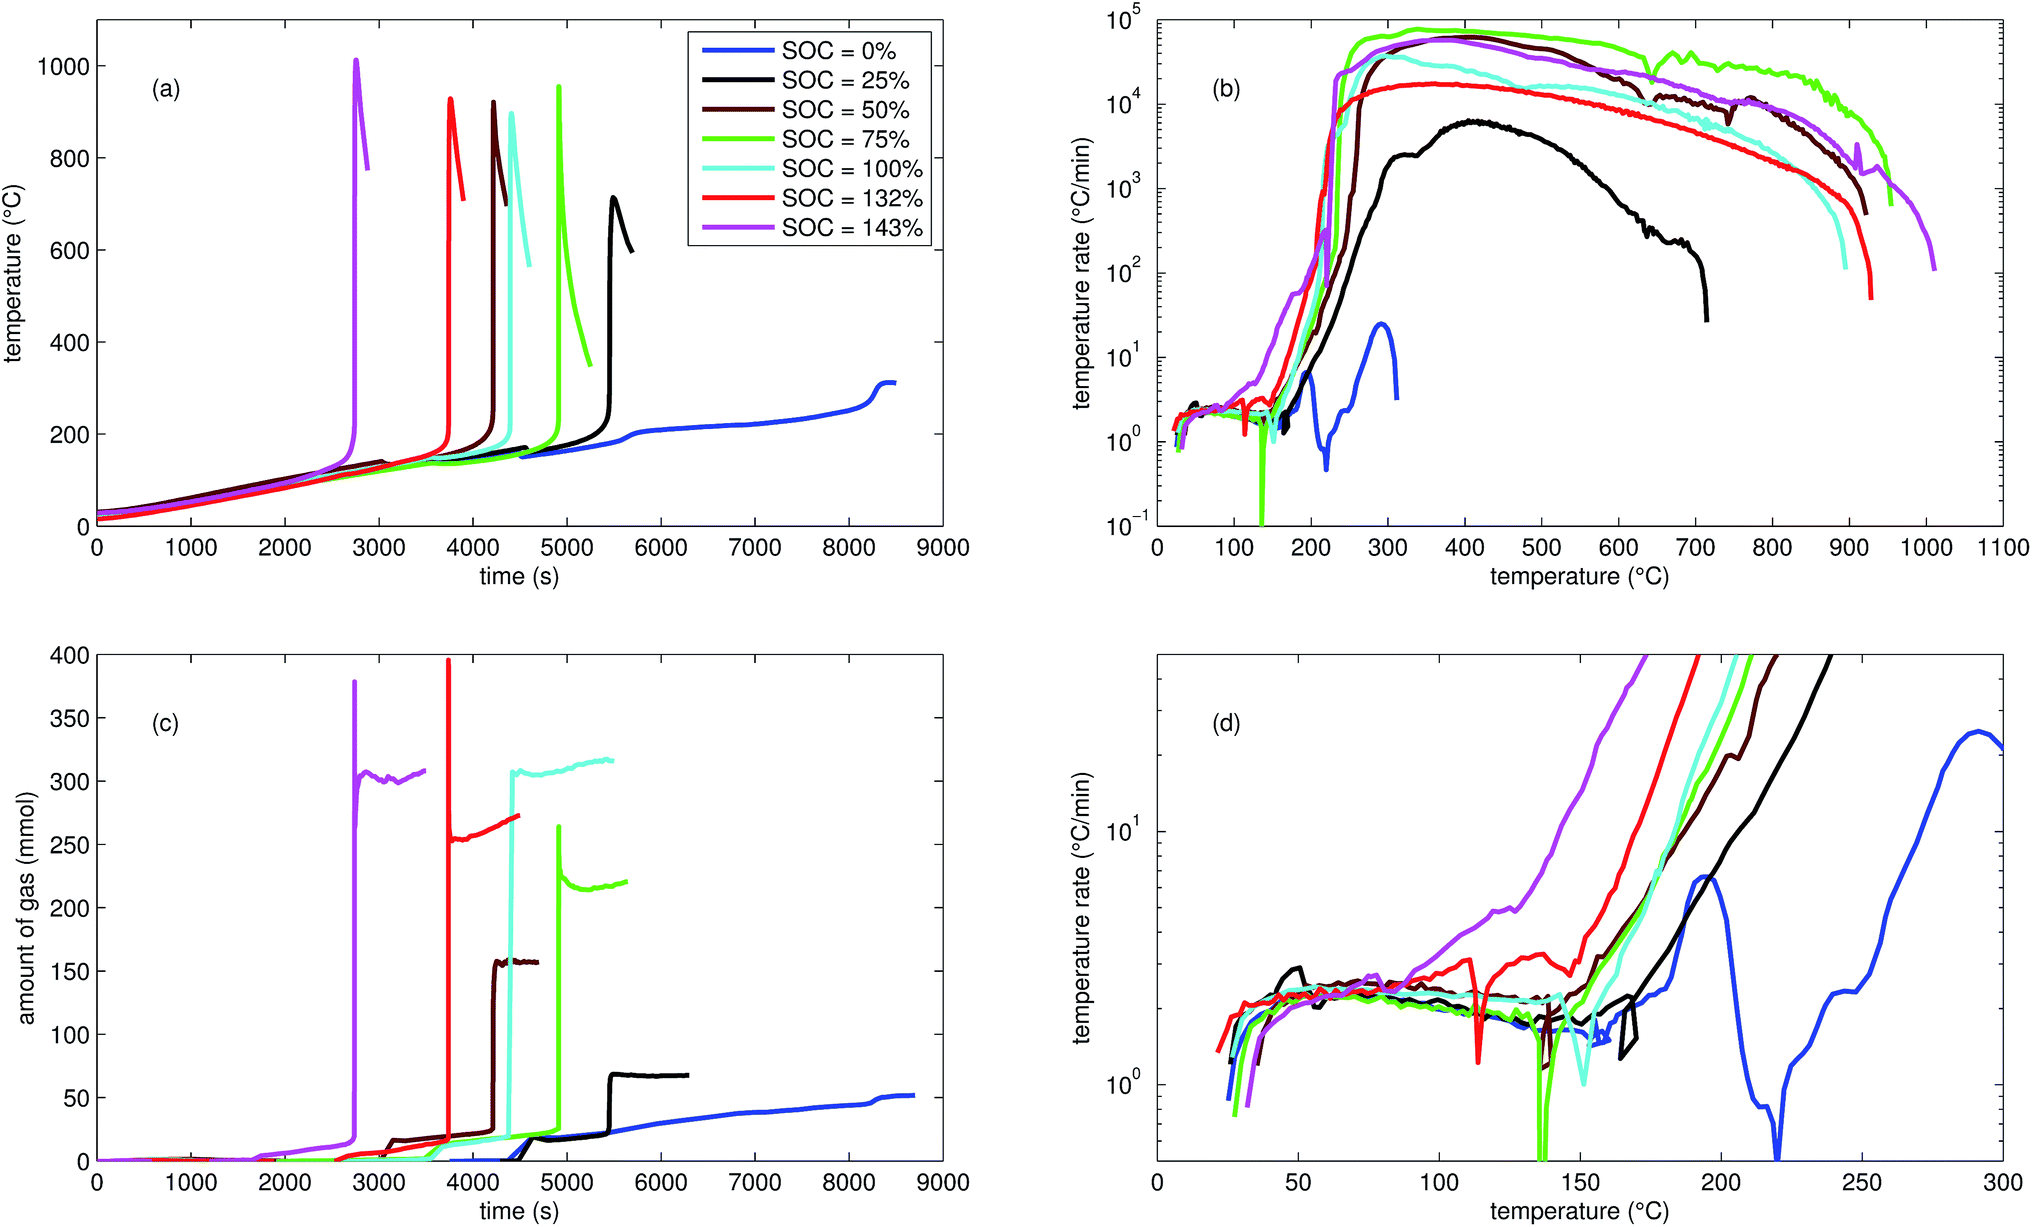 | ||
| Fig. 2 Typical thermal ramp experiments with NCA cells. (a) Cell temperature profiles. (c) Amount of produced vent-gas. The overshoot peaks are artefacts of the calculation (11) caused by inhomogeneous gas temperature. (b) Cell temperature rate dθ/dt vs. cell temperature θ, full temperature range. (d) Close up view of the cell temperature rate. | ||
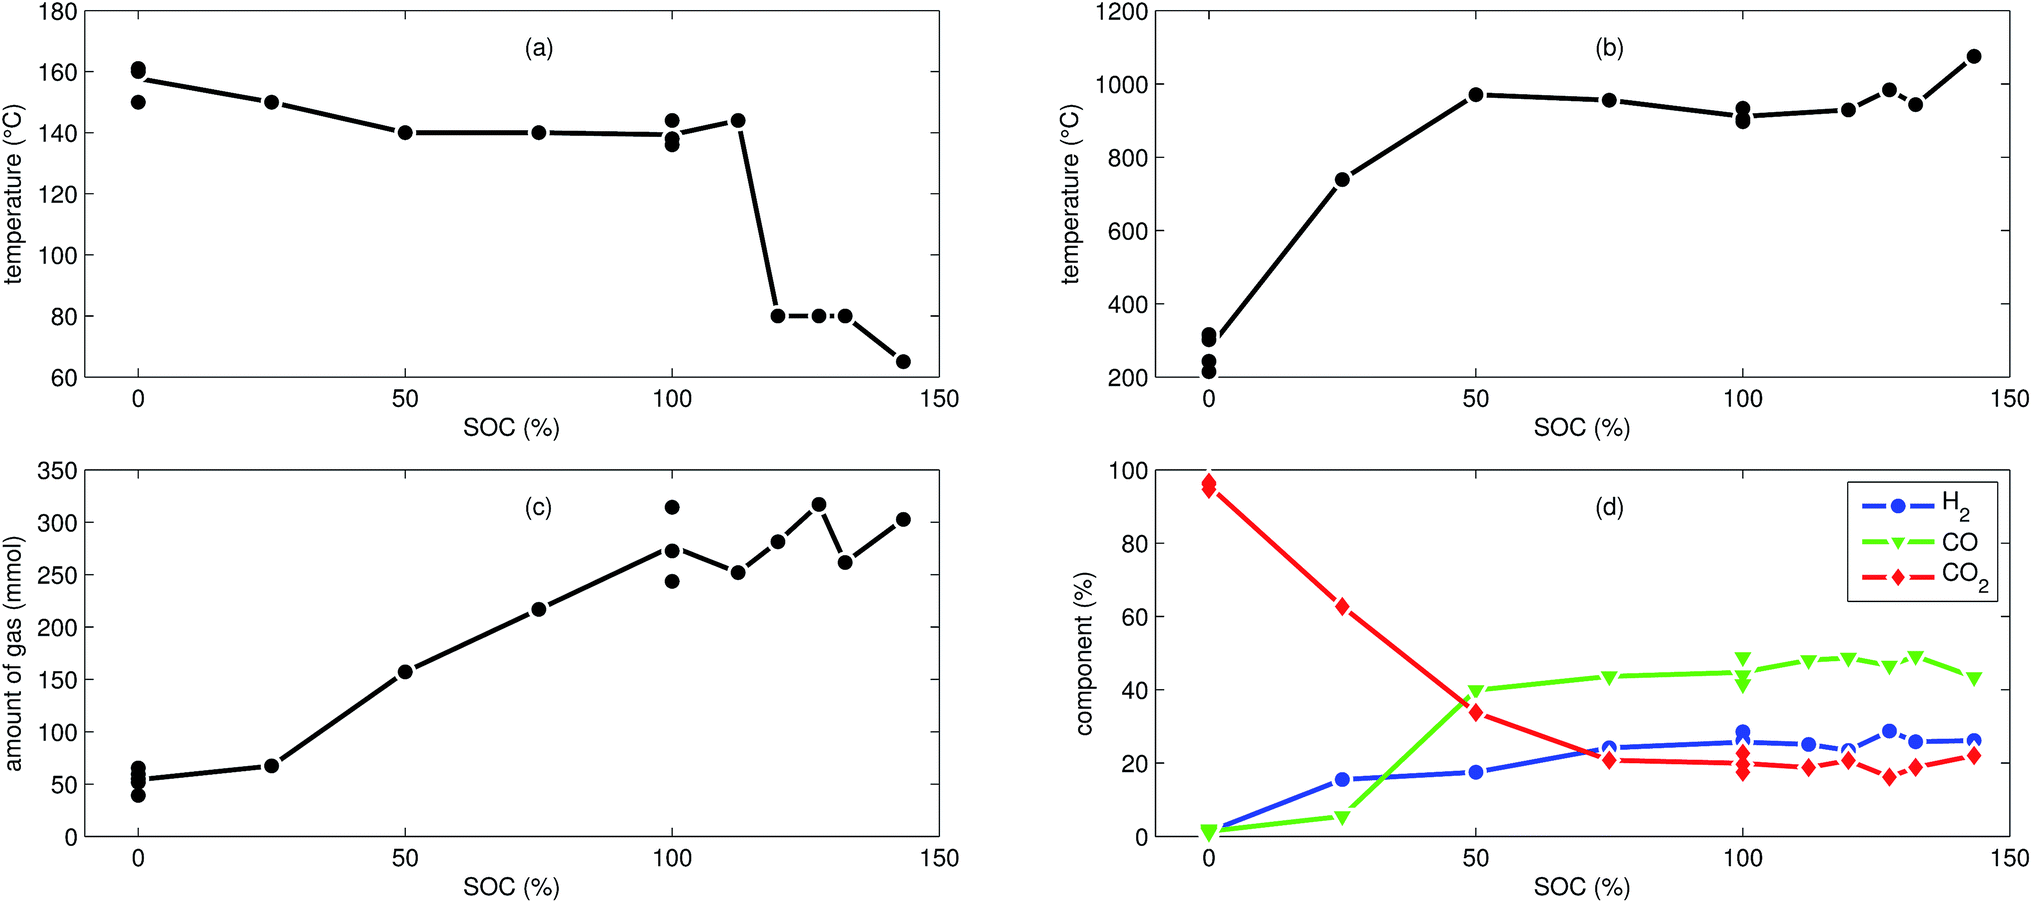 | ||
| Fig. 3 Characteristic thermal runaway parameters from all NCA experiments. (a) Onset cell temperature θo. (b) Maximum cell temperature θm. (c) Amount of produced gas nidealsum. (d) Main detected gas components rGCi. | ||
 | ||
| Fig. 4 Typical experiments with LFP cells: (a) cell temperature profiles. (c) Amount of produced vent-gas. (b) Cell temperature rate dθ/dt vs. cell temperature θ, full temperature range. (d) Close up view of the cell temperature rate. | ||
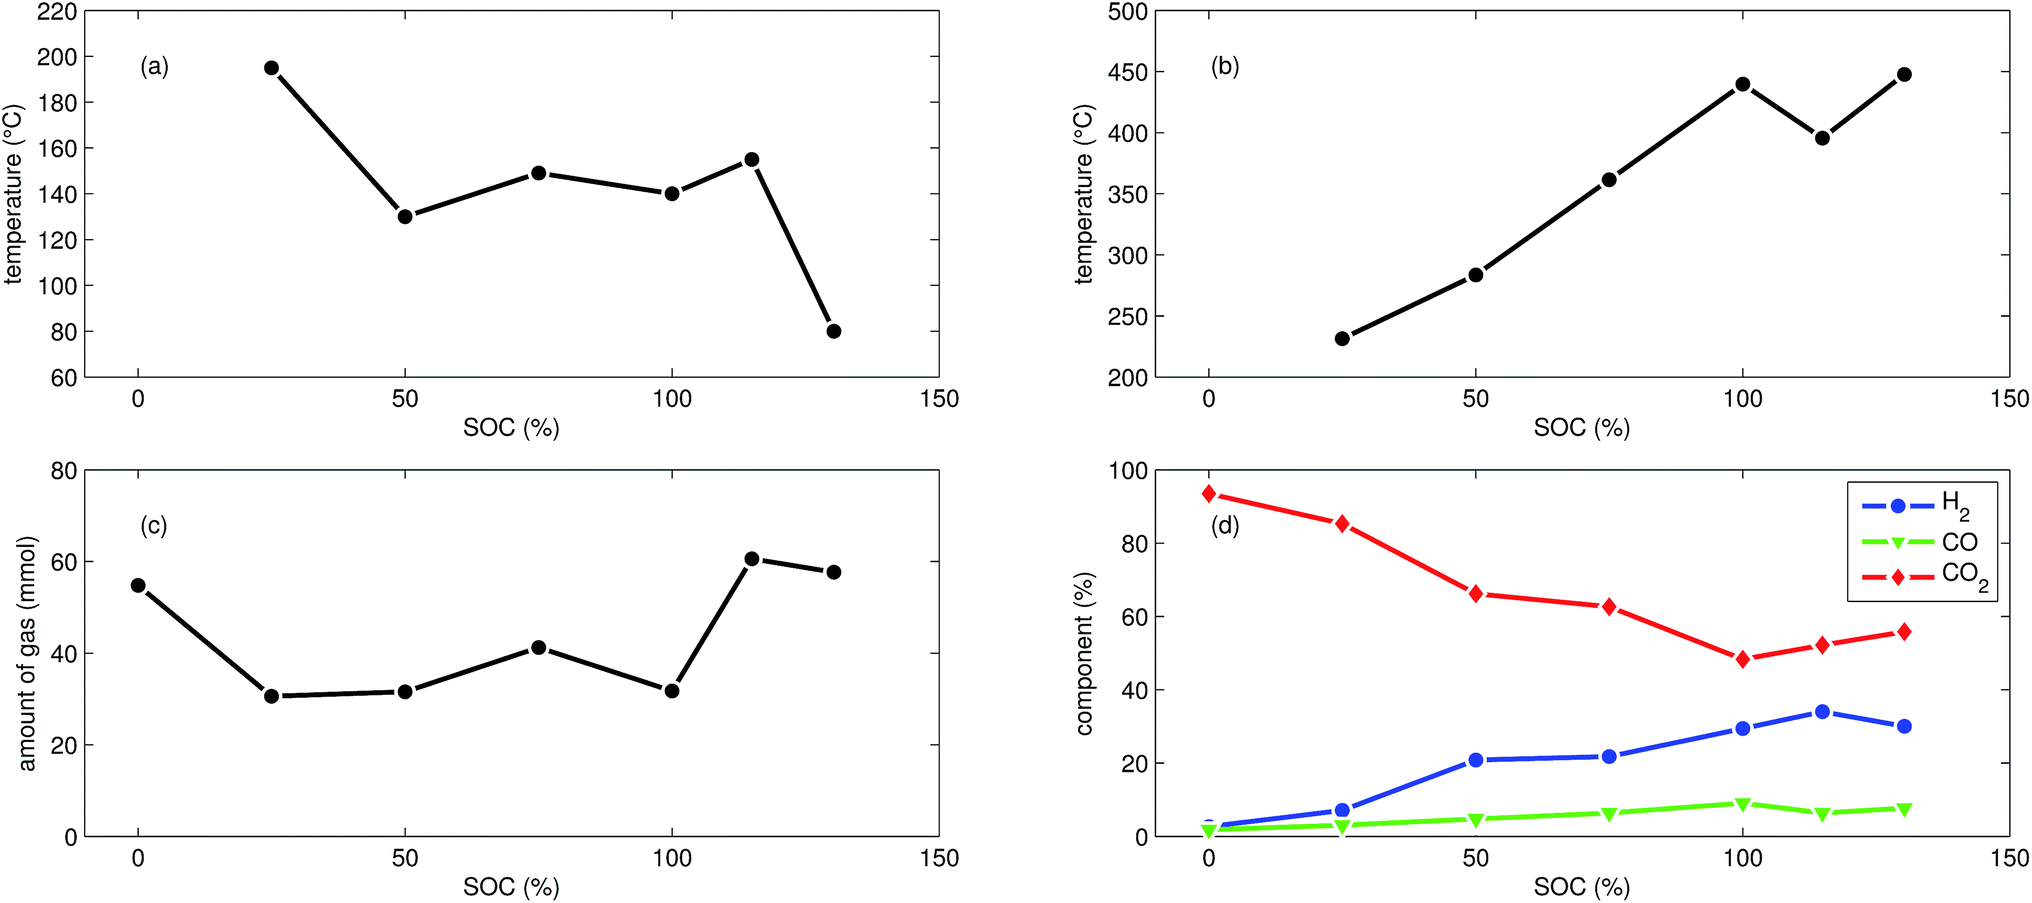 | ||
| Fig. 5 Summary of all experiments with LFP cells at different SOC: (a) onset cell temperature θo. (b) Maximum cell temperature θm. (c) Amount of produced gas nidealsum. (d) Main detected gas components rGCi. | ||
4.1 NCA cells
We tested the thermal stabilities of discharged as well as partially charged, fully charged and over charged NCA cells.Discharged NCA cells (Experiment 1–5) showed no pronounced thermal runaway characteristics. Only small unremarkable exothermic peaks were observed between 150 °C and 300 °C. The amount of gas depended on the timespan which the cells spend at increased temperature: after the initial burst plate opening of the cell housing the vent-gas was released from the cell into the reactor with an uniform rate. There was no sudden gas liberation and no violent chemical reaction. CO2 was the major identified component of the vent-gas. Interestingly, the mass loss of the discharged cells of 4.4 g equalled to the mass of electrolyte in the cells (Table 1).
In Experiment 1 we used N2 as internal standard. The GC detected nGCsum = 23.2 mmol of produced gas (Table 3). In contrast, the amount of ventgas inside the reactor (11) was much higher nidealsum = 65.4 mmol. We conclude that the GC could not identify the missing 42.2 mmol of gas, because its setup was optimized for a limited set of permanent gases.
The cells with SOC ≥ 25% displayed an unmistakable thermal runaway behaviour. When (partially) charged NCA cells were heated beyond a critical temperature, self accelerating exothermic reactions started and the cell temperatures suddenly increased up to maximum values in the range of 739 °C and 1075 °C.
The onsets of the exothermic reactions were obtained from the rate plot: the temperature, where a first clear deviation towards increased temperature rate was detected, was defined as the onset temperature θo. For NCA cells with SOC ≤ 100% θo was in the range between 136 °C and 160 °C. Overcharged NCA cells (SOC > 100%) showed much lower onset temperatures between 65 °C and 80 °C. It is an important finding, that overcharged NCA cells can proceed straight into thermal runaway when heated above 65 °C.
The thermal runaway reactions were accompanied by abrupt vent-gas releases. Cells with higher SOC produced more vent-gas. Up to 317 mmol of gas were recorded. The gas composition depended on the SOC as well: the fractions of CO2 decreased and the fractions of CO and H2 increased with rising SOC. A clear trend for other detected gases (CH4, C2H4 and C2H6) was not observed.
We used N2 as inert gas in the Experiments 13 and 14 (over-charged NCA) in the same way as in Experiment 1. The calculated amounts of gas nidealsum and nGCsum were in good agreement, indicating that all produced gases were detected by the GC. In other words, it is likely that the quantitative GC results (Table 3) represent the major vent-gas components for over-charged cells and that only smaller amounts of gas may be missing.
4.2 LFP cells
In addition to the experiments with NCA cells, we did 7 thermal-ramp experiments with LFP cells at different SOC (Table 2).The discharged LFP cell (Experiment 17) showed a behaviour similar to discharged NCA cells. Exothermic reactions could not be detected. After the initial burst plate opening of the cell housing, the amount of gas increased evenly over time as the cell was heated. For the discharged cell, the GC registered essentially only CO2. We suspect that the GC could not detect all gas components that were produced by the discharged cell: similar to Experiment 1 with a discharged NCA cell, significant amounts of gas may be missing in the GC results, simply because the used GC equipment was not capable of detecting them.
First mild exothermic reactions were seen for a cell that was charged to 25% SOC. The reactions were not strong enough to evolve into a distinct thermal runaway. Vent gas was produced continuously with time, likewise to the experiments with discharged cells.
LFP cells charged to SOC ≥ 50% showed pronounced thermal runaway reactions. Increasing SOC caused increasing maximum temperatures during thermal runaway. The maximum temperatures θm ranged from 283 °C to 448 °C.
The onset temperature θo was ∼140 °C for cells between 50% SOC and 100% SOC. The cell overcharged to 130% SOC showed a exothermic reaction already at 80 °C. In contrast to overcharged NCA cells, the initial exothermic reaction of the overcharged LFP cell could not sustain a full thermal runaway. The overcharged LFP cell proceeded into thermal runaway only after it was heated by the heating sleeve beyond 140 °C.
The amount of gas nidealsum ranged between 31 mmol and 61 mmol and showed no clear dependence on the SOC. With increasing SOC the relative composition of the detected gases changed to lower CO2 and higher H2 fractions. The fractions of CO (max. 9.1%) were lower than for NCA cells.
The mass loss of the LFP cells ranged from 6.1 g to 7.1 g and is comparable to the amount of electrolyte (6.5 g) in this cells.
5 Discussion
It is tempting to pinpoint the main contributors of heat and gas release during the thermal runaway reactions. Can the amount of produced gas and its components be explained with a set of chemical equations?Material naj that is available for the reaction system is listed in Table 1. In addition lithium  and oxygen naLi may be released in heated cells. Part of the material is consumed (by becoming a reactant nrj of the reaction system).
| 0 ≤ nrj ≤ naj | (14) |
The reaction products may consist of gases, fluids and solids. A measurable subset of the resulting gaseous products nGCi and the sum of ventgas nidealsum is given in Table 3. The challenge is to find the right set A of equations and to find the utilisation number b for each equation (how often is each equation applied) so that the calculated amounts of products npi match the measured values:
| minimize (nGCi − npi) > 0 | (15) |
 | (16) |
In other words, the difference of calculated and measured amounts of products is defined as the cost function and the system is restricted by the amounts of reactants and products. The algorithm should minimise the cost function and respect the restrictions.
The mathematical problem was solved using the LIPSOL linear programming toolbox in Matlab. The set of chemical equations and two explicit calculations (discharged NCA cell, Experiment 1 and over-charged NCA cell, Experiment 13) are disclosed in the next subsections:
5.1 Oxygen release from cathode material
At elevated temperatures cathode materials of Li-ion batteries can release oxygen. It is believed, that the exothermic reaction of oxygen with electrolyte is the main contributor to the extent of the thermal runway effect.4 The amount of released oxygen depends on the lithiation state of the cathode.In ref. 59–62 it is shown, that delithiated Lix(Ni0.80Co0.15Al0.05)O2 cathode material undergoes complex phase transitions accompanied by formation of O2 in the temperature range from 175 °C to 600 °C. In a simplified scheme, heated NCA transits from layered to rock salt structure with O2 release, depending on the lithiation state:
 | (17) |
The lithiation state x can be calculated using
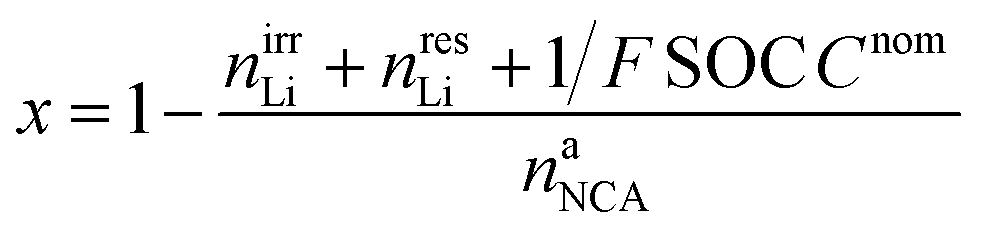 | (18) |
The amount of liberated O2 is
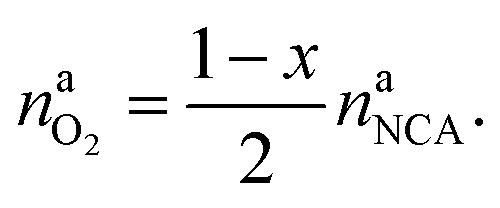 | (19) |
This calculation gives 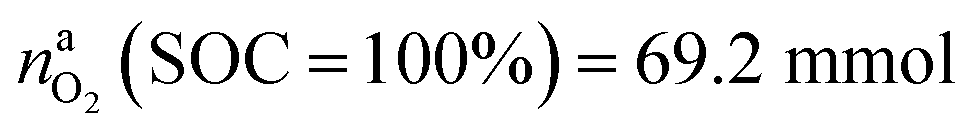 for a fully charged NCA cell and
  for a fully discharged NCA cell.
LFP cathodes have better thermal stability than layered metal oxide cathodes such as Lix(Ni0.80Co0.15Al0.05)O2, because of the strong covalent bonds of the phosphate groups of LixFePO4.63 Nevertheless a phase transition with O2 release of heated FePO4 can be detected by XRD experiments.64,65 If assumed that the partly lithiated LFP cathode in a Li-ion battery consists of a mix of lithiated (LiFePO4) and delithiated (FePO4) particles66 then the oxygen release of a partially charged cathode is given by:
 | (20) |
The absolute amount of O2 from the LFP cell can be calculated with equations similar to (18) and (19).
Both cathodes materials NCA and LFP can contribute O2 (Fig. 6) which in turn can take part in further exothermic degradation reactions. The amount of O2 is higher for delithiated cathodes (battery is charged). Note, that because of the irreversible capacity loss during formation of actual cells, the cathode can not be fully lithiated by discharge of the cell: even at 0% SOC (battery is discharged) the lithiation factor x < 1 and a small amount of O2 may be released.
 | ||
| Fig. 6 Oxygen release at different lithiation states: (a) NCA powder upon heating up to 600 °C (from ref. 59 and 61) and (b) LFP powder in electrolyte upon heating to 350 °C (from ref. 64). | ||
5.2 Exposure of lithium by the anode
On the anode side graphite particles can defoliate and expose intercalated Li at temperatures above 230 °C.67,68 The amount of released Li depends on SOC of the battery:| naLi = 1/F SOC Cnom + nresLi | (21) |
The NCA cell can release naLi (SOC = 100%) = 126.2 mmol in the fully charged state and naLi (SOC = 0%) = 1.24 mmol in discharged state.
5.3 Typical chemical reactions
In this section we compile a list of probable degradation reactions which may take place during thermal runaway. The most significant chemical reactions may be reactions with O2 and Li: partially delithiated cathodes release O2 and partially lithiated anodes release Li at elevated temperatures (17), (20) and (21). Both released materials are highly reactive and promote a number of reactions that are summarized in a previous publication.36 Additionally, following reactions are considered:Combustion of the carbon black (conducting additive) or anode graphite
 | (22) |
| CO + H2O → CO2 + H2 | (23) |
| 2Li + H2O → H2 + Li2O | (24) |
| Li2CO3 + C → Li2O2 + 2CO | (25) |
| LiPF6 + H2O → 2HF + LiF + POF3 | (26) |
| POF3 + 2H2O → POF(OH)2 + 2HF | (27) |
5.4 Alternative CO2 producing reactions
CO2 was the main gaseous product that was identified in the ventgas of discharged cells. Little O2 is available in cells at 0% SOC and it is questionable if combustion alone can account for all CO2. Therefore effort was made to find further alternative reactions with CO2 evolution without oxygen involvement. Following reactions were found in the literature:Ring-opening and polymerisation of EC and PC72–74e.g.:
 | (28) |
 | (29) |
 | (30) |
Gnanaraj et al. notes75 that the electrolyte salt decomposes
| LiPF6 ↔ LiF + PF5 | (31) |
The maximum amount of CO2 generated from purely thermal decomposition of the electrolyte solvents (28)–(30) is only limited by the amount of available electrolyte.
Further CO2 may be produced from the SEI degradation: The organic SEI produced by EC reduction (2) can decompose in thermally driven reactions,79
 | (32) |
| C2H5OCO2Li + HF → C2H5OH + LiF + CO2 | (33) |
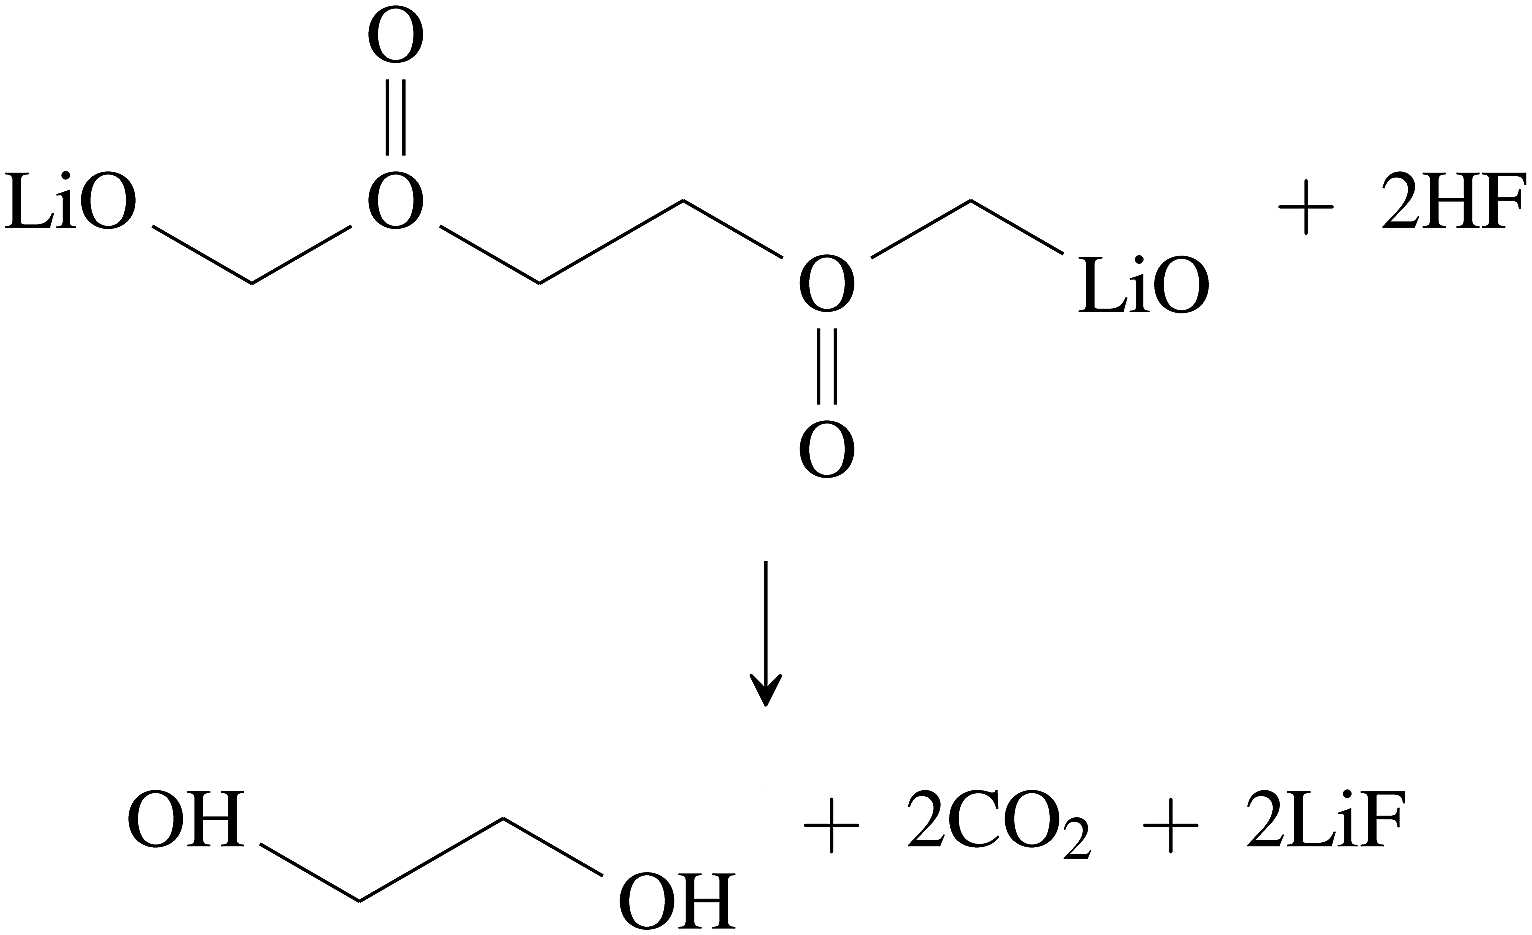 | (34) |
Inorganic SEI can react with HF as well.48,53
| Li2CO3 + 2HF → 2LiF + CO2 + H2O | (35) |
In the presence of impurities such as trace water LiPF6 may react to POF3 that in turn reacts with the electrolyte in a decarboxylation reaction with CO2 release:50,77,81–83
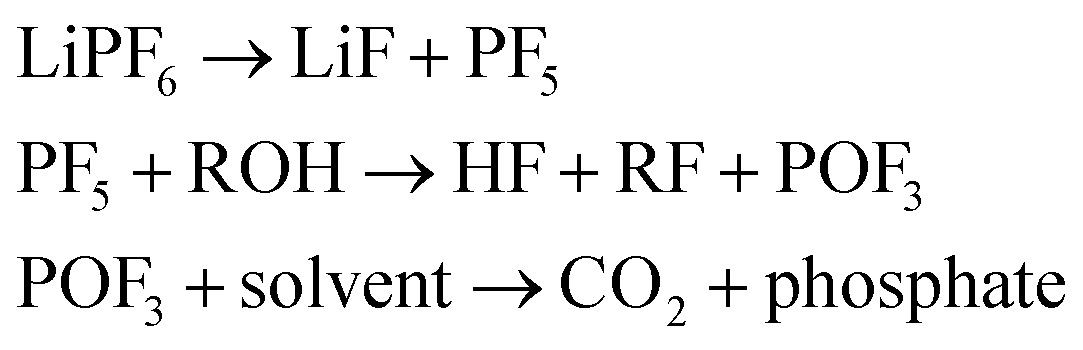 | (36) |
What is the most significant CO2 production mechanisms in oxygen depleted environment? In the case of the NCA cell (Table 1) decomposition of all electrolyte solvent (28)–(30) may translate to 35.0 mmol CO2. The amount of SEI is lower than the amount of electrolyte solvents and therefore only 8.7 mmol of CO2 can be produced with eqn (34) and (35). The reactions involving HF (33)–(36) may be further suppressed by the limited amount of trace ROH and LiPF6.
5.5 Gas release of a discharged NCA cell
In the Experiment 1 a discharged NCA cell was subject to a thermal-ramp test and absolute amounts of produced gas components were measured (Table 3). Gas analysis with GC gave 23.2 mmol of CO2 and small amounts of H2, CO and hydrocarbons. The overall amount of produced gas nidealsum inside the heated reactor was 65.4 mmol. This means that the GC system was unable to detect 42.2 mmol of unknown gas components.What is the source of CO2 and what is the nature of the not identified gas components? The cathode material of a discharged cell is not fully lithiated and may release a small amount of O2(19). The released O2 can participate in a combustion reaction, but the amount of released O2 is not sufficient to produce all measured CO2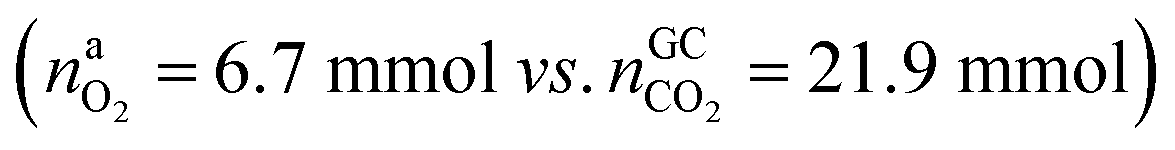 . We needed to consider alternative reactions in order to account for the measured amounts of gases.
Table 4 was calculated with the linear optimisation algorithm. It gives one possible set of reactions to reproduce the measured value of CO2 and the overall amount of produced gas in the reactor. Because of the elevated temperature all liquid solvents present inside the Li-ion cell either decompose or evaporate (Table 5). The calculation gives rise to new gaseous components and the amount of those components can be compared to the actual measurements (Table 6).
| Reaction l | Utilization bl (mmol) |
|---|---|
| DMCliq → DMCgas | 11.6 |
| ECliq → ECgas | 8.5 |
| MPCliq → MPCgas | 0.6 |
| (CH2OCO2Li)2 → Li2CO3 + C2H4 + CO2 + 0.5O2 | 0.1 |
| CMC + 3.175O2 → 7.4CO + 5.35H2O | 1 |
PVDF + Li → (CH![[double bond, length as m-dash]](https://www.rsc.org/images/entities/char_e001.gif) CF) + 0.5H2 + LiF CF) + 0.5H2 + LiF |
0.9 |
| 0.5O2 + H2 → H2O | 7 |
| CO + H2O → CO2 + H2 | 7.2 |
| DMC → CO2 + CH3OCH3 | 12.5 |
| EMC → CO2 + CH3OC2H5 | 2.2 |
| DMC + 2Li + H2 → Li2CO3 + 2CH4 | 0.2 |
| Compound j | Availibility naj (mmol) | Consumption nrj (mmol) |
|---|---|---|
| PE | 25 | 0 |
| O2 | 6.7 | 6.7 |
| C | 946.4 | 0 |
| CMC | 2.9 | 1 |
| PVDF | 7 | 0.9 |
| DMCliq | 24.3 | 24.3 |
| EMCliq | 2.2 | 2.2 |
| ECliq | 8.5 | 8.5 |
| MPCliq | 0.6 | 0.6 |
| LiPF6 | 3.1 | 0 |
| (CH2OCO2Li)2 | 3.5 | 0.1 |
| C6H4O6 | 1 | 0 |
| Li | 1.3 | 1.3 |
| Li2CO3 | 1.7 | 0 |
| LiF | 1.7 | 0 |
| Compound i | Calculated npi (mmol) | From GC nGCi (mmol) | n idealsum (mmol) |
|---|---|---|---|
| O2 | 0 | 0.1 | — |
| –[CHCF]– |
0.9 | — | — |
| Li2CO3 | 0.3 | — | — |
| DMCgas | 11.6 | — | — |
| ECgas | 8.5 | — | — |
| MPCgas | 0.6 | — | — |
| CH3OCH3 | 12.5 | — | — |
| CH3OC2H5 | 2.2 | — | — |
| H2O | 5.3 | — | — |
| CO | 0.4 | 0.4 | — |
| CO2 | 21.9 | 21.9 | — |
| H2 | 0.4 | 0.4 | — |
| CH4 | 0.4 | 0.4 | — |
| C2H2 | 0.1 | 0.1 | — |
| Sum of gaseous products | 63.9 | 23.2 | 65.4 |
In this mathematical solution, the missing 42.2 mmol of gas consist mainly of solvent decomposition products (CH3OCH3, CH3OC2H5) and remaining solvents as well as water in gaseous state. Such gases can not be found by the GC system due to following reasons: (a) the sampler of the GC runs at room temperature and therefore the solvents condense and are not injected into the GC column and (b) the present GC setup is not designed to identify and quantify any components other than H2, O2, N2, CO, CO2, CH4, C2H2, C2H4 and C2H6.
5.6 Gas release of a charged NCA cell
The situation changes when the cells in thermal ramp experiments are charged. High amounts of oxygen and lithium become available and the cells go into distinct thermal runaway. In the Experiment 13 (Table 3) an overcharged NCA cell was tested and the vent-gases were quantified by the GC system using an internal N2 standard.The cell in Experiment 13 was overcharged to a capacity of 4.03 A h (120% SOC). The lithiation factor of the cathode was xcatLi = 0.08 and the calculated oxygen release (17) was 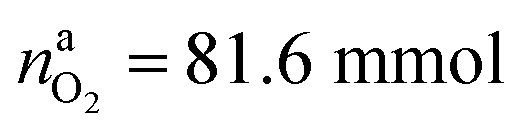 . The lithiation factor of the anode was xandLi = 1.00 and the amount of intercalated Li on the anode side equalled naLi = 151 mmol. In other words, the anode was fully lithiated to the maximum theoretical Li capacity. The cell produced 281.3 mmol of ventgas during thermal runaway and high amounts of CO, H2, CO2 were detected.
To find one of the possible solutions explaining the measured gas composition the equations in Table 7 were used. In this exemplary mathematical solution all electrolyte solvents, organic SEI, lithium carbonate and the released O2 were consumed (Table 8). The major products in the calculation were the gases as measured by the GC as well as the solids LiF and Li2O. The overall amount of measured gas nidealsum and the amounts of the individual gas components nGCi could be reproduced by the calculation (Table 9). The quantity of LiF and Li2O was not measured and therefore not verified by the experiments.
| Reaction l | Utilization bl (mmol) |
|---|---|
| DMC + 1.5O2 → 3CO + 3H2O | 10.4 |
| DMC → C2H4 + CO2 + H2O | 1.1 |
| EC + O2 → 3CO + 2H2O | 8.5 |
| MPCliq + 4.5O2 → 8CO + 4H2O | 0.6 |
| C + 0.5O2 → CO | 60.9 |
| CO + 0.5O2 → CO2 | 12.3 |
| (CH2OCO2Li)2 + 2Li → 2Li2CO3 + C2H4 | 3.5 |
| C6H4O6 + 2O2 → 6CO + 2H2O | 1 |
| CMC + 3.175O2 → 7.4CO + 5.35H2O | 2.9 |
| PVDF + O2 → 2CO + 2HF | 7 |
| CO + H2O → CO2 + H2 | 15.5 |
| 2Li + H2O → H2 + Li2O | 57.5 |
| DMC → CO2 + CH3OCH3 | 5.3 |
| EMC → CO2 + CH3OC2H5 | 2.2 |
| DMC + 2Li + H2 → Li2CO3 + 2CH4 | 7.5 |
| Li2CO3 → Li2O + CO2 | 3.1 |
| Li2CO3 + 2HF → 2LiF + CO2 + H2O | 13.1 |
| LiPF6 + H2O → 2HF + LiF + POF3 | 3.1 |
| POF3 + 2H2O → POF(OH)2 + 2HF | 3.1 |
| Compound j | Availibility naj (mmol) | Consumption nrj (mmol) |
|---|---|---|
| PE | 25 | 0 |
| O2 | 81.6 | 81.6 |
| C | 946.4 | 60.9 |
| CMC | 2.9 | 2.9 |
| PVDF | 7 | 7 |
| DMCliq | 24.3 | 24.3 |
| EMCliq | 2.2 | 2.2 |
| ECliq | 8.5 | 8.5 |
| MPCliq | 0.6 | 0.6 |
| LiPF6 | 3.1 | 3.1 |
| (CH2OCO2Li)2 | 3.5 | 3.5 |
| C6H4O6 | 1 | 1 |
| Li | 151 | 137 |
| Li2CO3 | 1.7 | 1.7 |
| LiF | 1.7 | 0 |
| Compound i | Calculated npi (mmol) | From GC nGCi (mmol) | n idealsum (mmol) |
|---|---|---|---|
| LiF | 29.3 | — | — |
| POF(OH)2 | 3.1 | — | — |
| Li2O | 60.6 | — | — |
| CH3OCH3 | 5.3 | — | — |
| CH3OC2H5 | 2.2 | — | — |
| CO | 136 | 136 | — |
| CO2 | 52.6 | 57.9 | — |
| H2 | 65.5 | 65.5 | — |
| CH4 | 15.1 | 15.1 | — |
| C2H4 | 4.6 | 4.6 | — |
| Sum of gaseous products | 281.3 | 279.1 | 281.3 |
The major reactions which were responsible for the gas and heat production during thermal runaway are summarized in a simplified picture (Fig. 7). In this scheme the released oxygen triggers a chain of exothermic reactions. Because of O2 insufficiency incomplete combustion of organic material takes place. The resulting H2O reacts with the exposed Li with H2 production. Simultaneously H2 and CO2 are produced with the water–gas shift reaction. In the end the main gases are CO, CO2 and H2.
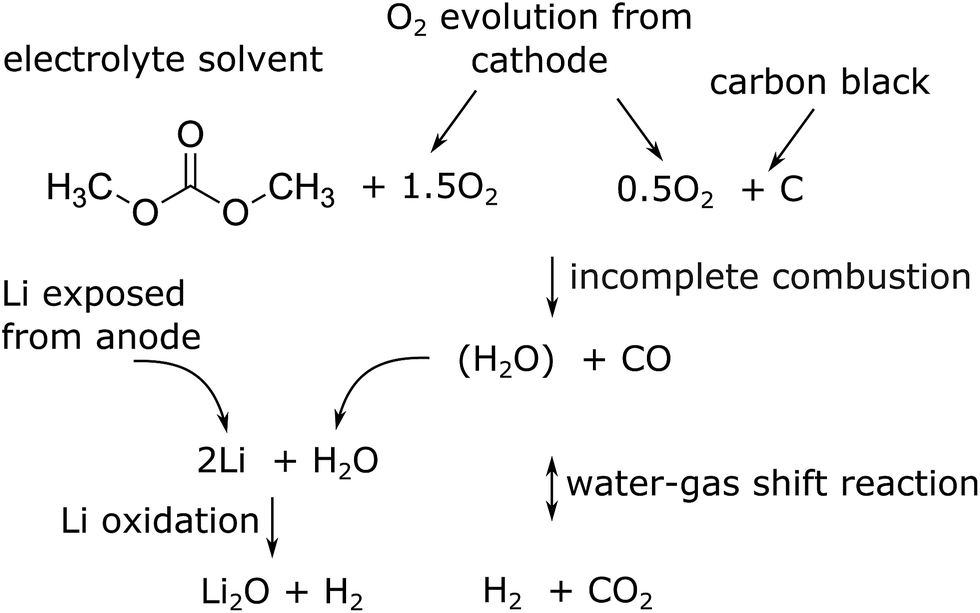 | ||
| Fig. 7 Proposed main reaction system for a thermal runaway of a (partially) charged or over-charged Li-ion battery. | ||
Although the calculation shows good agreement of measured and computed amounts of gas it has some flaws: (a) the full amount of CO2 could not be reproduced (b) it is not considered, that the separator material must decompose and add additional gas volume at temperatures >900 °C and (c) in reality the reactants are not distributed homogeneously when the reactions take place, instead material is violently expelled from the cell into the reactor during thermal runaway. Further work is needed to take those effects into account.
6 Conclusions and outlook
We measured the thermal runaway characteristics of commercial Li-ion cells in destructive thermal ramp experiments in inert atmosphere. Our samples were 23 NCA and LFP based Li-ion batteries with the geometrical format 18650 charged to different SOC. The main findings of this work are:(1) The cell material and cell design (e.g. high energy density vs. high power density) have a high influence on the maximum cell temperature and on the released gases in thermal runaway conditions (Table 10). Charged NCA cells showed a drastic thermal runaway behaviour. NCA cells could reach maximum temperatures of 1075 °C and they released up to 317 mmol of gas (equal to 7.1 L at standard conditions). Charged LFP cells exhibited a less pronounced thermal runaway: maximum cell temperatures as high as 448 °C were observed and the LFP cells released up to 61 mmol of gas.
| LFP | NCA | ||
|---|---|---|---|
| Voltage (50% SOC) | V | 3.32 | 3.68 |
| Nominal capacity | A h | 1.1 | 3.35 |
| Cell mass | g | 38.87 | 45.40 |
| Max continuous discharge | A | 30 | 6.7 |
| Cycle life | >1000 | >300 | |
| Min. SOC for a pronounced thermal runaway | % | 50 | 25 |
| Onset temperature θo (100% SOC) | °C | 140 | 139 |
| Max. temperature θm (100% SOC) | °C | 440 | 911 |
| Produced gas nidealsum (100% SOC) | mmol | 32 | 277 |
| Detected CO2 (100% SOC) | % | 48.3 | 20.0 |
| Detected CO (100% SOC) | % | 9.1 | 44.8 |
| Detected H2 (100% SOC) | % | 29.4 | 25.7 |
| Impact of overcharge | Weak | Strong |
(2) Discharged cells showed no thermal runaway upon heating up to ∼250 °C. Both cell types needed to be at least partially charged in order to go into thermal runaway.
(3) The severity of the thermal runaway increased with increasing SOC.
(4) The thermal runaway reactions produced high amounts of CO, H2 and CO2 thus making the gas flammable and potentially toxic. The gas composition depended on the cell type and SOC. NCA cells produced more CO and H2 than LFP cells. Discharged cells generated mainly CO2. Increased SOC led to increased amounts of CO and H2.
(5) The SOC and the cell type had less effect on the onset temperature, as long as no Li plating occurred. Overcharge may cause metallic Li deposition on the anode which compromises the thermal stability. The onset temperature of overcharged cells decreased dramatically from 140 °C to values as low as 65 °C!
(6) In three experiments, the absolute amounts of gases from NCA cells were quantified. It is shown, that it is theoretically possible to explain the absolute amounts of the measured gases with a set of chemical degradation reactions and with known amounts of initial material in the cell.
(7) We think that the main reactions in charged cells are combustion of carbonous material and Li oxidation. Both are strong exothermic reactions which contribute to the energy release during the thermal runaway of a Li-ion battery. The amounts of O2 and Li available to degradation reactions depend on the SOC as well as on the amount and type of active cathode and anode material. Higher SOC increases the O2 release of the cathode and the amount of intercalated Li in the anode. In over-charged cells these amounts increase further and deposition of highly reactive metallic Li may occur on the anode.
(8) It is proposed that both, the cathode and anode side participate in the reaction system. Therefore experiments with only one electrode may not cover the full picture.
Many open questions concerning the safety of Li-ion batteries remain. The industry needs scaling rules to evaluate the safety of large battery systems with hundreds of cells based on results of misuse experiments with individual cells. Many test results exist for small 18650 cells but we think that more effort must be made to understand the thermal runaway behaviour of large cells with capacities as high as 60 A h. It is yet to prove, if specific amount of gas and heat are the same for small and large cells. The risks of fire and toxicity (including HF) of vent gas must be quantified for real life applications including misuse of battery packs for electric vehicles, airliners and for home storage of solar energy.
Our future work in the next three years will include (a) additional testing of 18650 cells in an improved test rig, (b) experiments with large automotive Li-ion cells in a new large test rig, (c) bottom up thermodynamic calculations of the chemical reaction systems and (d) top down FEM simulation of failure propagation and the reaction kinetics in large battery packs.
Nomenclature
| Δm | Mass loss of the cell, caused by temperature ramp experiment (g) |
| θ | Cell temperature (°C) |
| θ m | Maximum cell temperature during the temperature ramp experiment (°C) |
| θ o | Onset temperature of the thermal runaway (°C) |
| θ gas | Gas temperature inside the reactor (K) |
| C irr | Charge associated with nirrLi (A h) |
| C nom | Typical cell capacity as specified in the datasheet (A h) |
| C res | Charge associated with nresLi (A h) |
| C uand | Theoretically usable capacity of the anode (A h) |
| C ucat | Theoretically usable capacity of the cathode (A h) |
| F | Faraday constant (F = 96485 A s mol−1) |
| n a i | Amount of substance i in a pristine cell, at the start of a thermal ramp experiment (mol) |
| n p i | Theoretically calculated amount of product i, which is produced by chemical reactions during the thermal runaway (mol) |
| n a j | Amount of material j in the cell, that is available for chemical reactions during the thermal runaway (mol) |
| n acat | Amount of either LFP or NCA units in the cathode |
| n GC i | Absolute amount of gas component i in the reactor, calculated from GC results (mol) |
| n GCsum | Amount of gas produced by a cell during a temperature ramp experiment, calculated from GC results (mol) |
| n idealsum | Amount of gas produced by a cell during a temperature ramp experiment, calculated with the ideal gas law (mol) |
| n irrLi | Amount of irreversibly trapped Li in the anode caused by initial cell formation (mol) |
| n resLi | Amount of residual Li in the anode of a cell which is discharged to Vmin (mol) |
| n r j | Theoretically calculated amount of reagent j in the cell, which is consumed by chemical reactions during the thermal runaway (mol) |
| n 0 | Initial amount of gas in the reactor at the start of the experiment (mol) |
| n N2 | Actual amount of N2 in the reactor (mol) |
| P | Gas pressure in the reactor (Pa) |
| R | Gas constant (R = 8.314 J mol−1 K−1) |
| r GC i | Result of GC measurement: fraction of gas component i in the GC sample (mol%) |
| T | Time (s) |
| V | Volume of the reactor (m3) |
| V min | Minimum cell voltage as specified in the datasheet (V) |
| x | Lithiation factor of the anode or cathode |
Acknowledgements
VIRTUAL VEHICLE Research Center is funded within the COMET Competence Centers for Excellent Technologies programme by the Austrian Federal Ministry for Transport, Innovation and Technology (BMVIT), the Federal Ministry of Science, Research and Economy (BMWFW), the Austrian Research Promotion Agency (FFG), the province of Styria and the Styrian Business Promotion Agency (SFG). The COMET programme is administrated by FFG. We would furthermore like to express our thanks to our supporting scientific project partners, namely “Varta Micro Innovation GmbH” and to the Graz University of Technology. The work was made possible by the principal industrial project partners “BASF SE” and by “MAGNA STEYR Battery Systems GmbH & Co OG”.References
- K. Xu, Chem. Rev., 2004, 104, 4303–4417 CrossRef CAS.
- Z. J. Zhang and P. Ramadass, in Encycl. Sustain. Sci. Technol., Springer New York, New York, NY, 2012, pp. 319–356 Search PubMed.
- J. Wen, Y. Yu and C. Chen, Mater. Express, 2012, 2, 197–212 CrossRef CAS PubMed.
- D. Doughty and E. P. Roth, Electrochem. Soc. Interface, 2012, 21, 37–44 CAS.
- E. P. Roth and C. J. Orendorff, Electrochem. Soc. Interface, 2012, 21, 45–49 CAS.
- D. Abraham, E. P. Roth, R. Kostecki, K. McCarthy, S. MacLaren and D. Doughty, J. Power Sources, 2006, 161, 648–657 CrossRef CAS PubMed.
- Z. Chen, Y. Qin, Y. Ren, W. Lu, C. Orendorff, E. P. Roth and K. Amine, Energy Environ. Sci., 2011, 4, 4023 CAS.
- G. Nagasubramanian and C. J. Orendorff, J. Power Sources, 2011, 196, 8604–8609 CrossRef CAS PubMed.
- H. Maleki, G. Deng, A. Anani and J. Howard, J. Electrochem. Soc., 1999, 146, 3224 CrossRef CAS PubMed.
- P. Ping, Q. Wang, P. Huang, J. Sun and C. Chen, Appl. Energy, 2014, 129, 261–273 CrossRef CAS PubMed.
- P. Röder, B. Stiaszny, J. C. Ziegler, N. Baba, P. Lagaly and H.-D. Wiemhöfer, J. Power Sources, 2014, 268, 315–325 CrossRef PubMed.
- M. Fleischhammer, T. Waldmann, G. Bisle, B.-I. Hogg and M. Wohlfahrt-Mehrens, J. Power Sources, 2015, 274, 432–439 CrossRef CAS PubMed.
- D. H. Doughty, E. P. Roth, C. C. Crafts, G. Nagasubramanian, G. Henriksen and K. Amine, J. Power Sources, 2005, 146, 116–120 CrossRef CAS PubMed.
- J. Lamb and C. J. Orendorff, J. Power Sources, 2014, 247, 189–196 CrossRef CAS PubMed.
- G. Trattnig and W. Leitgeb, in Automot. Batter. Technol., Springer, 2014, pp. 19–37 Search PubMed.
- X. Liu, S. I. Stoliarov, M. Denlinger, A. Masias and K. Snyder, J. Power Sources, 2015, 280, 516–525 CrossRef CAS PubMed.
- P. Ping, Q. Wang, P. Huang, K. Li, J. Sun, D. Kong and C. Chen, J. Power Sources, 2015, 285, 80–89 CrossRef CAS PubMed.
- X. Feng, M. Fang, X. He, M. Ouyang, L. Lu, H. Wang and M. Zhang, J. Power Sources, 2014, 255, 294–301 CrossRef CAS PubMed.
- F. Larsson and B.-E. Mellander, J. Electrochem. Soc., 2014, 161, A1611–A1617 CrossRef CAS PubMed.
- P. Huang, Q. Wang, K. Li, P. Ping and J. Sun, Sci. Rep., 2015, 5, 7788 CrossRef PubMed.
- H. Wang, A. Tang and K. Wang, Chin. J. Chem., 2011, 29, 27–32 CrossRef CAS PubMed.
- C.-Y. Wen, C.-Y. Jhu, Y.-W. Wang, C.-C. Chiang and C.-M. Shu, J. Therm. Anal. Calorim., 2012, 109, 1297–1302 CrossRef CAS.
- T.-Y. Lu, C.-C. Chiang, S.-H. Wu, K.-C. Chen, S.-J. Lin, C.-Y. Wen and C.-M. Shu, J. Therm. Anal. Calorim., 2013, 114, 1083–1088 CrossRef CAS.
- C.-Y. Jhu, Y.-W. Wang, C.-M. Shu, J.-C. Chang and H.-C. Wu, J. Hazard. Mater., 2011, 192, 99–107 CAS.
- C.-Y. Jhu, Y.-W. Wang, C.-Y. Wen, C.-C. Chiang and C.-M. Shu, J. Therm. Anal. Calorim., 2011, 106, 159–163 CrossRef CAS PubMed.
- H. Ishikawa, O. Mendoza, Y. Sone and M. Umeda, J. Power Sources, 2012, 198, 236–242 CrossRef CAS PubMed.
- E. P. Roth and D. H. Doughty, J. Power Sources, 2004, 128, 308–318 CrossRef CAS PubMed.
- S.-i. Tobishima and J.-i. Yamaki, A consideration of lithium cell safety, 1999 Search PubMed.
- D. Belov and M.-H. Yang, Solid State Ionics, 2008, 179, 1816–1821 CrossRef CAS PubMed.
- Y. Zeng, K. Wu, D. Wang, Z. Wang and L. Chen, J. Power Sources, 2006, 160, 1302–1307 CrossRef CAS PubMed.
- T. Ohsaki, T. Kishi, T. Kuboki, N. Takami, N. Shimura, Y. Sato, M. Sekino and A. Satoh, J. Power Sources, 2005, 146, 97–100 CrossRef CAS PubMed.
- J. Jeevarajan, in Lithium-Ion Batter. Adv. Appl., Elsevier, 2014, pp. 387–407 Search PubMed.
- C. Orendorff, Electrochem. Soc. Interface, 2012, 21, 61–65 CAS.
- R. a. Leising, M. J. Palazzo, E. S. Takeuchi and K. J. Takeuchi, J. Electrochem. Soc., 2001, 148, A838 CrossRef CAS PubMed.
- Z. Li, J. Huang, B. Yann Liaw, V. Metzler and J. Zhang, J. Power Sources, 2014, 254, 168–182 CrossRef CAS PubMed.
- A. W. Golubkov, D. Fuchs, J. Wagner, H. Wiltsche, C. Stangl, G. Fauler, G. Voitic, A. Thaler and V. Hacker, RSC Adv., 2014, 4, 3633 RSC.
- J.-H. Lee, U. Paik, V. a. Hackley and Y.-M. Choi, J. Electrochem. Soc., 2005, 152, A1763 CrossRef CAS PubMed.
- S.-L. Chou, Y. Pan, J.-Z. Wang, H.-K. Liu and S.-X. Dou, Phys. Chem. Chem. Phys., 2014, 16, 20347–20359 RSC.
- Z. Chen and J. R. Dahn, Reducing Carbon in LiFePO4/C Composite Electrodes to Maximize Specific Energy, Volumetric Energy, and Tap Density, 2002 Search PubMed.
- J. Wang and X. Sun, Energy Environ. Sci., 2012, 5, 5163 CAS.
- H. Ota, Y. Sakata, A. Inoue and S. Yamaguchi, J. Electrochem. Soc., 2004, 151, A1659 CrossRef CAS PubMed.
- J. C. Burns, R. Petibon, K. J. Nelson, N. N. Sinha, A. Kassam, B. M. Way and J. R. Dahn, J. Electrochem. Soc., 2013, 160, A1668–A1674 CrossRef CAS PubMed.
- S. Zhang, J. Power Sources, 2006, 162, 1379–1394 CrossRef CAS PubMed.
- E. Peled, D. Golodnitsky, A. Ulus and V. Yufit, Electrochim. Acta, 2004, 391–395 CrossRef CAS PubMed.
- K. Ushirogata, K. Sodeyama, Y. Okuno and Y. Tateyama, J. Am. Chem. Soc., 2013, 135, 11967–11974 CrossRef CAS PubMed.
- L. El Ouatani, R. Dedryvere, C. Siret, P. Biensan, S. Reynaud, P. Iratcabal and D. Gonbeau, J. Electrochem. Soc., 2009, 156, A103 CrossRef CAS PubMed.
- G. Gachot, S. Grugeon, G. G. Eshetu, D. Mathiron, P. Ribière, M. Armand and S. Laruelle, Electrochim. Acta, 2012, 83, 402–409 CrossRef CAS PubMed.
- M. Onuki, S. Kinoshita, Y. Sakata, M. Yanagidate, Y. Otake, M. Ue and M. Deguchi, J. Electrochem. Soc., 2008, 155, A794 CrossRef CAS PubMed.
- D. Aurbach, A. Zaban, Y. Ein-Eli, I. Weissman, O. Chusid, B. Markovsky, M. Levi, E. Levi, A. Schechter and E. Granot, J. Power Sources, 1997, 68, 91–98 CrossRef CAS.
- G. Gachot, P. Ribière, D. Mathiron, S. Grugeon, M. Armand, J. B. Leriche, S. Pilard and S. Laruelle, Anal. Chem., 2011, 83, 478–485 CrossRef CAS PubMed.
- R. Spotnitz and J. Franklin, J. Power Sources, 2003, 113, 81–100 CrossRef CAS.
- H. Yoshida, T. Fukunaga, T. Hazama, M. Terasaki, M. Mizutani and M. Yamachi, J. Power Sources, 1997, 68, 311–315 CrossRef CAS.
- C. Doh, D. Kim, J. Lee, D. Lee, B. Jin, H. Kim, S. Moon, Y. Hwang and A. Veluchamy, Bull. Korean Chem. Soc., 2009, 30, 783 CrossRef CAS.
- K. Tasaki and S. J. Harris, J. Phys. Chem. C, 2010, 114, 8076–8083 CAS.
- H. Maleki and J. Howard, J. Power Sources, 2006, 160, 1395–1402 CrossRef CAS PubMed.
- H. He, Y. Liu, Q. Liu, Z. Li, F. Xu, C. Dun, Y. Ren, M.-x. Wang and J. Xie, J. Electrochem. Soc., 2013, 160, A793–A804 CrossRef CAS PubMed.
- X. Huang, J. Solid State Electrochem., 2010, 15, 649–662 CrossRef PubMed.
- C. T. Love, J. Power Sources, 2011, 196, 2905–2912 CrossRef CAS PubMed.
- S.-m. Bak, K.-w. Nam, W. Chang, X. Yu, E. Hu, S. Hwang, E. A. Stach, K.-B. Kim, K. Y. Chung and X.-Q. Yang, Chem. Mater., 2013, 25, 337–351 CrossRef CAS.
- K.-W. Nam, S.-M. Bak, E. Hu, X. Yu, Y. Zhou, X. Wang, L. Wu, Y. Zhu, K.-Y. Chung and X.-Q. Yang, Adv. Funct. Mater., 2013, 23, 1047–1063 CrossRef CAS PubMed.
- I. Belharouak, W. Lu, D. Vissers and K. Amine, Electrochem. Commun., 2006, 8, 329–335 CrossRef CAS PubMed.
- H. J. Bang, H. Joachin, H. Yang, K. Amine and J. Prakash, J. Electrochem. Soc., 2006, 153, A731 CrossRef CAS PubMed.
- Z. Li, D. Zhang and F. Yang, J. Mater. Sci., 2009, 44, 2435–2443 CrossRef CAS.
- P. Röder, N. Baba, K. Friedrich and H.-D. Wiemhöfer, J. Power Sources, 2013, 236, 151–157 CrossRef PubMed.
- J. Kim, K.-Y. Park, I. Park, J.-K. Yoo, J. Hong and K. Kang, J. Mater. Chem., 2012, 22, 11964 RSC.
- W.-J. Zhang, J. Power Sources, 2011, 196, 2962–2970 CrossRef CAS PubMed.
- O. Haik, S. Ganin, G. Gershinsky, E. Zinigrad, B. Markovsky, D. Aurbach and I. Halalay, J. Electrochem. Soc., 2011, 158, A913 CrossRef CAS PubMed.
- Y. He, Z. Tang, Q. Song, H. Xie, Q. Xu, Y. Liu and G. Ling, Thermochim. Acta, 2008, 480, 15–21 CrossRef CAS PubMed.
- J.-w. Kim and H.-g. Lee, Metall. Mater. Trans. B, 2001, 32, 17–24 CrossRef PubMed.
- R. Yazami and A. Martinent, in Fluorinated Mater, Energy Conversion, Elsevier Science, 1st edn, 2005, ch. Fluorinate, pp. 173–194 Search PubMed.
- L. Terborg, S. Weber, F. Blaske, S. Passerini, M. Winter, U. Karst and S. Nowak, J. Power Sources, 2013, 242, 832–837 CrossRef CAS PubMed.
- L. Vogdanis and W. Heitz, Makromol. Chem., Rapid Commun., 1986, 7, 543–547 CrossRef CAS PubMed.
- L. Vogdanis, B. Martens, H. Uchtmann, F. Hensel and W. Heitz, Makromol. Chem., Rapid Commun., 1990, 191, 465–472 CrossRef CAS PubMed.
- S. E. Sloop, J. B. Kerr and K. Kinoshita, J. Power Sources, 2003, 119–121, 330–337 CrossRef CAS.
- J. S. Gnanaraj, E. Zinigrad, L. Asraf, H. E. Gottlieb, M. Sprecher, M. Schmidt, W. Geissler and D. Aurbach, J. Electrochem. Soc., 2003, 150, A1533 CrossRef CAS PubMed.
- G. Gachot, S. Grugeon, I. Jimenez-Gordon, G. G. Eshetu, S. Boyanov, A. Lecocq, G. Marlair, S. Pilard and S. Laruelle, Anal. Methods, 2014, 6, 6120 RSC.
- T. Kawamura, A. Kimura, M. Egashira, S. Okada and J.-I. Yamaki, J. Power Sources, 2002, 104, 260–264 CrossRef CAS.
- G. G. Botte and T. J. Bauer, J. Power Sources, 2003, 119–121, 815–820 CrossRef CAS.
- M. N. Richard and J. Dahn, J. Electrochem. Soc., 1999, 146, 2068 CrossRef CAS PubMed.
- W. Kong, H. Li, X. Huang and L. Chen, J. Power Sources, 2005, 142, 285–291 CrossRef CAS PubMed.
- A. Hammami, N. Raymond and M. Armand, Nature, 2003, 424, 635–636 CrossRef CAS PubMed.
- C. L. Campion, W. Li and B. L. Lucht, J. Electrochem. Soc., 2005, 152, A2327 CrossRef CAS PubMed.
- C. L. Campion, W. Li, W. B. Euler, B. L. Lucht, B. Ravdel, J. F. DiCarlo, R. Gitzendanner and K. M. Abraham, Electrochem. Solid-State Lett., 2004, 7, A194 CrossRef CAS PubMed.
| This journal is © The Royal Society of Chemistry 2015 |