Firmly bonded graphene–silicon nanocomposites as high-performance anode materials for lithium-ion batteries

Yifan Chen, Ning Du*, Hui Zhang and Deren Yang
State Key Lab of Silicon Materials and Department of Materials Science and Engineering, Cyrus Tang Center for Sensor Materials and Applications, Zhejiang University, Hangzhou 310027, People's Republic of China. E-mail: dna1122@zju.edu.cn; Fax: +86-571-87952322; Tel: +86-571-87953190

Received 7th April 2015 , Accepted 18th May 2015

First published on 18th May 2015


Abstract

We demonstrate the synthesis of firmly bonded reduced graphene oxide (RGO)@Si nanocomposites via the magnesiothermic reduction of graphene oxide (GO)@SiO2 nanocomposites. The uniform deposition of SiO2 layer on the GO nanosheets is achieved via controllable TEOS hydrolysis, which is a prerequisite for the synthesis of uniform RGO@Si nanocomposites. When used as an anode material for lithium-ion batteries, the as-synthesized RGO@Si nanocomposites show high reversible capacity and good cycling performance, which is better than bare Si nanoparticles and Si/RGO nanocomposites synthesized from physical blending Si nanoparticles and RGO nanosheets. It is believed that the improved electrochemical performance can be attributed to the novel uniform nanostructure and the introduction of RGO multilayers that can mitigate the volume expansion/contraction and enhance the electronic conductivity of Si anode materials.

1. Introduction

Lithium-ion batteries (LIBs) have been widely used as an energy storage system for portable electronic devices, and considered as the primary candidate for upcoming electric/hybrid vehicles due to their high energy density, good cycle life, and good power performance.1,2 However, the limited gravimetric capacity (372 mA h g−1) of graphitic materials has driven the intense research toward new anode materials with a large capacity at low potentials for LIBs.3 Silicon (Si) has the greatest lithium storage capacity per unit mass (4200 mA h g−1) and low discharge potential (0.37 mV vs. Li/Li+), which is regarded as one of the most promising potential candidates to replace graphite anode.4,5 Unfortunately, practical applications of Si anode material has not been realized due to the huge volume change (>300%) during the lithiation/de-lithiation process and the low intrinsic electrical conductivity, leading to poor cyclability and rate capability.6 Significant efforts have been made to improve the performance of Si anodes. One strategy is to prepare Si nanostructures of various morphologies, including Si nanoparticles,7,8 Si nanowires,9,10 and porous Si materials,11,12 which can accommodate the volume change during the lithiation/de-lithiation process. Another effective strategy is the combination of Si with carbon, which is intended to provide good electrical conductivity, good chemical and electrochemical stability, and acts as a buffer layer to accommodate the large volume change of Si anodes.13,14 In these approaches, the Si/C composite anodes show their potential in improving the overall electrochemical performance by combining the advantages of different carbon networks and Si.15–18

Graphene, a two-dimensional structure composed of carbon atoms, has garnered remarkable attention due to its unique physical and chemical properties such as excellent electrical conductivity, large theoretical surface area, good mechanical flexibility and superior chemical stability.19,20 Recently, graphene has been demonstrated as an active matrix for the preparation of Si/graphene nanocomposites to improve the electrochemical performance of Si-based anodes.21–30 The enhanced electrochemical performance can be attributed to the advantages that graphene can not only enhance the electrical conductivity and provide a support for Si nanostructures, but also constrain the large volume change during the lithiation/de-lithiation process. Many methods, such as physically blending the pre-synthesized Si nanocrystals and graphene/graphene oxide,21–23,25,26 chemical vapor deposition (CVD),29 covalent binding via aromatic linkers through diazonium chemistry30 have been reported to synthesize Si/graphene nanocomposites. For example, Zhu et al. synthesized a composite of nano-Si particles embedded homogeneously in graphene nanosheets electrode by using a simple discharge-plasma-assisted milling (P-milling) method, which exhibited good cycling performance and high capacity.22 Chang and coworkers successfully built a novel Si-based anode architecture by assembly of alternating Si/reduced graphene oxide (RGO) layers on porous Ni Foams, which exhibited a high reversible capacity and excellent rate capability due to the role of multilayer structures and the high conductive of graphene networks.23 Wen et al. reported a graphene-bonded and -encapsulated Si anode synthesized by an aerosol method, which delivered capacities of 2250 mA h g−1 at 0.1 A g−1 and excellent rate capability of 700 mA h g−1 at 1.2 A g−1.24 However, many difficulties still exist in the preparation of these Si/graphene anode materials. Firstly, the physical approach is difficult to obtain the homogeneous and stable Si/graphene nanocomposites. As a result, direct blending of graphene with Si can't form a distinct association between them and lithium diffusion could be hindered by sluggish ion diffusion for the detaching of Si and graphene sheets.31,32 Secondly, the utilization of graphene by mechanical peeling-off of graphite and the CVD method may be complex, time-consuming and costly, which may hinder their further applications. Therefore, it is crucial to develop a facile approach to prepare homogeneous and firm-bonded Si/graphene nanocomposites as an advanced anode materials for high-performance LIBs.

In this work, we design the RGO@Si nanocomposites via a simple in situ magnesiothermic reduction of pre-synthesized graphene oxide (GO)@SiO2 composites as an anode material for LIBs. Graphene oxide is a promising precursor for the creation of carbon-based nanostructures because it can be synthesized in large quantities by oxidizing inexpensive graphite powders and can be reduced through different methods to obtain tailored properties by controlling the reduction conditions.33 Meanwhile the GO nanosheets are functionalized with plenty of hydroxyl, epoxy, and carboxyl moieties, which can facilitate the homogeneous deposition of SiO2 in aqueous solution. Furthermore, the interconnected RGO layers provide a matrix to buffer the volume change and a conductive network to enhance the conductivity, which lead to the improved performance. Herein, the simple in situ magnesiothermic reduction of the pre-synthesized SiO2/GO composites is an effective strategy for the production of firmly-bonded and uniformly dispersed Si/graphene composites, which can offer large specific surface area and pathway for lithium transport and reaction, leading to a better cycling and rate performance.

2. Experimental

2.1. Synthesis of GO@SiO2 nanocomposites

The graphene oxide (GO) with the thickness of 0.8–1.2 nm and the diameter of 500 nm to 5 μm (purity > 99 wt%) was synthesized via the Hummers method by Nanjing XFNANO Materials Tech Co., Ltd. The as-prepared GO nanosheets were coated with SiO2 via the TEOS hydrolysis similar to our previous paper.34 Briefly, 30 mg GO was dispersed in a solution of 200 mL ethanol, 15 mL de-ionized water, and 15 mL concentrated ammonia aqueous solution (25 wt%). After ultrasonic dispersing by a ultrasonic cell crusher (JY92-IIDN, NINGBO SCIENTZ BIOTECHNOLOGY Co., Ltd.) for 60 min, followed by the dropwise addition of the silica precursors (TEOS, 4–12 mL, 10 vol%). The mixture was stirred vigorously at room temperature for 6 h, and ultrasonic dispersed for 2 min once every 2 h. After the coating process, the mixture was centrifugalized, washed copiously with ethanol, and dried at 60 °C in the vacuum oven.

2.2. Synthesis of RGO@Si nanocomposites

The RGO@Si nanocomposites were synthesized via a typical in situ magnesiothermic reduction process. Briefly, the as-prepared GO@SiO2 was mixed with magnesium powder (30 μm in size) by grinding (mass ratio 5[thin space (1/6-em)]:[thin space (1/6-em)]4) for 1 h. Subsequently, the mixture was heated to 650 °C for 7 h at a heating rate of 5 °C min−1 under an argon atmosphere (with 5 vol% H2) in a tube furnace (SK-GO6123K, TIANJING ZHONGHUAN Experiment Electric Furnace Co., Ltd. of China). After cooling down to room temperature, the powder was washed with HCl (0.2 mol L−1) and HF (1 vol%) acid solution for 12 h. Final product was collected by centrifugalization in deionized water and alcohol for three times, and then vacuum dried at room temperature.

2.3. Characterization and electrochemical measurements

The crystal structures of the products were identified by a high power X-ray diffraction (XRD) using a Rigaku D/max-ga X-ray diffractometer with graphite monochromatized Cu Kα radiation (λ = 1.54178 Å). The morphology and structure of the products were evaluated by scanning electron microscopy (FESEM HITACH S4800), Transmission electron microscopy (TEM HITACHI HT-7700 100 kV) and high-resolution transmission electron microscopy (HRTEM FEI Tecnai G2 F20 200 kV). The X-ray photoelectron spectroscopy test was performed using a Thermo ESCALAB 250Xi spectrometer with a monochromatic Al Kα line (1486.6 eV). The Raman experiments were performed with a HR800 Raman spectrometer using the 514 nm line of an Ar ion laser operated at 10 mW.

Electrochemical measurements were carried out using two-electrode cells with lithium metal as the counter and reference electrodes. The working electrodes were composed of the active material (RGO@Si nanocomposites), conductive material (acetylene black, ATB), and binder (carboxymethylcellulose sodium, CMC) with a weight ratio of 70[thin space (1/6-em)]:[thin space (1/6-em)]15[thin space (1/6-em)]:[thin space (1/6-em)]15. The uniform slurry was obtained after dissolving the three materials in the de-ionized water. Then the slurry was pasted onto the copper foils. After dried in the vacuum at 120 °C for 12 h, the half-cells were assembled in a glovebox (Mbraun, Labstar, Germany) under argon atmosphere (99.999%) in the presence of an oxygen scavenger and sodium as a drying agent. The electrolyte solution was composed of 1 M LiPF6 in ethylene carbonate/dimethyl carbonate (EC/DMC, 1[thin space (1/6-em)]:[thin space (1/6-em)]1 in volume). Cyclic voltammetry (CV) data were recorded on an Arbin BT 2000 system at a scan rate of 0.1 mV s−1. The electrodes were measured by using a galvanostatic discharge–charge method at a current density of 200 mA g−1 in the potential range of 0.001–2.0 V at room temperature on a Land CT2001A system.

3. Results and discussion

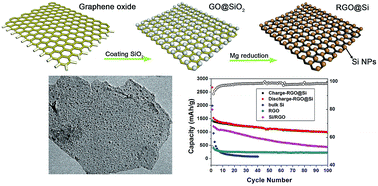
The synthetic procedure is schematically illustrated in Fig. 1. The raw graphene oxide was firstly coated with SiO2 through a TEOS hydrolysis method, leading to uniform GO@SiO2 nanosheets. Afterwards, magnesiothermic reduction and subsequent acid washing were carried out to prepare the firmly bonded RGO@Si nanocomposites.
image file: c5ra05869d-f1.tif
Fig. 1 Schematic illustrating the synthetic procedure for making firmly bonded RGO@Si nanocomposites.

The synthetic process and crystal structure of RGO@Si nanocomposites can be further identified by the XRD pattern (Fig. 2a) and Raman spectrum (Fig. 2b). As can be seen from the Fig. 2a, the peaks of the primitive materials are consistent with graphene oxide.35 After the coating of SiO2, a broad peak at ∼23° can correspond to amorphous cristobalite, while the peak intensity of graphene oxide is weaken, indicating the coating of SiO2 layer. After the magnesiothermic reduction and acid washing process, the final product gives three peaks located at 28.3°, 47.3° and 56.1°, indexed as the {111}, {220} and {311} planes of cubic Si (JCPDS no. 27-1402), respectively. Simultaneously, a broad peak at ∼22° is corresponding to the reduced graphene oxide (RGO) due to the thermal reduction process.36 A strong van der Waals' force between the graphene sheets decreases the layer spacing, which can prevent Si nanoparticles detachment from RGO films. As for the Raman spectrum (Fig. 2b), the final products show an intense peak at 518 cm−1, which is related to the crystalline Si nanoparticles.37 In addition, two typical peaks at ∼1340 cm−1 and ∼1580 cm−1 represent the D and G bands of RGO. It should be mentioned that the intensities of D and G peaks are similar, indicating that the RGO contains a large number of defects. It was reported that the defects on RGO sheets generated during the fabrication process (e.g., oxidation and reduction) could provide Li diffusion channels, and allow electrolytes to penetrate easily into the RGO and react electrochemically with Si NPs during the charge–discharge process.23


image file: c5ra05869d-f2.tif
Fig. 2 (a) XRD patterns of the bare graphene oxide (GO), GO@SiO2 and RGO@Si nanocomposites, (b) Raman spectrum of the RGO@Si nanocomposites.

Fig. 3a and b show the typical TEM images of the raw GO, revealing a rippled and curled morphology consisting of a thin wrinkled paper-like structure. It can be found that the GO sheet exhibits a thickness of 1–2 nm with a smooth surface. After the coating of SiO2, the surface of the GO sheet turns into rough and the highly loaded GO@SiO2 nanocomposites has been formed (Fig. 3c and d). It should be mentioned that no isolated SiO2 nanoparticles are observed except for the surface of the GO sheet, indicating the synthesis of uniform GO@SiO2 nanocomposites. The magnesiothermic reaction can be employed to obtain crystalline Si from amorphous SiO2,38 meanwhile, the GO can be converted into RGO in this reducing atmosphere at the same time. Herein, we use the magnesiothermic reaction to prepare uniform RGO@Si nanocomposites from GO@SiO2 nanosheets. Fig. 4a and b show the SEM images of the products after a magnesiothermic reaction and acid pickling. It can be seen that the RGO@Si nanocomposites shows a similar morphology with the GO@SiO2 nanosheets, indicating that the overall structure of the nanocomposites is retained after the thermal reduction. From the TEM images (Fig. 4c and d), we can see that the SiO2 nanoparticle on the sheet has been transformed into Si nanoparticles with the diameters of 5–30 nm, which adheres closely on the whole surface of RGO sheet. The Si nanoparticles are homogeneously anchored on the sheet and stand certain spacing with each other. In addition, there is almost no isolated nanoparticles expect for the surface of RGO, indicating the synthesis of uniform RGO@Si nanocomposites. The structure of the RGO@Si nanocomposites was further confirmed by the selected area electron diffraction (SEAD) pattern (inset in Fig. 4e). There are three diffraction rings in this pattern corresponding to the {111}, {220} and {311} planes of Si, respectively. Some bright spot in the pattern is corresponding to the single-crystalline Si. Fig. 4f shows the HRTEM image of an individual RGO@Si nanosheet. As observed, it clearly shows the continuous fringes in the same orientation, indicating the attached nanoparticle is crystalline and the lattice spacing of 0.32 nm corresponds to the {111} plane of Si, further confirming the deposition of Si nanoparticles.


image file: c5ra05869d-f3.tif
Fig. 3 TEM images of the (a) low and (b) high-magnification of raw GO, (c) low and (d) high-magnification of GO@SiO2 nanocomposites.

image file: c5ra05869d-f4.tif
Fig. 4 Morphological characterizations of the as-synthesized RGO@Si nanocomposites: (a) low and (b) high-magnification SEM images, (c) low and (d) high-magnification TEM images, (e) and (f) HRTEM images.

For comparison, Si/RGO nanocomposites were also prepared by physically blending pre-synthesized Si nanoparticles and graphene nanosheets. Briefly, the pre-synthesized Si nanocrystals and GO suspension were mixed to synthesize the Si/GO nanocomposites. Then, the nanocomposite were reduced under the same experimental conditions to obtain the Si/RGO nanocomposites32 (Fig. 5). As can be seen, the Si NPs with diameters of about 5–20 nm were distributed randomly on the RGO sheet, and uniform deposition can't be achieved due to the serious aggregation of Si NPs. According to the previous research, Si NPs do not mix well with graphene oxide aqueous suspension and thus create severe segregation of the materials.39 Therefore, uniform deposition of SiO2 layer and subsequent in situ reduction process are necessary for the strong interaction between Si NPs and RGO sheets, which is also prerequisite for the synthesis of uniform RGO@Si nanocomposites.


image file: c5ra05869d-f5.tif
Fig. 5 Morphological and structural characterizations of as-prepared Si/RGO nanocomposites fabricated from the pre-synthesized Si nanocrystals and GO suspension under the same experimental conditions: (a) low and (b) high-magnification SEM images.

Fig. 6 shows the FESEM image and EDX pattern of the as-synthesized firmly bonded RGO@Si nanocomposites. It can be seen that the nanoparticles show a high density on the surface of RGO sheet (Fig. 6a). Moreover, Si NPs have been uniformly deposited onto the surface of RGO nanosheet and no additional nanoparticle agglomeration can be observed, which is consistent with the TEM image (Fig. 4c). The elements C, O and Si are expected from the RGO and Si NPs with a weight ratio of 19[thin space (1/6-em)]:[thin space (1/6-em)]5[thin space (1/6-em)]:[thin space (1/6-em)]26 (Fig. 6b), indicating that the content of carbon is about ∼40 wt%. It should be mentioned that the existed O may come from the O-functionalities of RGO, and natural oxidation of Si NPs. XPS analysis was employed to further confirm the transformation from GO@SiO2 nanosheets to RGO@SiO2 nanocomposites (Fig. 7). From the C1s XPS spectra (Fig. 7a), It can be seen that the binding energy of C1s peaks were assigned to sp2 carbon with carbon neighbors (284.5 eV), carbonyl carbon (C[double bond, length as m-dash]O, 286.7 eV), carboxylate carbon (O–C[double bond, length as m-dash]O, 289.0 eV).40 The XPS spectrum of Si2p is straightforward. The pristine GO@SiO2 nanosheets displayed a broad peak attributed to the Si–O bonds of SiO2 layers (Fig. 7b). After the reduction process and subsequent acid treatment, the peak of SiO2 disappears and the peak of Si emerges (∼99 eV), confirming the reduction of SiO2.41 The semiquantitative analysis was also performed to investigate the carbon content of the RGO@Si nanocomposites. It suggests that the content of carbon is ∼41 wt% in the active materials, which is roughly consistent with the EDX value.


image file: c5ra05869d-f6.tif
Fig. 6 FESEM image (a) and EDX pattern (b) of the as-synthesized uniform RGO@Si nanocomposites.

image file: c5ra05869d-f7.tif
Fig. 7 XPS spectra for the samples formed in the synthesis process of RGO@Si nanocomposites (a) the C1s spectra, (b) the Si2p spectra.

In order to illustrate the superiority of as-prepared firmly bonded RGO@Si nanocomposites, we examine their lithium storage performance as an anode material for LIBs. Fig. 8a shows the current–voltage (CV) curves for the RGO@Si nanocomposites with a potential range of 0.001–2.0 V (vs. Li+/Li) at a scanning rate of 0.1 mV s−1. The CV curves are in good agreement with the previously reported Si/graphene nanocomposite anode.42 In the first cycle, a distinct broad peak located at ∼0.8 V in the charge profile is ascribed to the formation of the SEI films on the surface of the nanocomposites. Another peak appears at ∼0.2 V represents the insertion of lithium ion to form a series of LixSi, which is the typical peak of Si anode. In the anodic process, two broad peaks at ∼0.4 and 0.5 V represent the de-lithiation process. In addition, the CV curve of the third scan is well overlapped with that of the second one, suggesting the high reversibility of the following lithiation/de-lithiation process. Fig. 8b shows the 1st, 2nd, 3rd and 10th charge and discharge curves of RGO@Si nanocomposites at a current density of 200 mA g−1 in the voltage range of 0.001–2.0 V. The initial discharge and charge capacities of the RGO@Si nanocomposite anode are approximately 2677 and 1424 mA h g−1, respectively, indicating an initial Coulombic efficiency of 53%. It should be mentioned that such a low initial Coulombic efficiency was reported in various Si/graphene anode materials.21,22,27 It is indicated that the multilayer structure and extremely large surface area contributes a lot to the irreversible SEI films. The reaction of oxygen-containing functional groups on RGO with lithium ions and silicon oxide on the surface of Si NPs may also lead to the low initial Coulombic efficiency.23 In addition, many lithium ions were trapped in the loss contact LixSi parts at the first discharge process during the low potential zone, which can't be extracted again during the charge process at the applied current (200 mA g−1) and potential (2 V vs. Li/Li+). At the 30th cycle, the RGO/Si nanocomposites electrode delivered 1226 mA h g−1 with about 86% capacity retention, indicating the high reversibility.


image file: c5ra05869d-f8.tif
Fig. 8 (a) Current–voltage (CV) curves for the first three cycles of the RGO@Si core–shell nanocomposites; (b) the voltage profiles of the porous RGO@Si nanocomposites anode at 200 mA g−1 between 0.001 and 2 V; (c) charge and discharge capacities as well as Coulombic efficiency as a function of cycle numbers of the RGO@Si nanocomposites, bulk Si, RGO and Si/RGO nanocomposites at a current density of 200 mA g−1 between 0.001 and 2.0 V at room temperature; (d) cycling performance of RGO@Si nanocomposites electrodes with different amount of carbon; (e) rate performance of uniform RGO@Si nanocomposites electrode with a carbon content of 60%; (f) impedance measurements of bulk Si electrode and RGO@Si nanocomposites.

To illustrate the advantages of architectures on electrochemical performance, the cycling performance of bare Si NPs, RGO nanosheets, Si/RGO and RGO@Si nanocomposites has been compared at a current density of 200 mA g−1 (Fig. 8c). It is obvious that the Si NPs show the rapid capacity decay from 1988 to 241 mA h g−1 just after 8 cycles. The RGO nanosheets show better reversibility than the Si NPs while the reversible capacity and initial Coulombic efficiency is relatively low (∼30%). Meanwhile, the Si/RGO nanocomposites prepared from physical blending Si nanoparticles and RGO nanosheets show capacity decay from 1844 to 435 mA h g−1 after 100 cycles, which may be attributed to the detachment between Si NPs and RGO. For comparison, the RGO@Si nanocomposites show less capacity fading and a capacity of ∼1000 mA h g−1 is achieved after 100 cycles at 200 mA g−1, which is three times higher than the limited gravimetric capacity of graphite (372 mA h g−1) and better than the other three materials.

In order to evaluate the effects of RGO, the cycling performance of the RGO@Si nanocomposites with different amount of RGO has been compared. The carbon content can be tuned by varying the amount of TEOS, with the other parameters unchanged. Fig. 8d shows the discharge capacities versus cycle number for RGO@Si nanocomposites with different carbon content at current density of 200 mA g−1. As can be seen, the samples with only 20% carbon shows rapid capacity decay from 1616 to 480 mA h g−1 after 100 cycles, which may be due to the severely aggregation of Si NPs and many Si NPs would not be anchored on the RGO sheets. Otherwise, the samples with more amount of carbon (40% and 60%) both exhibited better reversibility than the samples with less amount of carbon (20%). Although the increased carbon content significantly decreased the specific capacities, while the reversibility of nanocomposites can be improved. Therefore, the combination of RGO can not only enhance the electric conductivity but also buffer the pulverization of Si upon lithiation, which may be responsible for the good cyclic stabilities.

Fig. 8e shows the discharge and charge capacities of RGO@Si nanocomposites at current density between 200 and 3200 mA g−1. From this curve, the RGO@Si nanocomposites show a capacity of ∼1150 mA h g−1 at 200 mA g−1 and change to 1040, 940 and 800 mA h g−1 when the current density increases to 400, 800 and 1600 mA g−1. Even at a current density as high as 3200 mA g−1, the nanocomposite electrode is capable of delivering a stable capacity of ∼670 mA h g−1. When the current density has been reset to 400 mA g−1, nearly 87% of the initial capacity (about 900 mA h g−1) can be recovered, indicating the good rate capability of the as-prepared RGO@Si nanocomposites. The high capacity, good cycling performance and enhanced rate capability are likely due to the novel uniform and multilayer structures, which can buffer the volume change and give more reacting sites for lithium ions. Furthermore, the continuous and curly RGO films can enhance the electronic conductivity of the active materials and provide high mechanical stability. Moreover, the strong bonding force between Si NPs and RGO layers facilitate the stability of the nanocomposites during the charge–discharge process. The above-mention reasons may lead to the good electrochemical performance.

To further investigate the mechanism of the enhanced electrochemical performance, the electrochemical impedance spectra of the RGO@Si nanocomposites and bare Si NPs were measured in Fig. 8f. The Nyquist plots for the above two electrodes both display a straight line in the low frequency region and a depressed semicircle in the high frequency region. The depressed semicircle in the high-to-medium frequency region is related to the SEI film (RSEI) and the charge-transfer resistance (Rct) through the electrode/electrolyte interface. The inclined line in the low frequency region corresponds to the Warburg impedance (Zw) during the solid-state lithium-diffusion process in the electrode materials.43 It is obvious that the diameter of the semicircle in the RGO@Si nanocomposite electrode is significantly smaller than that of the bulk Si particles, indicating the ease of charge transfer during the lithiation/de-lithiation process. These results indicate that the presence of RGO nanosheets can dramatically improve the electric conductivity and facilitate the formation of a stable and dense SEI film, which leads to the improved performance of RGO@Si nanocomposite electrodes.

4. Conclusions

In summary, firmly bonded RGO@Si nanocomposites were successfully synthesized via the magnesiothermic reduction of pre-synthesized GO@SiO2 nanocomposites. The synthesis of uniform GO@SiO2 nanosheets and subsequent in situ reduction process play the key role in the formation of firmly bonded RGO@Si nanocomposites. The as-synthesized RGO@Si nanocomposites were evaluated as anodes for LIBs, which exhibited high reversible capacity, excellent cycling performance and good rate capability. The performance is extremely better than bare Si nanoparticles and Si@RGO nanocomposites. The novel uniform nanostructure and the introduction of RGO multilayers can mitigate the volume expansion/contraction and enhance the electronic conductivity, which may be responsible for the enhanced performance.

Acknowledgements

The authors would like to appreciate the financial supports from the 863 Project (no. 2011AA050517), Natural Science Foundation of China (no. 51002133), Zhejiang Provincial Natural Science Foundation of China (LY13E020003), the Fundamental Research Funds for the Central Universities, and Program for Innovative Research Team in University of Ministry of Education of China (IRT13R54).

Notes and references

  1. M. Armand and J. M. Tarascon, Nature, 2008, 451, 652–657 CrossRef CAS PubMed.
  2. T. Kim, J. Park, S. K. Chang, S. Choi, J. H. Ryu and H. Song, Adv. Energy Mater., 2012, 2, 860–872 CrossRef CAS PubMed.
  3. J. B. Goodenough and Y. Kim, Chem. Mater., 2010, 22, 587–603 CrossRef CAS.
  4. A. Magasinski, P. Dixon, B. Hertzberg, A. Kvit, J. Ayala and G. Yushin, Nat. Mater., 2010, 9, 353–358 CrossRef CAS PubMed.
  5. A. Kohandehghan, P. Kalisvaart, M. Kupsta, B. Zahir, B. S. Amirkhiz, Z. Li, E. L. Memarzadeh, L. A. Bendersky and D. Mitlin, J. Mater. Chem. A, 2013, 1, 1600–1612 CAS.
  6. X. Zhao, C. M. Hayner, M. C. Kung and H. H. Kung, Adv. Energy Mater., 2011, 1, 1079–1084 CrossRef CAS PubMed.
  7. Q. Zhang, W. Zhang, W. Wan, Y. Cui and E. Wang, Nano Lett., 2010, 10, 3243–3249 CrossRef CAS PubMed.
  8. Y. Chen, S. Zeng, J. Qian, Y. Wang, Y. Cao, H. Yang and X. Ai, ACS Appl. Mater. Interfaces, 2014, 6, 3508–3512 CAS.
  9. L. Cui, Y. Yang, C. Hsu and Y. Cui, Nano Lett., 2009, 9, 3370–3374 CrossRef CAS PubMed.
  10. A. M. Chockla, J. T. Harris, V. A. Akhavan, T. D. Bogart, V. C. Holmberg, C. Steinhagen, C. B. Mullins, K. J. Stevenson and B. A. Korgel, J. Am. Chem. Soc., 2011, 133, 20914–20921 CrossRef CAS PubMed.
  11. Y. Yao, M. T. McDowell, I. Ryu, H. Wu, N. Liu, L. Hu, W. D. Nix and Y. Cui, Nano Lett., 2011, 11, 2949–2954 CrossRef CAS PubMed.
  12. H. Tao, L. Fan, W. Song, M. Wu, X. He and X. Qu, Nanoscale, 2014, 6, 3138–3142 RSC.
  13. X. Xin, X. Zhou, F. Wang, X. Yao, X. Xu, Y. Zhu and Z. Liu, J. Mater. Chem., 2012, 22, 7724–7730 RSC.
  14. B. Wang, X. Li, X. Zhang, B. Luo, M. Jin, M. Liang, S. A. Dayeh, S. T. Picraux and L. Zhi, ACS Nano, 2013, 7, 1437–1445 CrossRef CAS PubMed.
  15. S. Xin, Y. Guo and L. Wan, Acc. Chem. Res., 2012, 45, 1759–1769 CrossRef CAS PubMed.
  16. B. Fuchsbichler, C. Stangl, H. Kren, F. Uhlig and S. Koller, J. Power Sources, 2011, 196, 2889–2892 CrossRef CAS PubMed.
  17. C. Xiao, N. Du, X. Shi, H. Zhang and D. Yang, J. Mater. Chem. A, 2014, 13, 20494–20499 Search PubMed.
  18. D. S. Jung, T. H. Hwang, S. B. Park and J. W. Choi, Nano Lett., 2013, 13, 2092–2097 CrossRef CAS PubMed.
  19. E. Yoo, J. Kim, E. Hosono, H. Zhou, T. Kudo and I. Honma, Nano Lett., 2008, 8, 2277–2282 CrossRef CAS PubMed.
  20. J. Wu, W. Pisula and K. Müllen, Chem. Rev., 2007, 107, 718–747 CrossRef CAS PubMed.
  21. D. Chen, R. Yi, S. Chen, T. Xu, M. L. Gordin and D. Wang, Solid State Ionics, 2014, 254, 65–71 CrossRef CAS PubMed.
  22. W. Sun, R. Hu, H. Liu, M. Zeng, L. Yang, H. Wang and M. Zhu, J. Power Source, 2014, 268, 610–618 CrossRef CAS PubMed.
  23. J. Chang, X. Huang, G. Zhou, S. Cui, P. B. Hallac, J. Jiang, P. T. Hurley and J. Chen, Adv. Mater., 2014, 26, 758–764 CrossRef CAS PubMed.
  24. Y. Wen, Y. Zhu, A. Langrock, A. Manivannan, S. H. Ehrman and C. Wang, Small, 2013, 9, 2810–2816 CrossRef CAS PubMed.
  25. Y. Zhu, W. Liu, X. Zhang, J. He, J. Chen, Y. Wang and T. Cao, Langmuir, 2013, 29, 744–749 CrossRef CAS PubMed.
  26. X. Zhou, A. Cao, L. Wan and Y. Guo, Nano Res., 2012, 5, 845–853 CrossRef CAS.
  27. Y. Q. Zhang, X. H. Xia, X. L. Wang, Y. J. Mai, S. J. Shi, Y. Y. Tang, C. G. Gu and J. P. Tu, J. Power Sources, 2012, 213, 106–111 CrossRef CAS PubMed.
  28. B. P. N. Nguyen, N. A. Kumar, J. Gaubicher, F. Duclairoir, T. Brousse, O. Crosnier, L. Dubois, G. Bidan, D. Guyomard and B. Lestriez, Adv. Energy Mater., 2013, 3, 1351–1357 CrossRef CAS PubMed.
  29. K. Evanoff, A. Magasinski, J. Yang and G. Yushin, Adv. Energy Mater., 2011, 1, 495–498 CrossRef CAS PubMed.
  30. S. Yang, G. Li, Q. Zhu and Q. Pan, J. Mater. Chem., 2012, 22, 3420–3425 RSC.
  31. S. Chou, J. Wang, M. Choucair, H. Liu, J. A. Stride and S. Dou, Electrochem. Commun., 2010, 12, 303–306 CrossRef CAS PubMed.
  32. J. K. Lee, K. B. Smith, C. M. Hayner and H. H. Kung, Chem. Commun., 2010, 46, 2025–2027 RSC.
  33. S. Mao, Z. Wen, H. Kim, G. Lu, P. Hurley and J. Chen, ACS Nano, 2012, 6, 7505–7513 CrossRef CAS PubMed.
  34. Y. Chen, N. Du, H. Zhang and D. Yang, J. Alloys Compd., 2015, 622, 966–972 CrossRef CAS PubMed.
  35. D. A. Dikin, S. Stankovich, E. J. Zimney, R. D. Piner, G. H. B. Dommett, G. Evmenenko, S. T. Nguyen and R. S. Ruoff, Nature, 2007, 448, 457–460 CrossRef CAS PubMed.
  36. H. Xiang, K. Zhang, G. Ji, J. Y. Lee, C. Zou, X. Chen and J. Wu, Carbon, 2011, 49, 1787–1796 CrossRef CAS PubMed.
  37. L. Mai, Y. Dong, L. Xu and C. Han, Nano Lett., 2010, 10, 4273–4278 CrossRef CAS PubMed.
  38. D. Chen, X. Mei, G. Ji, M. Lu, J. Xie, J. Lu and J. Y. Lee, Angew. Chem., Int. Ed., 2012, 51, 2409–2413 CrossRef CAS PubMed.
  39. D. P. Wong, H. Tseng, Y. Chen, B. Hwang, L. Chen and K. Chen, Carbon, 2013, 63, 397–403 CrossRef CAS PubMed.
  40. D. Yang, A. Velamakanni, G. Bozoklu, S. Park, M. Stoller, R. D. Piner, S. Stankovich, I. Jung, D. A. Field, C. A. Ventrice and R. S. Ruoff, Carbon, 2009, 47, 145–152 CrossRef CAS PubMed.
  41. H. Kim, M. Seo, M. Park and J. Cho, Angew. Chem., Int. Ed., 2010, 49, 2146–2149 CrossRef CAS PubMed.
  42. E. Pollak, G. Salitra, V. Baranchugov and D. Aurbach, J. Phys. Chem. C, 2007, 111, 11437–11444 CAS.
  43. J. Wang, J. Chen, K. Konstantinov, L. Zhao, S. H. Ng, G. X. Wang, Z. P. Guo and H. K. Liu, Electrochim. Acta, 2006, 51, 4634–4638 CrossRef CAS PubMed.

This journal is © The Royal Society of Chemistry 2015
Click here to see how this site uses Cookies. View our privacy policy here.