Nanoparticles' interference in the evaluation of in vitro toxicity of silver nanoparticles

Ling Liangabc, Menghua Cuic, Mei Zhangc, Peiwen Zhengc, Zhaoyi Deng c, Shanshan Gaoc, Xinsheng Wangc, Xiaoyun Zhang*a, Chen Wangb, Ying Liu*b and Liming Xiec
aCollege of Chemistry and Chemical Engineering, Lanzhou University, Lanzhou, 730000, P. R. China. E-mail: xyzhang@lzu.edu.cn; Tel: +86 931 8912589
bLaboratory for Biological Effects of Nanomaterials and Nanosafety, National Center for Nanoscience and Technology, Beijing 100190, P. R. China. E-mail: liuy1@nanoctr.cn; Tel: +86 010 8254 5665
cKey Laboratory of Standardization and Measurement for Nanotechnology of Chinese Academy of Sciences, National Center for Nanoscience and Technology, Beijing 100190, P. R. China

Received 2nd April 2015 , Accepted 29th July 2015

First published on 29th July 2015


Abstract

The biological safety of nanomaterials is a worldwide concern considering the extensive usage of nanoparticles in daily life as well as in medical care. However, toxicity evaluation of nanomaterials has met difficulties because of unique properties of nanomaterials. Here, we have investigated the interference of nanoparticles on the toxicity evaluations. Silver nanoparticles (AgNPs) with different sizes and surface coatings were used as model materials. Several widely used assays, such as lactate dehydrogenase (LDH) release, MTS assay and nitric oxide (NO) measurement, have been investigated in our study. Our results showed that 20 nm PVP-coated AgNPs with a concentration of 42.8 μg mL−1 affected LDH detection by about 50%, while citrate-coated 20 nm AgNPs with a concentration of 42.8 μg mL−1 affected LDH detection by about 70%. Moreover, 20 nm AgNPs with a concentration of 42.8 μg mL−1 disturbed MTS assay and NO measurement by less than 20% and 10%, respectively. Based on our results, nanoparticles with higher concentrations gave more interference. Therefore, for accurate toxicity evaluation of nanoparticles, it is very necessary to limit particle concentrations or choose other approaches free from the interference.

1. Introduction

The European Commission has defined nanoparticles as materials whose main components have one dimension between 1 and 100 billionth of a meter.1 In recent years, engineered nanomaterials are increasingly applied in daily life products because of their unique characteristics including a large specific surface area, high chemical reactivity, and high internal pore volumes when compared with large-sized materials.2 Along with the extensive applications, the potential health concerns resulting from inevitable human exposure to nanomaterials have been raised due to a lack of a clear understanding of their specific interactions with biological systems. So far, the published results about the evaluations of nanomaterial biosafety are almost directly obtained through traditional biological methods. However, it might not guaranteed that these methods can work equally well for nanomaterials. Due to their special properties, nanomaterials may interfere with these assays and produce false positive or false negative data leading to an unreal assessment of toxicity. Rodriguez-Lorenzo L. et al. have mentioned that the higher concentration of gold nanoparticles (AuNPs) interfere with colorimetric assays such as lactate dehydrogenase (LDH) assay.3

Nanomaterials' interference can happen during every evaluation procedure. Firstly, nanomaterials may interact with molecules including chemical compounds and biological macromolecules (proteins) in the solution.4–6 Here, there are two possible interactions. One is that nanomaterials can absorb assay compounds onto the surface of nanomaterials and then decreases the effective concentrations of chemical compounds and/or enzymes in the solution.7 For example, due to the replacement of active sites by the binding sites the tryptophanase lost the enzymatic activity upon associating with bare or carbonate-coated silver nanoparticles (AgNPs).8 And it has been also validated that a lot of molecules including biological macromolecules (e.g. proteins) have a strong affinity for nanoparticles.5 It's also reported that dye molecules from MTT or WST-1 assays can be absorbed by single-walled carbon nanotubes which include activated carbon, impairing the precise measurements.9–11 AgNPs interfere with LDH assay partly due to LDH absorption onto AgNPs.4,12 The other possible interaction is that nanomaterials can directly or indirectly react with agents such as small molecules and enzymes used in the assay. The key properties of nanomaterials can govern the interaction between enzyme and nanoparticles.13 Some carbonaceous nanomaterials including single-walled carbon nanotubes could reduce the tetrazolium compound in MTT assays to the formazan product in cell-free systems.10,11 AuNPs or platinum particles can catalyze the oxidation of dihydronicotinamide adenine dinucleotide (NADH) to NAD+ which are involved in LDH assay.14,15 Reactive oxygen species (ROS) may be another reason for the false results in a LDH assay for AgNPs.4

Secondly, the optical properties of nanomaterials can interfere with light absorption and/or fluorescence in the optical signal detection. Many biological quantitative assays including viability assays (MTT, MTS, WST-1 or XTT), LDH assay for detecting membrane integrity rely on light absorption or fluorescence measurements. Some nanomaterials including carbonaceous and metal particles including AuNPs and AgNPs have plasmonic excitation in the visible region which can cause light absorption, fluorescence quenching or enhancing. Accordingly, these particles might impair the product absorption spectrum, thereby confounding the testing results.16 The interference from light absorption or fluorescence of nanomaterials is generally related to the composition and concentrations of materials.17

AgNPs due to their broad-spectrum antimicrobial properties have been used in consumer products than any other nanomaterials.18–20 As antimicrobial agents, AgNPs are applied in food supplements, food packaging materials, disinfectants, electronic appliances, air filters, coatings on medical devices and cosmetic products.21,22 In addition, AgNPs have been confirmed to have anti-fungi, anti-virus, anti-inflammation, anti-biofilm and anti-thrombosis effects as well as enhance wound healing.23–29 AgNPs can also increase cell membrane permeability, promote reactive oxide species (ROS) production, induce apoptosis and cause genotoxicity by DNA damage.30 The increased global applications of AgNPs in various fields require a more detailed understanding of their potential biological toxicity.

Here in the present study, we have investigated the interference of AgNPs with different sizes and surface coatings on several common biological assays for toxicity evaluation. Our results have showed that AgNPs exhibits different effects on the detection of LDH release, MTS assay and nitric oxide (NO) measurement. This study illustrates that the disturbance of nanomaterials (e.g. AgNPs) on the detection per se might be tested for the assay suitability so that the best way can be chosen for the toxicity assessment in the future.

2. Experimental section

2.1 Materials

Endotoxin-free AgNPs (#AGPB20, #AGCB20, #AGCB110) were purchased from NanoComposix. Triton-X-100, LDH, lipopolysaccharide (LPS), N-(1-naphthyl) ethylene diaminedihydro chloride (NED), sulfanilamide, phosphoric acid (H3PO4) and 0.1 M sodium nitrite (NaNO2) were purchased from Sigma-Aldrich. Dulbecco's Modified Eagle's Medium (DMEM), RPMI 1640 (without phenol red), 1× phosphate buffered saline (PBS), 100× penicillin/streptomycin were purchased from Cellgro. Fetal bovine serum (FBS) was from Hyclone. Glutamax and 0.25% Trypsin were purchased from Gibco. LDH Cytotoxicity Detection kit was purchased from Roche. And CellTiter 96®Aqueous One Solution was bought from Promega.

2.2 Characterization of AgNPs

AgNPs were thoroughly characterized prior to use. The morphology and sizes of AgNPs were studied with an operating voltage of 200 kV by transmission electron microscopy (TEM, Tecnai F20, FEI, USA). A drop of AgNP suspension in water at the concentration of 5 μg mL−1 was added onto a copper grid coated by a carbon membrane and dried at room temperature. UV-vis spectral analysis of AgNPs was performed using a Lambda 950 spectrophotometer (Lambda 950, PerkinElmer, USA) from 200 to 800 nm. The hydrodynamic size and zeta potential of AgNPs were analyzed by dynamic light scattering (DLS) on a Malvern Zetasizer Nano ZS (Malvern Instruments, Worcestershire, UK) at 25 °C. AgNPs were dispersed in deionization water, DMEM culture medium with 1% FBS and DMEM culture medium with 10% FBS, respectively. Additionally, all AgNPs were endotoxin-free according to the product datasheets.

2.3 Cell culture

Human hepatoma carcinoma cell line Hep G2 and mouse macrophage cell line RAW 264.7 were purchased from Institute of Basic Medical Sciences, Chinese Academy of Medical Sciences. The Hep G2 cells were cultured in regular growth medium consisting of high glucose DMEM and RAW 264.7 in RPMI 1640 supplemented with 2 mM Glutamax, 100 U mL−1 penicillin/100 μg mL−1 streptomycin and 10% FBS at 37 °C in a 5% CO2 humidified incubator. Exponentially growing Hep G2 cells were detached with 0.25% trypsin-EDTA, while RAW 264.7 cells were blown off with a pipette.

2.4 Lactate dehydrogenase (LDH) release

As a general assessment for cytotoxicity, the release of LDH from destroyed cells was measured with the Cytotoxicity Detection kit (Roche, Germany).

To evaluate the interference of AgNPs on LDH detection, this experiment was designed according to the kit manual and carried out without cells. Briefly, DMEM medium (DMEM + 10% FBS), assay medium (AM, DMEM +1% FBS), LDH standard solution, and AgNPs of different concentrations were added into a 96-well plates. The total volume in each well was 200 μL. After shaking, 100 μL of supernatant was transferred to another 96-well plate followed by the addition of 100 μL reaction solution. After 30 min incubation at room temperature, LDH was quantified photometrically by measuring at 490 nm with 680 nm as reference wavelength by a microplate reader (Infinite 200, Austria). This experiment was repeated at least three times.

For LDH assay with cells, Hep G2 cells were seeded in a 96-well plate at 4 × 10⁴ cells per well and permitted to grow for 24 h at 37 °C in a 5% CO2 humidified incubator. Then, the medium was replaced with AM as the negative control (NC), 0.1% Triton-X-100 as the positive control, 2% Triton-X-100 as the maximum LDH release (max) or AgNPs for 24 h incubation. According to the manual of Cytotoxicity Detection kit (Roche, Germany), the supernatant was transferred to another 96-well plate followed by the addition of reaction solution. After 30 min incubation at room temperature, the absorbance ([A]) was measured at 490 nm with 680 nm as the reference wavelength using a microplate reader. The relative activity LDH (%) was calculated by ([A]sample − [A]NC)/([A]max − [A]NC) × 100%. [A] was the absorbance subtracted with the corresponding background in cell-free condition.

2.5 Cell viability assay (MTS assay)

MTS (3-(4,5-dimethylthiazol-2-yl)-5-(3-carboxymethoxyphenyl)-2-(4-sulfophenyl)-2H-tetrazolium, inner salt) assay was performed with CellTiter 96® AQueous One Solution Reagent (Promega, USA).

To explore the disturbance of AgNPs on MTS assay, briefly, cells were seeded in a 96-well plate at 8 × 10⁴ cells per well and permitted to grow for 24 h at 37 °C in a 5% CO2 humidified incubator. Control wells were filled with DMEM culture medium. Subsequently, 20 μL CellTiter 96®Aqueous One Solution Reagent as well as 20 μL AgNPs was added into each well. After 2 h incubation at 37 °C, the absorbance was measured at 490 nm using a microplate reader. This experiment was done at least three times.

For the actual cell viability assay, Hep G2 cells were seeded in a 96-well plate at 4 × 10⁴ cells per well. After 24 h incubation, the old medium was removed. AgNPs were added into the corresponding wells. Then, the plate was placed at 37 °C in a 5% CO2 humidified incubator for another 24 h. 20 μL of CellTiter 96®Aqueous One Solution Reagent was added into each well. After 2 h incubation at 37 °C, the absorbance was measured at 490 nm using a microplate reader. The relative cell viability (%) was calculated by [A]sample/[A]control × 100%. [A] was the absorbance subtracted with the corresponding background in cell-free condition.

2.6 Nitric oxide production (NO assay)

The oxidative end-products nitrite (NO2) of antibacterial effectors' molecule NO in the cell culture medium was assessed by Griess reagent. To evaluate the noncellular interference of AgNPs on NO detection, the experiment was carried out without cells. Briefly, RPMI 1640 culture medium without phenol red, NaNO2 standard solution, and different concentrations of AgNP solutions were added into a 96-well plate and incubated at 37 °C for 24 h in a humidified 5% CO2 incubator. The total volume in each well was 100 μL. Then, 100 μL Griess reagent or 2.5% H3PO4 was added into the corresponding wells. After shaking, the 96-well plate was placed on a microplate reader for the absorbance detection at 550 nm. This experiment was conducted at least three times.

3. Results and discussion

3.1 Physicochemical characterization of silver nanoparticles (AgNPs)

The size distribution and morphology of AgNPs were characterized by transmission electron microscopy (TEM) (Fig. 1a–c). 20 nm PVP-coated AgNPs (AgNP-PVP-20), 20 nm citrate-coated AgNPs (AgNP-CIT-20) and 110 nm citrate-coated AgNPs (AgNP-CIT-110) were used in our experiments. TEM images revealed that AgNPs were approximately in a spherical shape. The average diameters and the size standard deviation of AgNPs were 23.3 ± 4.1 nm for AgNP-PVP-20, 22.7 ± 3.7 nm for AgNP-CIT-20, and 101.1 ± 8.7 nm for AgNP-CIT-110, respectively. Particle size distribution demonstrated a narrow size distribution statistically obtained by TEM images.
image file: c5ra05863e-f1.tif
Fig. 1 Physicochemical characterizations of AgNPs. TEM images and the corresponding particle size distributions (insets) of (a) AgNP-PVP-20, (b) AgNP-CIT-20 and (c) AgNP-CIT-110. (d) UV-vis absorption spectra of AgNPs.

The maximum absorption wavelengths of AgNPs were around 400 nm for AgNP-PVP-20 and AgNP-CIT-20, and 501 nm for AgNP-CIT-110. The hydrodynamic size (dH), particle agglomeration, and zeta potential (ζ) of AgNPs in water solution as well as in different culture media used in this study were summarized in Table 1. In water, there was no aggregation for citrate-coated AgNPs (20 or 110 nm) and only mild aggregation of AgNP-PVP-20 as its hydrodynamic diameter was 43.2 ± 0.9 nm. However, much more aggregation for both AgNP-PVP-20 and AgNP-CIT-20 in culture medium supplied with serum (>100 nm of the hydrodynamic diameter). That indicated that the culture medium can promote AgNP aggregation.31,32 The zeta potentials for AgNP-PVP-20, AgNP-CIT-20 and AgNP-CIT-110 in water were −11.8 ± 0.6 mV, −23.9 ± 0.9 mV and −31.9 ± 0.5 mV, respectively. And all AgNPs showed negative surface charge in cell culture medium.

Table 1 Characterization of AgNPs
Characterization AgNP-PVP-20 AgNP-CIT-20 AgNP-CIT-110
Size/nm (TEM) 23.3 ± 4.1 22.7 ± 3.7 101.1 ± 8.7
Morphology Spherical Spherical Spherical
λmax/nm (water) 400 400 501
dH/nm (water) 43.2 ± 0.9 25.2 ± 0.3 112.4 ± 1.7
ζ/mV (water) −11.8 ± 0.6 −23.9 ± 0.9 −31.9 ± 0.5
dH/nm (DMEM with 1% FBS, AM) 121.5 ± 1.0 139.1 ± 0.8 148.1 ± 2.8
ζ/mV (DMEM with 1% FBS, AM) −13.7 ± 0.6 −10.5 ± 0.5 −9.6 ± 0.4
dH/nm (DMEM with 10% FBS) 144.6 ± 2.7 84.5 ± 0.5 165.4 ± 1.8
ζ/mV (DMEM with 10% FBS) −11.7 ± 1.4 −11.2 ± 0.8 −10.0 ± 0.6


3.2 The interference of AgNPs on the detection of lactate dehydrogenase (LDH) release

LDH as a cytoplasmic enzyme could be released into the cytoplasm upon the damage of cell membrane integrity. As a general assessment for cytotoxicity, colorimetric assay for the relative quantification of cell death and cell lyses, based on the measurement of LDH activity released from the cytosol of damaged cells into the culture supernatant. Based on Scheme 1,33 to evaluate the interference of AgNPs on cytotoxicity detection by LDH assay, four experimental groups were designed according to the manual of Roche Cytotoxicity Detection kit (Table 2). Then the different value between group B and A could be compared with that between group D and C so as to investigate the total effects of AgNPs on LDH assay.
image file: c5ra05863e-s1.tif
Scheme 1 The basis of LDH assay in our study with (a) or without (b) cells. This assay involves three steps which are (1) oxidization of lactate to pyruvate with LDH; (2) reaction of pyruvate with tetrazolium salt iodotetrazolium chloride (INT) to form formazan; and (3) detection of water-soluble formazan dye.
Table 2 Four experimental groups in LDH detection to evaluate AgNP disturbance. DMEM medium contained 10% FBS. AM was DMEM medium supplied with 1% FBS
Volume (μL) A B C D
DMEM medium 100 100 100 100
AM 100 50 50
LDH standard solution 50 50
AgNP solution 50 50
Reaction solution 100 100 100 100


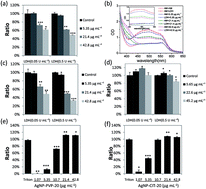
As shown in Fig. 2a, the addition of AgNP-PVP-20 decreased the final absorbance of products in a dose-dependent manner, which was approximately 62% of the control group at a concentration of 0.05 U mL−1 LDH and 49% of the control group at 0.5 U mL−1 LDH, respectively, for 42.8 μg mL−1AgNP-PVP-20. Therefore, we supposed that the interference of AgNPs would be stronger at the higher concentration of LDH in the supernatant. Moreover, based on the absorption spectrum analysis of AgNP-PVP-20 by full wavelength scanning in the LDH assay in Fig. 2b, there was no special absorption peak from 450 nm to 550 nm besides the product peak at 490 nm, suggesting that the background absorption from AgNP-PVP-20 did not attribute to the AgNP influence on LDH detection.


image file: c5ra05863e-f2.tif
Fig. 2 The interference of AgNPs on the cytotoxicity detection by LDH assay. (a) The interference of AgNP-PVP-20 on the LDH activity detection. (b) Absorption spectrum analysis of AgNP-PVP-20 by full wavelength scanning from 350 nm to 650 nm in LDH assay with 0.5 U mL−1 LDH. The inset was zoomed in from 450 nm to 550 nm. (c & d) The interference of AgNP-CIT-20 and AgNP-CIT-110 on the LDH activity detection, respectively. (e & f) LDH leakage in Hep G2 cells after 24 h exposure to AgNP-PVP-20 and AgNP-CIT-20. Ratio means the LDH activity relative to the untreated control group. *p < 0.05, **p < 0.01, ***p < 0.001, significantly different from the control group.

AgNP-CIT-20 had the similar but more significant influence pattern to that of AgNP-PVP-20 (Fig. 2c). At a concentration of 0.5 U mL−1 of LDH, AgNP-CIT-20 inhibited the product absorbance with about 70% of control group. Furthermore, citrate-coated AgNPs with a bigger size (AgNP-CIT-110) was also investigated. However, AgNP-CIT-110 exhibited no significant inhibition on product absorbance as shown in Fig. 2d. There was only 10% inhibition compared with the control group for 45.2 μg mL−1 AgNP-CIT-110 with 0.5 U mL−1 LDH.

Overall, LDH assay was significantly disturbed by AgNP existence in a cell-free environment, which was possibly resulted from many factors, including LDH inactivation directly by AgNPs, chemical reactions between AgNPs and any assay compounds (NAD+, NADH, pyruvate, INT or formazan) displayed in Scheme 1. Different sizes or surface coatings of AgNPs displayed different effects on LDH assay. Smaller sizes of particles would generate much more interference than bigger sizes. Besides some extracellular factors, cells may also contribute to LDH inhibition. It has been recently reported that the generation of ROS may be another reason for the false results in a LDH assay for AgNPs.4 Therefore, the data of AgNPs from LDH assay in the literatures need to be interpreted with cautions.

We tested the cytotoxicity of AgNPs in human hepatoma carcinoma cell line Hep G2 by LDH assay. As shown in Fig. 2e and f, the relative LDH activity (LDH%) with the treatment of ∼20 μg mL−1 20 nm AgNPs is close to 100%, which already reached the maximum release since the higher concentration (∼40 μg mL−1) of AgNPs did not affect the results of this assay. It implied that ∼20 μg mL−1 of 20 nm AgNPs might be enough to destroy the membrane of all Hep G2 cells in wells. Moreover, by the comparison of the data from lower concentrations of AgNPs, AgNP-CIT-20 was more toxic to Hep G2 cells. Considering the interference of AgNPs, the actual LDH% of Hep G2 cells might be not the same as our data shown in Fig. 2e and f.

In addition, the supernatant was detected in LDH assay. Thus, some labs removed NPs by centrifugation before adding the reagent solution in LDH assay so as to reduce the NP interference.4,12 Then, we also inserted a centrifugation step in the abiotic LDH assay to see whether it would reduce the AgNP interference or not. However, we found that the centrifugation step caused much more interference for AgNP-PVP-20 (Fig. S1a) compared to the result without centrifugation (Fig. 2a). We supposed that it would be mostly due to the absorption of LDH onto AgNP surface.4 The removal of AgNPs resulted in the reduced amount of LDH. Moreover, we also detected AgNP disturbance in abiotic LDH assay for longer incubation time. After 24 h incubation, removing AgNPs by centrifugation also generated more interference comparing with non-centrifugation (Fig. S1b and c), which was just not so obvious as the case of 0 h. The possible reason may be that there are two main effects from AgNPs in LDH assay, the absorption of LDH onto the AgNP surface and the inactivation of LDH. The absorption process may be faster than the inactivation. Therefore, the removal of AgNPs from supernatant may not be a good way to reduce interference for LDH assay.

3.3 The interference of AgNPs on cell viability assay (MTS assay)

Cell viability assay is usually performed by MTT, MTS or WST-1 assays, which have similar principles for detection. In our study, we focused on MTS assay since it is easier to be carried out as shown in Scheme 2. To determine whether AgNPs would disturb MTS assay, eight experimental groups were set up according to the manual of Promega CellTiter 96® AQueous One Solution Reagent as shown in Table 3. Then the different value between group (d) and (a) could be compared with that between group (h) and (e) so as to investigate the total effects of AgNPs on MTS assay. And the different value between group (c) and (a) might be compared with that between group (g) and (e) to see whether the mixture of AgNPs with MTS can generate formazan.
image file: c5ra05863e-s2.tif
Scheme 2 The mechanism of MTS assay by CellTiter 96® AQueous One Solution Reagent (Promega, USA) in actual cellular assay (a) or in the interference-detecting experiment (b). This reagent kit involved a novel tetrazolium compound MTS and an electron coupling reagent (phenazine ethosulfate; PES). The MTS tetrazolium compound was bio-reduced by cells into a colored formazan product that was soluble in tissue culture medium. The quantity of formazan product as measured by the absorbance at 490 nm was directly proportional to the number of living cells in culture.
Table 3 Eight experimental groups in MTS assay to evaluate AgNP disturbance. DMEM medium contained 10% FBS
Volume (μL) a b c d e f g h
DMEM medium (I) 80 80 80 80
Cell suspension 80 80 80 80
DMEM medium (II) 40 40 20 20 20 20
AgNP solution 20 20 20 20
MTS solution 20 20 20 20


As shown in Fig. 3a, due to AgNP-PVP-20 existence, the final absorbance of products decreased 42.8 μg mL−1 of AgNP-PVP-20 made an approximately 10% absorbance decrease as compared with the control group. However, less AgNP-PVP-20 (5.35 μg mL−1) inhibited a little bit more for the product absorbance. Moreover, based on the absorption spectrum analysis of AgNP-PVP-20 by full wavelength scanning in MTS assay in Fig. 3b, there was no special absorption peak from 450 nm to 550 nm besides the product peak at 490 nm, suggesting that the background absorption from AgNP-PVP-20 did not attribute to the AgNP influence on MTS assay. The maximum absorbance of AgNPs at 400 nm in the cell group decreased compared with that of medium control group. This might be from the aggregation of AgNPs or the loss of AgNPs due to taking part in the reaction. In addition, less than 40 μg mL−1 of AgNP-CIT-20 inhibited the product absorbance up to 20% (Fig. 3c). Furthermore, citrate-coated AgNPs with a bigger size (AgNP-CIT-110) showed little inhibition than the smaller sized particles (AgNP-CIT-20) on product absorbance as shown in Fig. 3d.


image file: c5ra05863e-f3.tif
Fig. 3 The interference of AgNPs on cell viability assay by MTS detection. (a) The interference of AgNP-PVP-20 on MTS detection. (b) Absorption spectrum analysis of AgNP-PVP-20 by full wavelength scanning from 350 nm to 650 nm in MTS detection assay. The inset was zoomed from 450 nm to 550 nm. (c & d) The interference of AgNP-CIT-20 and AgNP-CIT-110 on MTS detection, respectively. (e & f) Cell proliferation determined by MTS assay in Hep G2 cells after 24 h exposure to AgNP-PVP-20 and AgNP-CIT-20. Ratio means the product absorbance of AgNP group relative to the untreated control group. *p < 0.05, **p < 0.01, significantly decreased compared with the control group.

Moreover, we found that these three kinds of AgNPs could react with MTS to generate formazan in a dose-dependent manner as shown in Fig. S2. We supposed that there were two kinds of effects exerted by AgNPs in MTS assay. One was the positive effect by the direct reaction of AgNP with MTS, which may be similar to single-walled carbon nanotubes.9,10 The other was the negative effect by hindering the bio-reduction process of MTS. The negative effect may be due to enzyme inactivation directly by AgNPs. Or other substances generated by the interaction between AgNPs and cells block the bio-reduction process of MTS. For 20 nm AgNPs, the negative effects were more than positive effects. For 110 nm AgNP-CIT, both negative and positive were almost equal. Thus, these three kinds of AgNPs displayed different interference patterns in MTS assay. AgNPs, further detailed studies will be required.

We tested the cell viability in human hepatoma carcinoma cell line Hep G2 treated by AgNPs through MTS assay. As shown in Fig. 3e and f, cell viability of Hep G2 cells was heavily inhibited up to ∼70% after 24 h treatment of 20 nm AgNP-PVP-20 (<40 μg mL−1). 42.8 μg mL−1 of AgNP-CIT-20 impaired Hep G2 cell viability about 90%. These results were comparable to those in LDH assay with cell exposure. If considering the interference of AgNPs, the actual percentage of cell viability for Hep G2 cells might be different, which was likely to show higher proliferation ration.

3.4 The interference of AgNPs on the detection of nitric oxide production (NO assay)

As an antibacterial effector, NO plays an important role in immune responses, which main source is macrophages in mammalian system.34 Hence, NO assay is often utilized to investigate the effects of nanomaterials on macrophage functions. Based on Scheme 3, eight experimental groups were set up to explore the influence of AgNPs on NO assay (Table 4). The total effects of AgNPs on NO assay in cell-free conditions could be ranked by comparing the different value between group (8) and (5) with that between group (4) and (1).
image file: c5ra05863e-s3.tif
Scheme 3 The basis of NO assay in our study with (a) or without (b) cells. The antibacterial effectors' molecule nitric oxide (NO) released from cells would be quickly transformed to the oxidative end-products nitrite (NO2) and nitrate (NO3) in the cell culture medium with the help with oxygen and water. Then NO2 reacted with Griess reagent which was 1[thin space (1/6-em)]:[thin space (1/6-em)]1 mixture of 1% sulfanilamide and 0.1% NED in 2.5% H3PO4 to generate a colored product.
Table 4 Eight experimental groups in NO assay to evaluate AgNP disturbance
Volume (μL) 1 2 3 4 5 6 7 8
RPMI-1640 100 100 50 50 50 50
NaNO2 standard solution 50 50 50 50
AgNP solution 50 50 50 50
2.5% H3PO4 100 100 100 100
Griess reagent 100 100 100 100


Then, we examined different concentrations of NaNO2 standard solution. As shown in Fig. 4a–c, only ∼40 μg mL−1 of AgNPs at the highest concentration of NaNO2 (250 μM) reduced about 10% of product absorbance as compared with the control group. There is not much difference among three kinds of AgNPs. However, at the lower concentration of NaNO2 (31.3 μM or 1.95 μM), AgNPs did not markedly impact NO detection. In Fig. 4d–f, the results demonstrated that there was no special absorption peak from 500 nm to 660 nm besides the product peak at 550 nm according to the absorption spectrum analysis by full wavelength scanning for AgNP-PVP-20 with different concentrations of NaNO2 in cell-free NO assay. The background absorption from AgNP-PVP-20 did not disturb the product absorption.


image file: c5ra05863e-f4.tif
Fig. 4 The interference of AgNPs on the detection of NO production. (a) The interference of AgNP-PVP-20 on NO detection assay. (b & c) The interference of AgNP-CIT-20 and AgNP-CIT-110 on NO detection assay, respectively. *p < 0.05, **p < 0.01, ***p < 0.001, significantly different from the control group. (d–f) Absorption spectrum analysis by full wavelength scanning from 350 nm to 650 nm for AgNP-PVP-20 with 250 μM NaNO2 (d), 31.3 μM NaNO2 (e) or 1.95 μM NaNO2 (f) as well as Griess reagent, respectively. The inset was zoomed from 510 nm to 560 nm.

Then, we examined the interactions between AgNPs and reactants in NO assay. According to Table 4, the different value between group (6) and (5) can be compared with that between group (2) and (1) so as to assess whether AgNPs would react with Griess reagent. Fig. 5a showed that the interaction between AgNPs and Griess reagent may slightly impair the absorption at ∼550 nm. Similarly, the interaction between AgNPs and NaNO2 could be judged by comparing the different value between group (7) and (5) can be compared with that between group (3) and (1). As shown in Fig. 5b–d, there was no contributions of AgNPs only with NaNO2 to the total interference of AgNPs in cell-free NO assay. Moreover, it was worthwhile to pay attention to the absorption peak of AgNP-PVP-20 at around 400 nm. The high concentration of NaNO2 at the presence of Griess reaction solution made the AgNP peak disappeared as compared with the group only consisting of AgNPs and medium in Fig. 4d. Therefore, we supposed that the AgNP interference might be mainly resulted from the interactions between AgNPs and the product (4-(3-(2-(naphthalen-1-ylamino)ethyl)triaz-1-en-1-yl)benzenesulfonamide dihydrochloride) in NO assay.


image file: c5ra05863e-f5.tif
Fig. 5 (a) Absorption spectrum analysis for AgNP-PVP-20 only with Griess reagent. (b–d) Absorption spectrum analysis for AgNP-PVP-20 only with 250 μM NaNO2 (b), 31.3 μM NaNO2 (c) or 1.95 μM NaNO2 (d), respectively.

To sum up, NO detection assay was slightly influenced by AgNP existence in a cell-free system, which depended on the concentration of NO as well as AgNPs. We tested the production of NO in mouse macrophage cell line RAW264.7 with AgNP treatment. As the positive control, LPS significantly stimulated NO production in RAW264.7 cells. As shown in Fig. S3, the amount of NO was not markedly augmented after AgNP-PVP-20 exposure as compared with the untreated control group. Although less than 42.8 μg mL−1 AgNP-PVP-20 would not exert an influence on cell-free NO detection assay when the concentration of NO was around 30 μM (Fig. 4a), the cellular influence due to AgNP existence should be also considered.

4. Conclusions

In summary, we have systematically assessed and quantified the interference of AgNPs on LDH detection, MTS assay and NO detection. First, UV-Vis spectrum analysis during the assay evaluation excluded the interference of AgNP absorption. And then, the special property of AgNPs indeed interfered with these assays significantly, especially for LDH detection. At the concentration of 42.8 μg mL−1 20 nm PVP-coated AgNPs affected the detection of LDH release about 50%, while for 42.8 μg mL−1 citrate-coated 20 nm AgNPs, it inhibited ∼70% compared with the control group. The results suggested that before the bio-effect evaluation of AgNPs or other nanoparticles is performed, we should verify whether the particles have some influence on the testing methods or not to guarantee the data validity. If the interference indeed exists, other assays or combining several assays could be considered in the safety evaluation of nanomaterials. And other approaches that are free from nanomaterials interference may be sorely required in the future.

Acknowledgements

This study is financially supported by “Strategic Priority Research Program” of Chinese Academy of Sciences (XDA09040300) and Beijing Natural Science Foundation (No. 2132056).

Notes and references

  1. The European Commission: Commission Recommendation of 18 October 2011 on the definition of nanomaterial (2011/696/EU). Brussels, Official Journal of the European Union 2011, L275/38.
  2. T. Xia, M. Kovochich, M. Liong, J. I. Zink and A. E. Nel, ACS Nano, 2008, 2, 85–96 CrossRef CAS PubMed.
  3. L. Rodriguez-Lorenzo, K. Fytianos, F. Blank, C. von Garnier, B. Rothen-Rutishauser and A. Petri-Fink, Small, 2014, 10, 1341–1350 CrossRef CAS PubMed.
  4. S. J. Oh, H. Kim, Y. Liu, H. K. Han, K. Kwon, K. H. Chang, K. Park, Y. Kim, K. Shim, S. S. An and M. Y. Lee, Toxicol. Lett., 2014, 225, 422–432 CrossRef CAS PubMed.
  5. A. L. Holder, R. Goth-Goldstein, D. Lucas and C. P. Koshland, Chem. Res. Toxicol., 2012, 25, 1885–1892 CrossRef CAS PubMed.
  6. A. Kroll, M. H. Pillukat, D. Hahn and J. Schnekenburger, Arch. Toxicol., 2012, 86, 1123–1136 CrossRef CAS PubMed.
  7. A. Dhawan and V. Sharma, Anal. Bioanal. Chem., 2010, 398, 589–605 CrossRef CAS PubMed.
  8. N. S. Wigginton, A. d. Titta, F. Piccapietra, J. Dobias, V. J. Nesatyy, M. J. F. Suter and R. Bernier-Latmani, Environ. Sci. Technol., 2010, 44, 2163–2168 CrossRef CAS PubMed.
  9. L. L. Belyanskaya, T. M. Marti, S. Hopkins-Donaldson, S. Kurtz, E. Felley-Bosco and R. A. Stahel, Mol. Cancer, 2007, 6, 66 CrossRef PubMed.
  10. N. A. Monteiro-Riviere, A. O. Inman and L. W. Zhang, Toxicol. Appl. Pharmacol., 2009, 234, 222–235 CrossRef CAS PubMed.
  11. J. M. Worle-Knirsch, K. Pulskamp and H. F. Krug, Nano Lett., 2006, 6, 1261–1268 CrossRef CAS PubMed.
  12. X. Han, R. Gelein, N. Corson, P. Wade-Mercer, J. Jiang, P. Biswas, J. N. Finkelstein, A. Elder and G. Oberdorster, Toxicology, 2011, 287, 99–104 CrossRef CAS PubMed.
  13. Z. Wu, B. Zhang and B. Yan, Int. J. Mol. Sci., 2009, 10, 4198–4209 CrossRef CAS PubMed.
  14. X. Huang, I. H. El-Sayed, X. Yi and M. A. El-Sayed, J. Photochem. Photobiol., B, 2005, 81, 76–83 CrossRef CAS PubMed.
  15. K. Hikosaka, J. Kim, M. Kajita, A. Kanayama and Y. Miyamoto, Colloids Surf., B, 2008, 66, 195–200 CrossRef CAS PubMed.
  16. United Kingdom Department for Environment, Characterising the potential risks posed by engineered nanoparticles, Food and Rural Affairs, London, 2006 Search PubMed.
  17. A. Kroll, C. Dierker, C. Rommel, D. Hahn, W. Wohlleben, C. Schulze-Isfort, C. Gobbert, M. Voetz, F. Hardinghaus and J. Schnekenburger, Part. Fibre Toxicol., 2011, 8, 9–29 CrossRef CAS PubMed.
  18. V. Edwards-Jones, Lett. Appl. Microbiol., 2009, 49, 147–152 CrossRef CAS PubMed.
  19. J. R. Morones, J. L. Elechiguerra, A. Camacho, K. Holt, J. B. Kouri, J. T. Ramirez and M. J. Yacaman, Nanotechnology, 2005, 16, 2346–2353 CrossRef CAS PubMed.
  20. C. Beer, R. Foldbjerg, Y. Hayashi, D. S. Sutherland and H. Autrup, Toxicol. Lett., 2012, 208, 286–292 CrossRef CAS PubMed.
  21. M. Rai, A. Yadav and A. Gade, Biotechnol. Adv., 2009, 27, 76–83 CrossRef CAS PubMed.
  22. E. H. S. Hagen Mikkelsen, T. B. Christensen, A. Baun, S. Foss Hansen and M.-L. Binderup, Survey on basic knowledge about exposure and potential environmental and health risks for selected nanomaterials, Danish Ministry of the Environment, 2011, pp. 1–136 Search PubMed.
  23. A. Panacek, M. Kolar, R. Vecerova, R. Prucek, J. Soukupova, V. Krystof, P. Hamal, R. Zboril and L. Kvitek, Biomaterials, 2009, 30, 6333–6340 CrossRef CAS PubMed.
  24. J. L. Elechiguerra, J. L. Burt, J. R. Morones, A. Camacho-Bragado, X. Gao, H. H. Lara and M. J. Yacaman, J. Nanobiotechnol., 2005, 3, 6 CrossRef PubMed.
  25. K. Kalishwaralal, S. BarathManiKanth, S. R. Pandian, V. Deepak and S. Gurunathan, Colloids Surf., B, 2010, 79, 340–344 CrossRef CAS PubMed.
  26. K. K. Wong, S. O. Cheung, L. Huang, J. Niu, C. Tao, C. M. Ho, C. M. Che and P. K. Tam, ChemMedChem, 2009, 4, 1129–1135 CrossRef CAS PubMed.
  27. J. Tian, K. K. Wong, C. M. Ho, C. N. Lok, W. Y. Yu, C. M. Che, J. F. Chiu and P. K. Tam, ChemMedChem, 2007, 2, 129–136 CrossRef CAS PubMed.
  28. S. Shrivastava, T. Bera, S. K. Singh, G. Singh, P. Ramachandrarao and D. Dash, ACS Nano, 2009, 3, 1357–1364 CrossRef CAS PubMed.
  29. V. M. Ragaseema, S. Unnikrishnan, V. Kalliyana Krishnan and L. K. Krishnan, Biomaterials, 2012, 33, 3083–3092 CrossRef CAS PubMed.
  30. S. Kim and D. Y. Ryu, J. Appl. Toxicol., 2013, 33, 78–89 CrossRef PubMed.
  31. X. Wang, Z. Ji, C. H. Chang, H. Zhang, M. Wang, Y. P. Liao, S. Lin, H. Meng, R. Li, B. Sun, L. V. Winkle, K. E. Pinkerton, J. I. Zink, T. Xia and A. E. Nel, Small, 2014, 10, 385–398 CrossRef CAS PubMed.
  32. Y. H. Lee, F. Y. Cheng, H. W. Chiu, J. C. Tsai, C. Y. Fang, C. W. Chen and Y. J. Wang, Biomaterials, 2014, 35, 4706–4715 CrossRef CAS PubMed.
  33. S. T. Stern and T. M. Potter, NCL Method GTA-1, version 1.1, 2010, 1–11.
  34. J. Chan, Y. Xing, R. S. Magliozzo and B. R. Bloom, J. Exp. Med., 1992, 175, 1111–1122 CrossRef CAS.

Footnotes

Electronic supplementary information (ESI) available: The details of MREI-model calculations. See DOI: 10.1039/c5ra05863e
Current address: Environmental Science, Marshall University, John Marshall Dr, Huntington, West Virginia, 25755, USA.

This journal is © The Royal Society of Chemistry 2015
Click here to see how this site uses Cookies. View our privacy policy here.