Quaternary structures of GroEL and naïve-Hsp60 chaperonins in solution: a combined SAXS-MD study

A. Spinelloab, M. G. Ortore*c, F. Spinozzic, C. Riccic, G. Barone*ab, A. Marino Gammazzaab and A. Palumbo Piccionello*ab
aDipartimento di Scienze e Tecnologie Biologiche, Chimiche e Farmaceutiche-STEBICEF, Universitá degli Studi di Palermo, Viale delle Scienze, Edificio 17, 90128 Palermo, Italy. E-mail: antonio.palumbopiccionello@unipa.it; giampaolo.barone@unipa.it
bIstituto EuroMediterraneo di Scienza e Tecnologia-IEMEST, Via Emerico Amari 123, 90139 Palermo, Italy
cDipartimento DiSVA, Università Politecnica delle Marche, Via Brecce Bianche, 60131 Ancona, Italy. E-mail: m.g.ortore@univpm.it

Received 23rd March 2015 , Accepted 27th May 2015

First published on 27th May 2015


Abstract

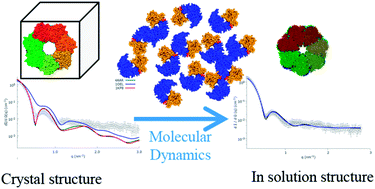
The quaternary structures of bacterial GroEL and human naïve-Hsp60 chaperonins in physiological conditions have been investigated by an innovative approach based on a combination of synchrotron Small Angle X-ray Scattering (SAXS) in-solution experiments and molecular dynamics (MD) simulations. Low-resolution SAXS experiments over large and highly symmetric oligomers are analyzed on the basis of the high-resolution structure of the asymmetric protein monomers, provided by MD. The results reveal remarkable differences between the solution and the crystallographic structure of GroEL and between the solution structures of GroEL and of its human homologue Hsp60.

Introduction

The determination of protein quaternary structures is one of the fundamental challenges of structural biology. For example, drug design, which is aimed at finding small molecules complementary in structure and charge to a specific protein or biomolecular target, clearly requires knowledge of the target architecture. Although X-ray crystallography provides the atomic coordinates of a protein, hence its high resolution structure, the actual protein conformation in solution can be slightly or noticeably different from the one in the crystal phase.1 Small Angle X-ray Scattering (SAXS) of proteins in solution can be able to evidence these differences, albeit this technique cannot provide high resolution protein structure details.2 Moreover, the SAXS technique can be successfully applied also to giant proteins, which are often difficult to crystallize. On the other side, Molecular Dynamics (MD) can provide an atomic view of small or medium-sized proteins in thermodynamic equilibrium and in the presence of explicit solvent and ions, hence under conditions most closely resembling those in solution, and therefore in vivo. Hence, the high resolution structure of giant proteins subunits obtained by means of MD can be used to analyze SAXS experimental curves over the entire protein complex, or oligomer.3

On these grounds, we have decided to investigate the quaternary structure of two chaperones of the Heat Shock Proteins (Hsp) family, namely the bacterial 60 kDa GroEL and its human homologue Hsp60 in its naïve form. Hsps play crucial roles in biosynthesis, folding/unfolding, transport and assembly of other proteins.4 GroEL, one of the most deeply and widely studied Hsp protein, assists client protein's folding by forming a tetradecameric structure with a barrel shape obtained by two heptameric rings.5 The folding process is also assisted by the 10 kDa co-chaperonin GroES and by ATP to ADP hydrolysis.5 For many years the active form of this supramolecular folding machine was assumed as an asymmetric bullet-shaped GroEL14:GroES7 complex, while very recently a symmetric football-shaped GroEL14:(GroES7)2 complex was evidenced to be the real folding chamber.6 In this new model, the binding of the substrate protein (SP) precedes the one of ATP. Therefore, the barrel-shaped tetradecamer in its T-state (ATP-unbound) is the basis for the recognition of SPs.6 To the best of our knowledge, the tetradecameric structure of GroEL's T-state in solution, under physiological conditions, has not yet been reported. On the other hand, the human homologue Hsp60 similarly works with its co-chaperone Hsp10 in a ATP-mediated process, even if Hsp60 shows less affinity for Hsp10 than the bacterial homologue, forming preferentially heptameric rings instead of the barrel-shaped double-ring.7 The crystal structure of human Hsp60, in complex with Hsp10, was only recently obtained, showing a symmetric football-shaped assembly also for the mammalian form.8 Hsp60 has recently received a new biological and medical interest, being considered a promising target for the treatment or the diagnosis of many diseases like cancer, inflammation and autoimmune diseases.9 Notably, these pathological conditions seem to be related to a cytosolic accumulation of Hsp60, also in its naïve form.10 Naïve-Hsp60 is characterized by the presence of a 26 peptides Mitochondrial Import Sequence (MIS) linked at the N-terminus, which is cleaved during translocation of the nascent peptide to the organelles. The oligomeric states of naïve-Hsp60 were recently fully investigated, revealing the presence of an equilibrium between stable heptameric and tetradecameric forms, in a wide range of concentrations as evidenced by different techniques such as Size-exclusion Chromatography (SEC), Dynamic and Static Light Scattering (DLS and SLS, respectively), Fluorescence Correlation Spectroscopy (FCS), Gel electrophoresis and preliminary SAXS experiments.11 In particular, Blue Native Polyacrylamide Gel Electrophoresis of Hsp60 and of GroEL performed at several protein concentrations (see Fig. 4 and 5 of ref. 11) unambiguously show that while GroEL maintains its tetradecameric structure, naïve-Hsp60 is resolved into two bands that, based on the measured molecular masses, are attributed to the heptamers and tetradecamers. Despite naïve-Hsp60 is emerging as perspective drug's target and a diagnostic tool, its detailed quaternary structure in solution, under physiological conditions, has not been still deeply investigated. In this study MD simulations and SAXS experimental data, analyzed by the QUAFIT method,12 interplay in order to obtain the quaternary structure of the protein in solution. In particular, MD simulations have provided structural and dynamic details of single GroEL and Hsp60 subunits – derived from crystallographic data or conveniently adapted from crystallography – at the equilibrium, while QUAFIT has been able to derive the structure of the protein assembly, determined by the best arrangement of both the rigid domains that constitute the subunit and the subunits that form the oligomer, according to a proper point group symmetry. The combination of MD simulations and the advanced SAXS data analysis provided the quaternary structure of both GroEL and Hsp60 in solution.

Results and discussion

Fitting of SAXS data with PDB structures

SAXS measurements of GroEL and naïve-Hsp60 in solution have been performed at the ID2 beamline of the European Synchrotron Radiation Facility (ESRF), as extensively described in Experimental section.

Both protein samples have been measured at the same concentration in solution and present SAXS profiles comparable with those previously obtained. In details, albeit curves at low q values appear quite similar, their features at intermediate q are rather different.11 Because several crystallographic structures of GroEL are deposited in the Protein Data Bank, we have tentatively fitted our experimental data with the form factor calculated from those structures, by applying the SASMOL approach13 included in the GENFIT software package,14 as reported in Fig. 1, upper panel. Such figure shows that all crystallographic structures fail to satisfactorily represent GroEL in solution. In detail, the well-evident first minimum observed at q ≈ 0.5 nm−1 could not be fitted at all. However, GroEL SAXS experimental curve looks similar to the one obtained by Arai et al.,15 suggesting that significant differences between solution and crystallographic GroEL structures exist and confirming the accuracy of our experimental results. Since both tetradecameric and heptameric GroEL PDB structures are reported, we have attempted to fit the experimental curve by combining the presence of both oligomers in solution. However, no combination of these quaternary structures has been able to satisfactorily fit the SAXS data (Fig. 1, bottom panel, see also Fig. S5 and S6).


image file: c5ra05144d-f1.tif
Fig. 1 SAXS experimental profiles of GroEL (open circles, c = 3 g L−1) with tentative fitting curves obtained from the crystallographic structures indicated in the legend (top), and from a combination (bottom) of tetradecamers and heptamers from the 4AAR PDB structure computed by the GENFIT software.14

In particular, while the position of the first minimum in the q-range is well fitted, its shape and intensity are not adequately reproduced. These preliminary fitting approaches, which claim that GroEL would not present in solution an equilibrium between heptamers and tetradecamers but a unique tetradecameric state,11 have prompted us to follow a different approach based on the results of the MD simulations. In particular, we have performed all-atom MD simulations on GroEL tetradecameric barrel-shaped structure (PDB ID: 4AAR), constituted by 109[thin space (1/6-em)]446 atoms and in the presence of 107[thin space (1/6-em)]852 water molecules in the simulation box, for 40 ns, in order to asses if structural changes, able to reproduce fitting of SAXS data, could be observed.

The relative root mean square deviations (RMSD) are shown in Fig. 2 for ring T (red line), for ring R (blue line), and for all atoms (black line), respectively. As expected, the biggest deviations are due to conformational changes of ring R (blue ring). In fact, seven ATP molecules are bound in this ring in the original PDB structure and, as a consequence of the deletion of these ligands, the ring is subject to the conformational change R → T. The other ring in the T state (red ring) is much more stable and the RMSD slightly increases at the end of MD process, following the relaxation of the structure in a physiological environment. Evidently, a much longer simulation time is necessary to achieve the equilibrium state of the whole protein in explicit water solution.


image file: c5ra05144d-f2.tif
Fig. 2 (a) RMSD plot of the non-hydrogen atoms, of ring T (red), ring R (blue) and the whole protein (black), respectively. (b) GroEL 4AAR tetradecameric structure. (c) SAXS theoretical curves obtained from snapshots along the MD simulation, as indicated in the legend.

Theoretical SAXS curves corresponding to several snapshots along the MD evolution of the crystallographic structure have been calculated by means of the SASMOL approach.13 However, for q < 2.0 nm−1 neither the SAXS curve of the structure at 12 ns, nor the one of the structure at 40 ns show remarkable differences from the SAXS curve of the crystallographic 4AAR structure. Of note, the largest differences between the theoretical SAXS curves at 0, 12 and 40 ns occur at the high q-range, where it is known that the experimental curves are affected by noticeable error bars. These remarks led us to conclude that the MD simulation of the whole tetradecameric protein structure, being extremely time consuming, is not a suitable procedure to reach an acceptable fitting of SAXS data within reasonable time.

Structural analysis of GroEL

To provide the structure of the chaperonin GroEL in aqueous solution under physiological conditions, we have exploited the known flexibility of the monomer of GroEL in the frame of its quaternary structure16 and as isolated subunit.17 The basic idea was to extract the monomer from the 4AAR PDB entry, investigate its flexibility by means of MD simulations, and reconstruct the structure of tetradecamer by simultaneously finding the best conformation of the MD modified flexible monomer and the best positioning of fourteen of such monomers, assembled according to the D7 point group symmetry, in order to get the best fit of the experimental SAXS curve (for a schematic representation of method's workflow see Fig. S1). To perform this task we have exploited the QUAFIT software package.12 It is worth to notice that the D7 symmetry is a combination of a C7 rotation axis with seven perpendicular C2 axes. According to previous findings,16 two flexible linkers in the border region between the apical and the intermediate domains can be chosen. In particular, the two linkers are composed by residues 188–191 and 373–376, respectively. In order to corroborate this initial hypothesis, we have performed 300 ns MD simulation on the GroEL monomer extracted from the ring T of 4AAR PDB entry. The RMSD relative to the starting configuration is shown in Fig. 3, showing that the isolated subunit explores a wide conformational space, also in the absence of bound ATP molecule. Monomer's flexibility modes, evidenced by means of the principal component analysis (PCA),18 reveal the presence of three principal eigenvectors, out of fifty, relative to the main conformational fluctuations (see Fig. S2). Representatively, the relative movements of these eigenvectors are schematically depicted in Fig. 3 (see the corresponding ESI Movies pca1.mpg, pca2.mpg and pca3.mpg for a dynamic visualization).
image file: c5ra05144d-f3.tif
Fig. 3 RMSD plot of the Cα atoms of the GroEL subunit (top). Schematic representation of the relative domains motion along the first three eigenvectors (bottom). GroEL domains are highlighted by different colors, i.e. equatorial (blue), intermediate (green) and apical (red) domains, respectively.

Interestingly, in the isolated monomer the apical domain (shown in red in Fig. 3) can move with respect to the equatorial (blue) and intermediate (green) domains, which result to be tightly bound, as already evidenced within the tetradecameric structure,16 thus confirming the choice of the flexible linkers as the hinge of these relative movements. Furthermore, a residue root mean square fluctuations (RMSF) analysis confirms that selected sequences corresponded to fluctuation minima at the interface of the rigid domains (see Fig. S3).

Using the QUAFIT method, according to the strategy described in the Experimental section, two different structures of the tetradecamer (A and B), both able to best fit the experimental SAXS curve, have been obtained.

Corresponding reduced χ2 measuring the quality of data fitting for A and B solutions are 1.38 and 1.13, respectively. Best fitting curves and different views of the A and B structures are reported in Fig. 4.


image file: c5ra05144d-f4.tif
Fig. 4 SAXS experimental profiles of 3 g L−1 GroEL (open circles), compared with the curves obtained by QUAFIT for structure A (black) and B (blue). Top and side view, respectively, of tetradecamers and monomers of A, B and 4AAR. GroEL domains are shown in red (apical), green (intermediate), blue (equatorial).

By comparing tetradecamer's size, we could observe that, although the oligomers are quite similar concerning external dimension (gyration's radius and barrel axes), major differences are related to the size of the internal cavity which is considerably smaller for structures A and B than for 4AAR (see below).

This feature could be explained by comparing the monomers from each oligomeric structure. In fact, in solution the apical domain seems to adopt a tilted conformation, with respect to that of the monomer extracted from 4AAR, orienting this domain toward the center of the barrel. Notably, these conformational changes are representative of the bending mode relative to the first eigenvector evidenced by the PCA reported in Fig. 3. Structural changes due to chain flexibility, imposed during the fitting process, did not dramatically distort the protein backbone, as evidenced by the Ramachandran's plot (Fig. 5). Representatively, non-covalent interactions in structure A were analyzed. Interestingly, the proposed solution structure presents several new hydrogen bonds and salt bridges (see Fig. 6) between adjacent subunits of the same ring (intra-ring salt bridges), involving residues Asn229–Glu238 in the apical region, and Lys80–Asp41 in the equatorial domain.


image file: c5ra05144d-f5.tif
Fig. 5 Ramachandran's plot for the crystallographic (4AAR, left) and the solution structures A, B (right) of GroEL.

image file: c5ra05144d-f6.tif
Fig. 6 Inter-ring (left) and intra-ring (right) salt bridges between the GroEL subunits in solution; involved residues are represented as balls-and-sticks.

Notably, two repeated inter-ring hydrogen bonds were also detected between Asn437–Glu434, in the equatorial domain. Although is reported that the two rings communicate through two interfacial sites (L and R) in the crystallographic structures,16 in our structure we have found that the R site is lacking. Moreover the L site has different types of non-covalent bonds. The interfacial R site may be formed afterwards upon recognition of the substrate protein. In Fig. 7 a section of the GroEL cavity (PDB: 4AAR) is compared with that of the structure obtained by SAXS experiments in solution, as described above. Two essential differences have been highlighted: (i) the size of the two access windows and (ii) the shape of the internal chamber, where the client unfolded protein is hosted for undergoing the folding process. In fact, the structure in solution presents a smaller window of about 2 nm compared to that of the high-resolution solid state structures, such as 4AAR.


image file: c5ra05144d-f7.tif
Fig. 7 Cavities of 4AAR in the solid state (left), and of the solution structures of GroEL (center) and Hsp60 (right).

This feature induces us to suggest a role of GroEL, not only for recognition of client proteins, but also for the initial denaturation step, forcing the nascent polypeptide to pass through this tighter entrance. On the other hand, the cavity's size was estimated by counting the number of water molecules inside each heptameric ring (see e.g. Fig. S4) for 4AAR (6591), GroEL-A (4136), GroEL-B (3968), Hsp60-A (5147) and Hsp60-B (4349). These results show in solution a shrinking of available volume for the client proteins.

Structural analysis of naïve-Hsp60

Due to the unavailability of high-resolution structure of the human Hsp60 monomeric subunit, the latter was reconstructed by homology modeling (see Experimental). Moreover, the missing residues (MIS and unresolved C-terminal aa) were modeled through the ROSETTA software (see Experimental). Following the same approach used to study the structure of GroEL in solution, we have performed 200 ns of MD simulation on the reconstructed Hsp60 monomer. A representative snapshot, at about 150 ns, is shown on the right of Fig. 8, with the attached MIS highlighted in cyan. The presence of these additional C- and N-terminal sequences clearly impose an intrinsic stiffness to the monomer structure, as observed from the RMSD plot after 120 ns (Fig. 8 left).
image file: c5ra05144d-f8.tif
Fig. 8 (a) RMSD plot of the Cα atoms of the naïve-Hsp60 subunit; (b) representative snapshot with the Hsp60 domains shown in red (apical), green (intermediate), blue (equatorial), the MIS and C-terminal sequences highlighted in cyan and in grey, respectively. The four flexible linkers are also shown in black.

Similarly to the approach followed for GroEL reconstruction and considering the presence of the two added N- and C-termini, the Hsp60 monomer used within QUAFIT has been divided in three rigid domains: the apical (shown in red in Fig. 8), the combination of equatorial and intermediate fragments (blue and green) and the set of N- and C-endings folded with ROSETTA (cyan and gray).

Hence four flexible linkers have been defined. Two of them are in the region between the apical and the intermediate domains (as in the case of GroEL) and are composed by residues from 211 to 214 and from 397 to 400, respectively. The other two flexible linkers, connecting the N- and C-ending domain to the equatorial–intermediate domains, are from residues 23 to 26 and from 548 to 552. Taking advantage of recent findings above mentioned,11 and considering initial attempt to fitting SAXS data (see Fig. S5), we have considered that, unlike GroEL, naïve-Hsp60 in solution can simultaneously be present as a mixture of tetradecamers and heptamers.

Consequently, the QUAFIT software package allowed us to obtain best fitting of experimental SAXS data with tetradecameric and heptameric structures using the flexible monomer model as their building block (Fig. 9). Nevertheless, we had performed QUAFIT analysis even in the hypothesis of a unique tetradecameric population, but the bad fitting quality (χ2 > 2.3) confirmed the simultaneous presence of two quaternary structures in solution. Two best structures (A and B) obtained with QUAFIT are reported in Fig. 9, together with their corresponding best fit curves (χ2 are 1.28 and 1.31, respectively). The equilibrium composition, expressed as the ratio between the molar concentrations of tetradecamer and heptamer, results to be 0.58 ± 0.02 and 0.70 ± 0.05 for the A and the B solution, respectively.


image file: c5ra05144d-f9.tif
Fig. 9 (a) SAXS experimental profiles of 3 g L−1 naïve-Hsp60 (open circles), compared with the curves obtained by QUAFIT for structure A (black) and B (blue). Top and side view, respectively, of tetradecamers and monomers of A, B and 4AAR. Hsp60 domains are shown in red (apical), green (intermediate), blue (equatorial), MIS and C-terminal sequence are shown in cyan.

Due to the presence of the MIS sequences, the structures of the monomer A and B, seen in Fig. 9, result more compact than the ones for GroEL, confirming the stable RMSD values shown in the last 80 ns of the MD simulation for the isolated subunit. Also, for Hsp60 the entrance of the folding chamber is notably smaller. Moreover, the MIS sequences are located inside the folding cavity, thus leading apparently to a reduced space available for the guest proteins (see Fig. 7 and 9). Nevertheless, the presence of amino acidic chains inside the cavities surprisingly allows the entrance of a larger number of water molecules compared to GroEL A and B (see above).

It has been reported that both cytosolic and mitochondrial Hsp60 show chaperone activity in vitro,10 but this issue has not been fully addressed in terms of recognition ability of naïve-Hsp60. Nevertheless, the conformational changes due to the binding of ATP, together with the capture and unfolding of the substrate protein on the apical domain, should dramatically adapt the cavity for the subsequent encapsulation of the guest protein.

Non covalent interactions in structure A have been representatively analyzed. In particular, several salt bridges were found (see Fig. 10) involving residues Glu281–Arg268 and Asp279–Lys269 (intra-ring salt bridges), in the apical region. Inter-ring salt bridges are also present in the equatorial domain between the following residues: Lys493–Asp452, repeated twice, and Glu129–Lys481.


image file: c5ra05144d-f10.tif
Fig. 10 Inter-ring (left) and intra-ring (right) salt bridges between the Hsp60 subunits; involved residues are represented as balls-and-sticks.

Moreover, these data allow to better rationalize the model to be used for computational studies in the frame of computer-aided drug-design on Hsp60 inhibitors. In fact, while for the mt-Hsp60 the monomer represents the target, our findings suggest that for targeting Hsp60 in its naïve form an oligomeric model should be used.

Methods

SAXS measurements

SAXS measurements were performed at ID2 beamline at the European Synchrotron Radiation Facility (ESRF) in Grenoble, France. The explored q-range (q = 4π[thin space (1/6-em)]sin[thin space (1/6-em)]θ/λ where 2θ is the scattering angle and λ = 9.95 × 10⁻² nm the X-ray wavelength) covers between 0.1 and 3 nm−1, being the sample to detector distance set to 1.5 m. Experiments were carried out at 20 °C and 37 °C using a sealed 2 mm diameter quartz capillary enclosed within a thermostatic compartment connected to an external circulation bath and a thermal probe for temperature control. Protein samples were prepared as previously reported.11 Both Hsp60 and GroEL solutions were measured at the weight concentrations c = 3 g L−1. SAXS images have been collected using a 2D detector (Pilatus3 1M). Every measurement was performed for 100 ms, and followed by a dead time of 3 s in order to avoid radiation damage. The same sample was measured 60 times at each temperature in order to improve the signal-to-noise ratio. Incident and transmitted intensities were recorded to the purpose of obtaining data in an absolute scale. Normalized SAXS patterns were azimuthally averaged to get the one-dimension profiles of scattered intensities. The protein macroscopic differential scattering cross section, dΣ/dΩ(q), was determined by subtracting from the protein in solution signal the one of the buffer, corrected by its volume fraction in the protein solution. Final SAXS dΣ/dΩ(q) curves, obtained in absolute scale, clearly evidenced that both GroEL and Hsp60 show no difference in the temperature range 20–37 °C.

QUAFIT approach

QUAFIT is a computer code designed for determining the optimum configuration of a macromolecular assembly of a protein in solution by the analysis of SAXS or Small Angle Neutron Scattering (SANS) experiments.12 Starting from a point group symmetry, the structure of the protein assembly is determined through a sequence of aggregative intermediate species. The calculation progresses evaluating the relative positions and orientations of the asymmetric units constituting the monomer, considered as rigid domains connected by flexible linkers of a known sequence, best fitting small-angle scattering data. The program controls and limits the overlap among rigid domains, flexible linkers and monomers and takes into account the possible presence of oligomerization intermediates in solution.

For GroEL reconstruction, according the MD results and on the basis of the PDB 4AAR structure, two units constituting the monomer have been considered as rigid domains (RDs). The first RD includes the N- and the C-terminus referred to as equatorial and intermediate domains, represented in green and blue in Fig. 3 and 4. It is defined from residue 1 to 187 and from 377 and 524. The second RD includes the amino acids from 192 to 372. It is the red apical domain seen in Fig. 3 and 4. As a consequence, the two RDs result to be connected by two flexible linkers (FLs, shown in black in Fig. 3), both arranged by 4 amino acids. The first FL, defined by the sequence DVVE, connects the residue 187 of the first RD to the 192 of the second RD. The other FL (AGGV) connects the residue 372 of the second RD to the 377 of the first RD. This monomer can form tetradecamers based on the symmetry point-group D7.

The reconstruction of the Hsp60 structure has been performed by dividing the monomer unit, constituted by 573 residues, in three RDs. The first RD includes N- and C-termini and encompasses residues from 1 to 22 and from 553 to 573. It called MIS domain and shown in cyan in Fig. 8 and 9. The second RD is from residue 27 to 210 and from 401 to 547 (blue and green domains, called equatorial and intermediate domains in Fig. 8 and 9). The third RD, from 215 to 396, is the apical red domain seen in Fig. 8 and 9.

Accordingly, four FLs are defined. The first FL, sequenced as TRAY, connects the residue 22 of the first RD to the 27 of the second one. The second FL (LEII) is from residue 210 of the second RD to the 215 of the third one. The third and the fourth FLs (LSDG and EIPKE, respectively) connect residues 396 (third RD) and 401 (second RD) and residues 547 (second RD) and 553 (first RD). These FLs are shown in black in Fig. 8. A unique optimized structure of the monomer is assembled according to the symmetry groups D7 and C7 to define the quaternary structure of the tetradecamer and the heptamer, respectively.

The set of geometrical parameters optimized by QUAFIT includes the three polar coordinates of the geometrical center of each RD, the three Euler angles defining the orientation of each RD, the three dihedral angles that define the conformation of each residue belonging to each FL (two Ramachandran angles for the backbone and one angle for the side chain group). Moreover, in the case of Hsp6, QUAFIT also optimizes the molecular fraction of monomers forming tetradecamer. The maximum rank L of the spherical harmonics expansion of the partial X-ray scattering amplitudes has been fixed to 7. Contact distances among pairs of RDs are expanded in series of Stone's rotational invariant up to a maxim rank L′ = 3. SAXS curves have been analyzed in the whole range of q.

Molecular dynamics simulations

GroEL quaternary structure (PDB ID: 4AAR) was obtained from the protein data bank and ATP molecules were deleted. The GroEL monomer used in the following simulations was taken from this structure. The tertiary structure of the Hsp60 monomer was predicted using Swiss-Model Software.19 The missing monomer residues were folded using ROSETTA modeling software20 and then added to the N- and C-endings of the model with the software maestro.21 The fragment library were obtained from Robetta server.22

All MD simulations were carried out through the GROMACS 4.6.5 software package,23 by following a recently reported procedure.24 Amber ff99SB-ILDN force field25 was used.

A triclinic box of TIP3P water molecules was added around the protein to a depth of 0.7 nm on each side. The charge of the protein was neutralized and other Na+ and Cl ions were added to set the solution ionic strength to about 0.20 M. Explicit solvent simulations were performed in the isothermal–isobaric NPT ensemble, at a temperature of 300 K, under control of a velocity rescaling thermostat.26 The particle mesh Ewald method was used to describe long-range electrostatic interactions.27 The time step for integration was 2 fs and all covalent bonds were constrained with the LINCS algorithm. There were two temperature coupling groups in these simulations, the first for the protein and the second for water and ions. Preliminary energy minimizations were run for 5000 steps with the steepest descend algorithm. During the equilibration, the protein system was harmonically restrained with a force constant of 1000 kJ mol−1 nm−2, gradually relaxed into five consecutive steps of 100 ps each, to 500, 200, 100 and 50 kJ mol−1 nm−2. RMSD were referred to the starting configurations of MD.

Principal component analysis (PCA) was obtained by diagonalizing the covariance matrix, which is built from the atomic fluctuations in a MD trajectory where overall translational and rotational motions have been removed. The monomer backbone atoms were used to construct the protein covariance matrices. Upon diagonalization of this matrix, a set of eigenvalues and eigenvectors was obtained. The eigenvectors correspond to directions in a 3N-dimensional space, and motions along a single eigenvector correspond to concerted fluctuations of atoms. The eigenvalues of the covariance matrix represent the total mean square fluctuation of the system along the corresponding eigenvectors. If eigenvectors are ordered according to their decreasing eigenvalues, the firsts describe the largest scale correlated motions. The trajectory were analysed using VMD software.28

Conclusions

Hsps are readily emerging as therapeutic and diagnostic targets and their comprehensive structural knowledge is an important field of structural biology, useful for the development of new drugs and therapies. Despite the well-known bacterial GroEL has been extensively studied, many concerns remain about its structure and function in solution and, more importantly, under physiological conditions. On the other hand, little is known about Hsp60 in its naïve form. Here we take advantage of combining SAXS and MD techniques for the resolution at atomic level of two oligomeric structure revealing some new structural features of GroEL and naïve-Hsp60 in solution. The proposed methodology, here applied to flexible subunits, but also suitable for rigid monomers, does not require large computational resources and is not excessively time consuming, particularly if compared to the all atom MD of a complete tetradecameric structure.

Acknowledgements

We gratefully acknowledge financial support from the Italian MIUR within the “FIRB – Futuro in Ricerca 2012” Program – Project RBFR12SIPT, and the CINECA award N. IsB07, year 2013, under the ISCRA initiative, for the availability of high performance computing resources and support. We thank Pierluigi San Biagio and Silvia Vilasi for samples and for stimulating discussions.

Notes and references

  1. J. Habchi, P. Tompa, S. Longhi and V. N. Uversky, Chem. Rev., 2014, 114, 6561 CrossRef CAS PubMed.
  2. E. Occhipinti, P. L. Martelli, F. Spinozzi, F. Corsi, C. Formantici, L. Molteni, H. Amenitsch, P. Mariani, P. Tortora and R. Casadio, Biophys. J., 2003, 85, 1165 CrossRef CAS; J.-B. Guilbaud and A. Saiani, Chem. Soc. Rev., 2011, 40, 1200 RSC; C. D. Putnama, M. Hammela, G. L. Hura and J. A. Tainer, Q. Rev. Biophys., 2007, 40, 191 Search PubMed.
  3. J. Pan, X. Cheng, L. Monticelli, F. A. Heberle, N. Kučerka, D. P. Tielemanh and J. Katsaras, Soft Matter, 2014, 10, 3716 RSC.
  4. A. Finka and P. Goloubinoff, Cell Stress Chaperones, 2013, 18, 591 CrossRef CAS PubMed; A. J. L. Macario and E. Conway de Macario, N. Engl. J. Med., 2005, 353, 1489 CrossRef PubMed; T. Taldone, S. O. Ochiana, P. D. Patel and G. Chiosis, Trends Pharmacol. Sci., 2014, 35, 592 CrossRef PubMed.
  5. L. Horwich, G. W. Farr and W. A. Fenton, Chem. Rev., 2006, 106, 1917 CrossRef PubMed.
  6. D. Yang, X. Ye and G. H. Lorimer, Proc. Natl. Acad. Sci. U. S. A., 2013, 110, E4298 CrossRef CAS PubMed; X. Fei, X. Ye, N. A. LaRonde and G. H. Lorimer, Proc. Natl. Acad. Sci. U. S. A., 2014, 111, 12775 CrossRef PubMed.
  7. A. Parnas, M. Nadler, S. Nisemblat, A. Horovitz, H. Mandel and A. Azem, J. Biol. Chem., 2009, 284, 28198 CrossRef CAS PubMed; K. L. Nielsen and N. J. Cowan, Mol. Cell, 1998, 2, 93 CrossRef.
  8. S. Nisemblat, A. Parnas, O. Yaniv, A. Azem and F. Frolow, Acta Crystallogr., Sect. F: Struct. Biol. Cryst. Commun., 2014, 70, 116 CrossRef CAS PubMed.
  9. A. J. L. Macario, E. Conway de Macario and F. Cappello, The Chaperonopathies. Diseases with defective molecular chaperones, Springer, Dordrecht Heidelberg, New York, 2013 CrossRef CAS PubMed; F. Cappello, A. M. Gammazza, A. P. Piccionello, C. Campanella, A. Pace, E. Conway de Macario and A. J. L. Macario, Expert Opin. Ther. Targets, 2014, 18, 185 CrossRef CAS PubMed; A. Pace, G. Barone, A. Lauria, A. Martorana, A. Palumbo Piccionello, P. Pierro, A. Terenzi, A. M. Almerico, S. Buscemi, C. Campanella, F. Angileri, F. Carini, G. Zummo, E. Conway de Macario, F. Cappello and A. J. L. Macario, Curr. Pharm. Des., 2013, 19, 2757 CrossRef.
  10. D. Chandra, G. Choy and D. G. Tang, J. Biol. Chem., 2007, 282, 31289 CrossRef CAS PubMed; H. Itoh, A. Komatsuda, H. Ohtani, H. Wakui, K. Sawada, M. Otaka, M. Ogura, A. Suzuki and F. Hamada, Eur. J. Biochem., 2002, 269, 5931 CrossRef.
  11. S. Vilasi, R. Carrotta, M. R. Mangione, C. Campanella, F. Librizzi, L. Randazzo, V. Martorana, A. Marino Gammazza, M. G. Ortore, A. Vilasi, G. Pocsfalvi, G. Burgio, D. Corona, A. Palumbo Piccionello, G. Zummo, D. Bulone, E. Conway de Macario, A. J. L. Macario, P. L. San Biagio and F. Cappello, PLoS One, 2014, 9, e97657 Search PubMed.
  12. F. Spinozzi and M. Beltramini, Biophys. J., 2012, 103, 511 CrossRef CAS PubMed; F. Spinozzi, P. Mariani, I. Mičetić, C. Ferrero, D. Pontoni and M. Beltramini, PLoS One, 2012, 7, e49644 Search PubMed.
  13. M. G. Ortore, F. Spinozzi, P. Mariani, A. Paciaroni, L. R. S. Barbosa, H. Amenitsch, M. Steinhart, J. Ollivier and D. Russo, J. R. Soc., Interface, 2009, 6, S619 CrossRef CAS PubMed.
  14. F. Spinozzi, C. Ferrero, M. G. Ortore, A. De Maria Antolinos and P. Mariani, J. Appl. Crystallogr., 2014, 47, 1132 CAS.
  15. M. Arai, T. Inobe, K. Maki, T. Ikura, H. Kihara, Y. Amemiya and K. Kuwajima, Protein Sci., 2003, 12, 672 CrossRef CAS PubMed.
  16. O. Keskin, I. Bahar, D. Flatow, D. G. Covell and R. L. Jernigan, Biochemistry, 2002, 41, 491 CrossRef CAS PubMed; Z. Xu, A. L. Horwich and P. B. Sigler, Nature, 1997, 388, 741 CrossRef PubMed; D. K. Clare, D. Vasishtan, S. Stagg, J. Quispe, G. W. Farr, M. Topf, A. L. Horwich and H. R. Saibil, Cell, 2012, 149, 113 CrossRef PubMed.
  17. C. Hyeon, G. H. Lorimer and D. Thirumalai, Proc. Natl. Acad. Sci. U. S. A., 2006, 103, 18939 CrossRef CAS PubMed.
  18. S. Hayward and N. Go, Annu. Rev. Phys. Chem., 1995, 46, 223 CrossRef CAS PubMed.
  19. T. Schwede, J. Ko, N. Guex and M. C. Peitsch, Nucleic Acids Res., 2003, 31, 3381 CrossRef CAS PubMed , http://swissmodel.expasy.org/ M. Biasini, S. Bienert, A. Waterhouse, K. Arnold, G. Studer, T. Schmidt, F. Kiefer, T. G. Cassarino, M. Bertoni, L. Bordoli and T. Schwede, Nucleic Acids Res., 2014, 42, W252 CrossRef PubMed.
  20. C. A. Rohl, C. E. M. Strauss, K. M. S. Misura and D. Baker, Methods Enzymol., 2004, 383, 66 CAS.
  21. Schrödinger Release 2014-3: Maestro, version 9.9, Schrödinger, LLC, New York, NY, 2014 Search PubMed.
  22. D. Chivian, D. E. Kim, L. Malmstrom, P. Bradley, T. Robertson, P. Murphy, C. E. M. Strauss, R. Bonneau, C. A. Rohl and D. Baker, Proteins, 2003, 53, 524 CrossRef CAS PubMed.
  23. D. Van Der Spoel, E. Lindahl, B. Hess, G. Groenhof, A. E. Mark and H. J. C. Berendsen, J. Comput. Chem., 2005, 26, 1701 CrossRef CAS PubMed; B. Hess, C. Kutzner, D. van der Spoel and E. Lindahl, J. Chem. Theory Comput., 2008, 4, 435 CrossRef.
  24. L. Lentini, R. Melfi, A. Di Leonardo, A. Spinello, G. Barone, A. Pace, A. Palumbo Piccionello and I. Pibiri, Mol. Pharmaceutics, 2014, 11, 653 CrossRef CAS PubMed; A. Terenzi, R. Bonsignore, A. Spinello, C. Gentile, A. Martorana, C. Ducani, B. Högberg, A. M. Almerico, A. Lauria and G. Barone, RSC Adv., 2014, 4, 33245 RSC; A. Lauria, R. Bonsignore, A. Terenzi, A. Spinello, F. Giannici, A. Longo, A. M. Almerico and G. Barone, Dalton Trans., 2014, 6108 RSC.
  25. K. Lindorff-Larsen, S. Piana, K. Palmo, P. Maragakis, J. L. Klepeis, R. O. Dror and D. E. Shaw, Proteins, 2010, 78, 1950 CAS.
  26. G. Bussi, D. Donadio and M. Parrinello, J. Chem. Phys., 2007, 126, 014101 CrossRef CAS PubMed; M. Parrinello and A. Rahman, J. Appl. Phys., 1981, 52, 7182 CrossRef PubMed.
  27. T. Darden, D. York and L. Pedersen, J. Chem. Phys., 1993, 98, 10089 CrossRef CAS PubMed.
  28. W. Humphrey, A. Dalke and K. Schulten, J. Mol. Graphics, 1996, 14, 33 CrossRef CAS.

Footnote

Electronic supplementary information (ESI) available. See DOI: 10.1039/c5ra05144d

This journal is © The Royal Society of Chemistry 2015
Click here to see how this site uses Cookies. View our privacy policy here.