Supramolecular hydrogels of α-cyclodextrin/reverse poloxamines/carbon-based nanomaterials and its multi-functional application†
Jinglin Shena,
Guiying Xuab,
Xia Xin*ab,
Lin Wanga,
Zhaohua Songa,
Han Zhanga,
Lu Tonga and
Zewen Yanga
aKey Laboratory of Colloid and Interface Chemistry (Shandong University), Ministry of Education, Shanda nanlu No. 27, Jinan, 250100, P. R. China. E-mail: xinx@sdu.edu.cn; Fax: +86-531-88361008; Tel: +86-531-88363597
bNational Engineering Technology Research Center for Colloidal Materials, Shandong University, Shanda nanlu No. 27, Jinan, 250100, P. R. China
First published on 1st April 2015
Abstract
Supramolecular hydrogels were prepared using α-cyclodextrin (α-CD) and a poloxamine (reverse Tetronic 90R4, T90R4) which has four diblock arms with a poly(propylene oxide)–poly(ethylene oxide) (PPO–PEO) structure. The α-CD can slide past the PPO blocks and towards the middle PEO blocks owing to the unsuitable energy between α-CD and PPO to form α-CD/T90R4 inclusion complexes (ICs). The incorporation of graphene oxide (GO) into α-CD/T90R4 ICs changes their phase behavior and forms mechanically strong hydrogels because of the hydrogen-bonding between the GO nanosheets and the α-CD and PEO blocks of T90R4. The native hydrogel, as well as the α-CD/T90R4/GO hybrid hydrogels, have been thoroughly characterized by using various microscopy techniques. Field emission scanning electron microscopy (FE-SEM) was used to observe the morphology of the hydrogel, and differential scanning calorimetry (DSC) and thermogravimetric analysis (TGA) were used to evaluate the thermal stability of the hydrogel. Fourier transform infrared (FT-IR) spectroscopy and X-ray diffraction (XRD) were used to characterize the interactions within the supramolecular assemblies and the degree of crystallinity of the xerogels, respectively. The experimental results demonstrated that α-CD/T90R4/GO hybrid hydrogels could adsorb various dyes selectively, and that it is a promising candidate for sewage treatment, while the native one cannot adsorb the dyes well. Moreover, the native α-CD/T90R4 hydrogel has excellent biocompatibility, and the results of the in vitro drug release study showed that the injectable doxorubicin (DOX)-loaded hydrogel is appropriate for the controlled release of anticancer drugs, while the α-CD/T90R4/GO hybrid hydrogels can reduce the release rate of DOX.
Introduction
The rapid growth of supramolecular chemistry drives the development of soft materials, which are built based on noncovalent interactions, such as hydrogen bonding, electrostatic interactions, the van der Waals forces, inclusion complexation, π–π stacking, and hydrophobic effects.1,2 Among them, supramolecular gels have received considerable attention due to their unique structures.3 Compared with hydrogels formed by chemical interactions, systems that are made up of supramolecular hydrogels have multiple responses, such as to temperature, pH and light. Thus, they have attracted more attention from people and generate more potential applications, such as dye absorption, drug-release systems and chemical sensors.4–6In particular, macrocyclic host–guest complexation is an interesting domain in supramolecular chemistry.7 Over the past three decades, a variety of host molecules have been synthesized, including crown ethers, catenanes, cyclodextrins, and cucurbit[n]urils.8–10 Among them, cyclodextrin (CD) supramolecular hydrogels occupy an important role, owing to their favourable biocompatibility.11 Cyclodextrins (CDs) are a series of cyclic oligosaccharides composed of 6, 7, and 8 D(+)-glucose units and linked by α-1,4-linkages, and named α-, β-, and γ-CD, respectively.12 There are hydroxyl groups on the rim of the molecule, while the interior of CD is less hydrophilic, allowing hydrophobic molecules to be included within the cavity. CDs are capable of including molecules ranging from small organic/inorganic compounds to polymers to form stable inclusion complexes (ICs),13 such as the drug doxorubicin (DOX), adamantine derivatives, the dye AZO and block polyether (PEO–PPO–PEO). In general, α-CD mainly interacts with linear alkyl chains and poly(ethylene oxide) (PEO)18 and β-CD could selectively interact with branched alkyl chains and poly(propylene oxide) (PPO), while γ-CD could include two chains of PEO.14,15 Thus, the interaction between CD and polyether is rich and interesting.
In the family of carbon nanomaterials, graphene is the one with the most potential due to its outstanding physical, chemical and electronic properties.16 Graphene has a single layer of an sp2 network of carbon atoms and is considered as the thinnest and hardest material known so far.17,18 Graphene oxide (GO) is a graphene sheet with carboxylic groups at its edges and phenol, hydroxyl and epoxide groups on its basal plane. The functional groups of GO make it hydrophilic and easily modified.19,20 Doping GO into a system could regulate the performance of the system. For example, Liu et al. incorporated GO into a polyacrylamide (PAM) hydrogel, and the composite hydrogel exhibited high tensile strength, high toughness and larger elongation at break.21 Fan et al. reported that in the presence of GO, the mechanical strength of the sodium alginate (SA)/polyacrylamide (PAM) ternary nanocomposite hydrogel was enhanced and the dye adsorption capacities of hydrogel were improved significantly.22 Several studies have been reported about nanocomposite supramolecular hydrogels based on polyrotaxanes of cyclodextrins and polymers, such as those incorporating polysaccharide nanocrystals, carbon nanotubes (CNTs), and graphene into the hydrogels.24–26 For example, Zo et al. reported a cyclodextrin-templated but polymer-free supramolecular hydrogel, and incorporating GO into it. The hydrogel provided a uniform dispersion with high GO loading and showed high elastic characteristics.23 Our previous study also demonstrated that the incorporation of graphene into α-CD/a star-like block copolymer AE73 weakened the strength of the hydrogel, while the insertion of GO enhanced the mechanical strength of the hydrogel, and studied the absorption of the dye preliminarily.27
In our present work, we used poloxamines (reverse Tetronic 90R4, T90R4) to construct α-CD/T90R4 hydrogels. T90R4 are four armed copolymers with two blocks per arm, and differently from the normal Tetronics copolymer with outer PEO blocks (90R4), T90R4 presents outer PPO blocks. Thus, in order to form α-CD/T90R4 hydrogels, α-CD should slide over the PPO blocks towards the PEO blocks to form stable ICs.28,29 We studied the phase behavior of α-CD/T90R4 and made comparisons with our previous work to research the kinetics and mechanism of the formation of the hydrogel. After the incorporation of GO solution into the α-CD/T90R4 mixed system, we studied the changes of the phase behavior and the properties of the hydrogels by using various microscopic techniques. Meanwhile, the adsorption capacities for various dyes and the in vitro drug release of the hybrid hydrogels were also investigated.
Experimental section
Materials
α-CD was purchased from Shandong Binzhou Zhiyuan Bio-Technology Co., Ltd. T90R4 was purchased from Sigma-Aldrich and its structure and parameters are shown in Fig. S1.† Graphene oxide (diameter: 0.5–5 mm, thickness: 0.8–1.2 nm) was obtained from Nanjing XFNANO Materials Tech Co., Ltd. All the dyes, rhodamine B (RB), methyl orange (MO), methylene blue (MB), rhodamine 6G (R6G), methyl violet (MV), and amino black 10B (AB10B), were purchased from Shanghai Chemical Co. Doxorubicin hydrochloride (DOX) was obtained from Beijing Huafeng United Technology Co. All the above reagents were used without further purification. Ultrapure water used in the experiments was triply distilled by a quartz water purification system.Sample preparation
GO dispersions were obtained by ultrasonication for four hours. All complexes were formed by mixing a determinate amount of T90R4 and GO with an aqueous solution of α-CD by vigorous stirring. The resulting mixtures were kept at 20 °C for at least one week before measurements.Methods and characterizations
For transmission electron microscopy (TEM) observations, about 5 μL of solution was placed on a TEM grid and the excess solution was wicked away with filter paper. The copper grids were freeze-dried and observed on a JEOL JEM-100 CXII (Japan) at an accelerating voltage of 80 kV. FE-SEM observations were carried out on a JSM-6700F. UV-vis measurements were carried out on a computer-manipulated spectrometer (UV-vis 4100, Hitachi, Japan). The FT-IR spectra were recorded on a VERTEX-70/70v spectrometer (Bruker Optics, Germany). XRD patterns of the freeze-dried samples were measured between 10 and 90° in the 2θ scan mode (2.5° min−1) using a Rigaku D/Max 2200-PC diffractometer with Cu Kα radiation (λ = 0.15418 nm) and a graphite monochromator at room temperature. Raman spectra were obtained using an NXR FT-Raman module (Nexus 670, Nicolet Co.) equipped with a Ge detector. The samples were excited by a laser source with a wavelength of 633 nm and a power of 0.103 W. TGA data were collected using a Universal V3.6 TA Thermal Analysis Q5000 system. The sample was placed in a platinum crucible and heated under a flow of N2 from 50 °C to 800 °C at a heating rate of 10 °C min−1. Gel–sol transition temperatures were obtained using a DSC8500 (PerkinElmer, Waltham, MA, USA). The heating rate was set as 3 °C min−1.Rheological property measurements
The rheological measurements were carried out on an Anton Paar Physica MCR302 rheometer with a cone-plate system (diameter, 25 mm; cone angle 2°). The rheological properties of native hydrogels with different concentrations of T90R4 and hybrid hydrogels with different compositions of GO were measured. Before the frequency sweep, an amplitude sweep at a fixed frequency of 1 Hz was operated to ensure the selected stress was in the linear viscoelastic region. The frequency sweep was carried out from 0.01–100 Hz at a fixed stress of 3 Pa. Then the shear-dependent behaviors with the shear rates ranging from 1 to 1000 s−1 were measured. The samples were measured at 20.0 ± 0.1 °C with the help of a cyclic water bath.Adsorption of dyes
A variety of dyes were selected for studying the adsorption performance of the hybrid hydrogel containing 5 mg mL−1 GO, 150 mg mL−1 α-CD, and 50 mg mL−1 T90R4. A 1 mL amount of the hybrid hydrogel was prepared at the bottom of a tube, which was equilibrated for 2 days at 20 °C. Then 3 mL of a solution containing 0.05 mmol L−1 dye was added on the top of the gel, then the dye solution and the gel were mixed for 5 s to get full contact, and were kept standing for 3 days to achieve adsorption equilibrium. In order to calculate the final concentration of the dyes and to determine the adsorption capacity of the hydrogel for each dye, standard curves were measured firstly using a UV-vis spectrophotometer. We prepared hybrid hydrogels with the same concentration of α-CD and T90R4 but different concentrations of GO to study the adsorption rate of hybrid hydrogels for MB. Aliquots (1.5 mL) of dye solution added on top of the hydrogel were withdrawn over a certain period of time. The MB concentration was evaluated using a UV-vis spectrophotometer at 664 nm. Then the MB solution was carefully put back into the tube again.The equilibrium adsorption capacity, Qe (g L−1) was calculated by the equation:
In vitro drug release
The erosion kinetics and the cumulative release amounts of DOX-loaded hydrogel at different pH (pH = 2, 5, 7.4) at 37 °C were measured. HCl and NaOH were added to phosphate buffer solution (PBS) to reach the specified pH. The concentration of the PBS is 100 mmol L−1. We mixed α-CD/DOX solution with T90R4 to load DOX into the native hydrogel, preparing 1 mL hydrogel in a tube, and then putting 3 mL PBS solution on top of it. Aliquots (1.5 mL) of the PBS solution were withdrawn over a certain period of time. The DOX concentration was evaluated using a UV-vis spectrophotometer at 488 nm. Then PBS solution was carefully put back into the tube again.Results and discussion
Dispersion of GO
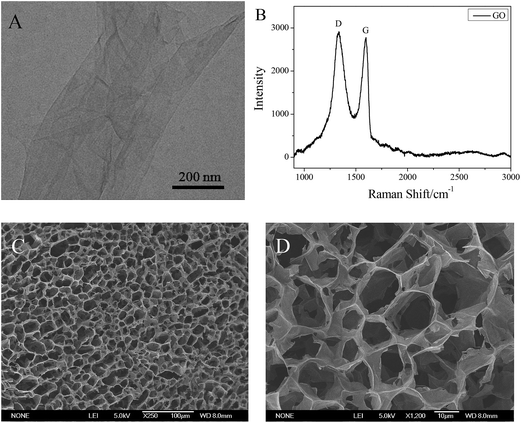
A stable dispersion of GO can be obtained by an ultrasonication process directly in water because of its hydrophilicity, and the obtained GO dispersion can stay stable for several months without precipitation. TEM images (Fig. 1A) showed that GO was fully exfoliated into individual sheets by ultrasonic treatment, which can be attributed to the various oxygen-containing functional groups, such as –COOH and –OH on the surface of the GO sheet.18 Besides, the electrostatic repulsion between the negative charges of GO sheets also promotes the exfoliation of GO. Moreover, in order to demonstrate the characteristics of carbon materials, Raman spectroscopy is a powerful tool. It can be seen that there are two prominent peaks at 1332 cm−1 and 1597 cm−1 (Fig. 1B), which are attributed to the D band and G band, respectively.30 The D band indicates the size of the in-plane sp2 domains, and the G band indicates the defectiveness of the GO nanosheet.31 The ID/IG ratio is very high, which indicates the decreased size of the in-plane sp2 domains. Furthermore, as is shown in the SEM images (Fig. 1C and D), the freeze-dried 5 mg mL−1 GO dispersion has a three-dimensional porous structure, which is also due to a balance of forces between electrostatic repulsion and binding interactions (hydrogen bonding, π-stacking, hydrophobic effects, etc.).Phase behavior of the α-CD/T90R4 mixed system
A phase behavior study of the α-CD/T90R4 mixed system was performed to determine the formation conditions of the hydrogel, and the result are shown in Fig. 2A. It can be seen that the α-CD/T90R4 complex could form micelles when both of the two materials were in very low concentration, and was a transparent solution. Increasing the concentration of either one, a two phase region and a hydrogel region could be found. The formation of a stable hydrogel was determined by the “inverted-vial test”. Fig. S2 A† shows the photos for five typical samples of α-CD/T90R4 with 50 mg mL−1 T90R4 and increasing amounts of α-CD. It can be observed that the samples changed from the solution state into the two phase state, and finally changed into the gel state. It is well known that α-CD can form hydrogels with PEO–PPO–PEO triblock copolymers.32 In addition to the ICs between α-CD and PEO, the hydrophobic interactions between PPO blocks also play an important role in the formation of hydrogels.33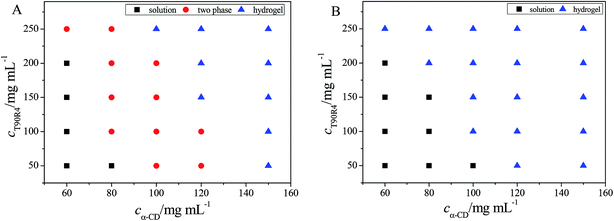 | ||
| Fig. 2 Phase behavior of the (A) α-CD/T90R4 and (B) α-CD/T90R4/3 mg mL−1 GO mixed systems after equilibrating at 20.0 ± 0.1 °C for at least 4 weeks. | ||
In our previous work, we studied the behavior of supramolecular α-CD/star-like block copolymer (AE73) nanomaterials.27 Comparing AE73 with T90R4, it can be found that α-CD/AE73 can form a hydrogel at a lower concentration and faster speed than α-CD/T90R4. Moreover, with increasing concentration of T90R4, α-CD/T90R4 can form a hydrogel faster. On one hand, T90R4 and AE73 are of different structures; T90R4 has four branches while AE73 has seven branches. On the other hand, the outer blocks are hydrophobic PPO and the inner blocks are hydrophilic PEO for T90R4, while the outer blocks are hydrophilic PEO and the inner blocks are hydrophilic PEO for AE73. Thus, α-CD should pass over the PPO blocks to form ICs with the central PEO for α-CD/T90R4 (ref. 28), which surely takes some time. Therefore, we consider that the time of hydrogel formation is strongly dependent on the structure of the copolymer, and the detailed results are shown in Table 1.
| Gel composition (mg mL−1) | Gelation time (min) | ||
|---|---|---|---|
| Polymer concentration | GO | ||
| T90R4 | 50 | 0 | 420 |
| 150 | 0 | 60 | |
| 50 | 3 | 50 | |
| AE73 | 50 | 0 | 20 |
Phase behavior of the α-CD/T90R4/GO mixed system
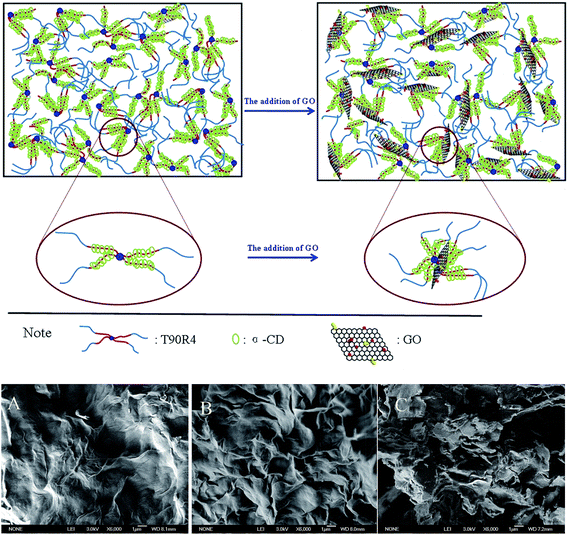
The effect of GO on the phase behavior of the α-CD/T90R4 mixed system was investigated, and the results are shown in Fig. 2B. It can be seen that with the addition of GO, at lower concentrations, a homogeneous solution without precipitation can be formed, which means that GO was inserted into the mixed system perfectly, acting as a cross-linking agent, making the system form a homogeneous solution and promoting the formation of a hydrogel.34 Moreover, the two phase region of α-CD/T90R4 disappeared in the α-CD/T90R4/GO mixed system, and it could form a hydrogel at lower concentrations. This is because there are many oxygen-containing groups on the surface and edges of GO, such as –COOH and –OH, making GO nanosheets hydrophilic. With the addition of GO, GO can form hydrogen bonds and electrostatic interactions with the –OH of α-CD, and the PEO of T90R4, causing the hydrogel to combine with more water molecules.35 The schematic illustrations of the formation of α-CD/T90R4 and α-CD/T90R4/GO hydrogels are shown in Fig. 3 (top). It also can be seen that with the addition of GO, the speed of hydrogel formation is accelerated (Table 1) and the color of the α-CD/T90R4/GO hydrogels become deeper with higher amounts of GO (Fig. S2 B†).Microstructures of the self-assembled structures
SEM images were used to further characterize the morphology of the α-CD/T90R4 native hydrogel and the α-CD/T90R4/GO hybrid hydrogel. For the α-CD/T90R4 native hydrogel, the sample shows a compact network, and it is more like a layer of dense membrane (Fig. 3A). After the addition of GO, a complicated network structure was formed (Fig. 3B and C). It can be seen that the structures of the freeze-dried α-CD/T90R4/GO hydrogels become denser than that of pure GO but looser than those of α-CD/T90R4 hydrogels. This is attributed to the layered GO participating in the formation of the network structures, which demonstrated that the GO nanosheets were inserted into the network successfully.22 Moreover, compared with the hydrogel containing 3 mg mL−1 GO, preparation of the hydrogel with 5 mg mL−1 GO changes the native hydrogel more obviously, because more properties of the three-dimensional porous structure of GO are shown in the α-CD/T90R4/5 mg mL−1 GO hydrogel. This means that the addition of GO changed the morphology of the samples from a dense membrane to a more porous structure.FT-IR and XRD analyses
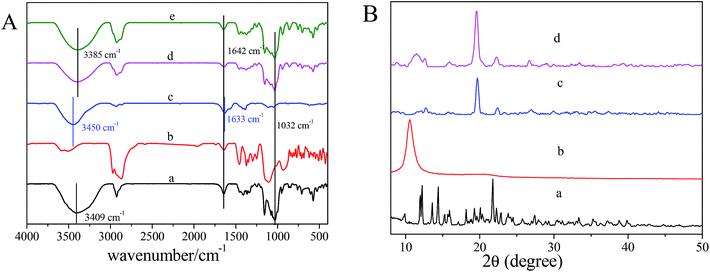
FT-IR is an important method to characterize the interactions of self-assembling supramolecular hydrogels. As is shown in Fig. 4A, the IR spectra of the aerogels of both α-CD/T90R4 and α-CD/T90R4/GO are similar to that of α-CD, illustrating that the skeletons of the aerogels mainly consist of α-CD. The stretching vibration at 1642 cm−1 is owing to the carbonyl groups of GO, and the peak at 1032 cm−1 is consistent with the stretching vibration of the C–O bond of α-CD. Obviously, the wide peak at 3380–3410 cm−1 is attributed to the symmetric and antisymmetric O–H stretching modes. Moreover, the peak of O–H shifts from 3409 cm−1 for α-CD to lower frequency at 3385 cm−1 for the aerogels. It can be concluded that the threading of α-CD onto T90R4 was not only prompted by the inclusion interaction between α-CD and PEO, but also by hydrogen bonding between adjacent α-CDs and between α-CD and PEO.Furthermore, X-ray diffraction (XRD) was used to characterize the polypseudorotaxane structure of the native hydrogel and hybrid hydrogel. As is shown in Fig. 4B, the α-CD/T90R4 native hydrogel is not a simple mixture of these two substances; the prominent peaks at 19.8° and 22.5° indicate the formation of the inclusion complex between the PEO blocks of the T90R4 copolymers and α-CD.36 The peak at 11.5° corresponds to the inter-lamellar spacing between GO nanosheets. The patterns of the hybrid hydrogel and native hydrogel are similar, which indicates that the incorporation of GO has little influence on the structure of the hydrogel. The peak at 11.4° indicates the incorporation of GO. Moreover, Raman spectroscopy also proved the successful insertion of GO into the hydrogel, because of the Raman signal of GO in the aerogels of α-CD/T90R4/GO (Fig. S3†).
DSC and TGA analyses
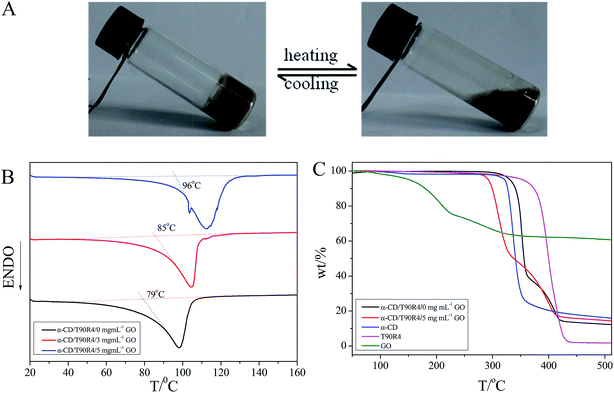
Compared with chemically cross-linked hydrogels, non-covalently cross-linked hydrogels often respond to external stimuli to exhibit sol–gel phase transformations37 and such supramolecular reversible hydrogels are more advantageous for certain applications, such as artificial muscles and sensors. For example, when the stagnant 150 mg mL−1 α-CD/50 mg mL−1 T90R4/3 mg mL−1 GO hybrid hydrogel was heated, it turned into a flowing solution, and when kept standing for 5 hours, it can turn into a hydrogel again (Fig. 5A). Differential scanning calorimetry (DSC) was carried out to get more information about the gel–sol transition temperature (Tg). In Fig. 5B, the Tg of the native hydrogel is 79 °C; with the incorporation of 3 mg mL−1 GO, the Tg increased to 85 °C, and when the concentration of GO was further increased to 5 mg mL−1 GO, the Tg changed to 96 °C. These results are consistent with the phase behavior study done above, which indicated that GO can act as a cross-linking agent and that the addition of GO can improve the mechanical strength of the hydrogels.Then, thermogravimetric analysis (TGA) was used to evaluate the thermal stability of the native aerogel and hybrid aerogel. Compared with the free α-CD, GO and T90R4, the native aerogel undergoes two-step thermal degradation (Fig. 5C). The first step is attributed to the decomposition of α-CD, while the second one to T90R4. Although the curves of weight loss for the native aerogel and hybrid aerogel are similar, using the kinetics between 90% and 60% of mass loss to evaluate the thermal stability,38 it can be found that the course of weight loss for the hybrid aerogel is obviously slower than for the native aerogel. The final weight of the hybrid aerogel being heavier than that of the native aerogel also proves that the incorporation of GO can enhance the thermal stability of the hydrogel.
Rheological properties
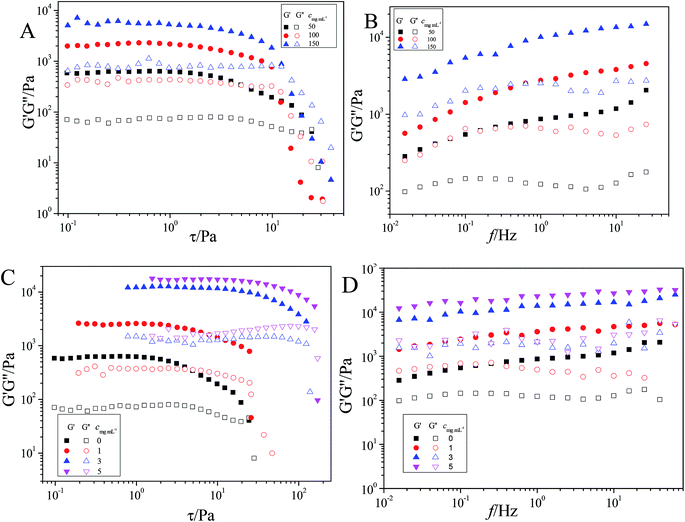
Rheological behavior is one of the most important methods to characterize the viscoelasticity of hydrogels, by measuring the viscosity and elasticity of hydrogels.39 The oscillatory mode was used to detect the yield stress of the hydrogel with a constant frequency of 1 Hz. It can be seen that beyond the yield stress, the solid-like network structure was destroyed. As is shown in Fig. 6A and B, the storage modulus (G′) is much greater than the loss modulus (G′′), which means all the hydrogels possessed a stable network. With increasing amounts of T90R4, the G′ values and G′′ values keep gradually increasing. That is because α-CD and T90R4 can form more ICs, and hydrogen bonding between those substances is enhanced. After adding a small amount of GO, the G′ and G′′ values of the hybrid hydrogel increased enormously (Fig. 6C and D). For example, when the amount of GO is 1 mg mL−1, G′ reaches 2570 Pa, which is 300% higher than the native hydrogel. This result shows that the incorporation of GO nanosheet into the hydrogel increased the elastic and viscous porosity of the hydrogel, which enhances its mechanical properties. This is because the –COOH and –OH on the surface of GO form hydrogen bonds with α-CD and PEO of T90R4, and GO, being hydrophilic, acts as a cross-linking agent in the mixed system. Other rheological results such as the variation of shear viscosity as a function of shear rate and the variations of η* as a function of frequency for the α-CD/T90R4 and α-CD/T90R4/GO hydrogels are shown in Fig. S4.†Adsorption of dyes
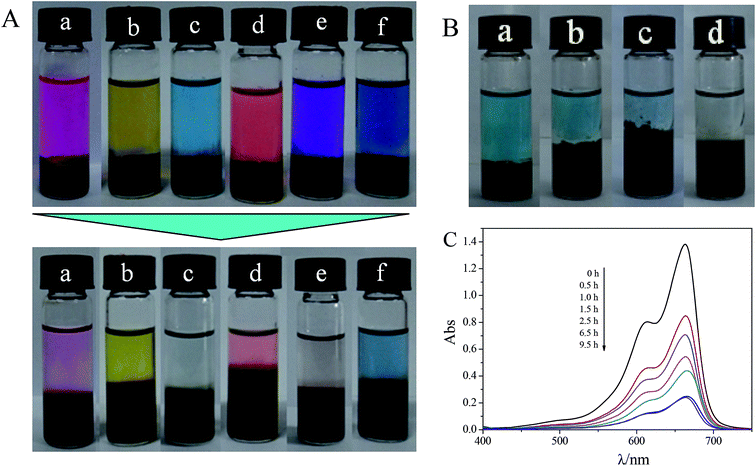
Carbon materials are widely known as adsorbents for dyes,40 metal ions,41 and biomolecules.42 In particular, GO has a huge specific surface area, and the oxygen-containing functional groups of GO can interact with dyes. So the GO-based hybrid hydrogel can absorb a variety of dyes.43 In our experiments, several water-soluble dyes (RB, MB, MV, AB10B, R6G and MO) were used to study the dye adsorption capacity of the GO-based hybrid hydrogels. The structures of the dyes in the studies are given in Fig. S5.† From Fig. 7A, the obvious adsorption of RB, MB and MV, which are cationic dyes, can be observed, while the adsorption of AB10B, R6G and MO is feeble, especially that of MO. The detailed information is shown in Table 2.| Dye | RB | MO | MB | R6G | MV | AB10B |
|---|---|---|---|---|---|---|
| a The initial absorbance of dye.b The final absorbance of dye. | ||||||
| Mw (g mol−1) | 479.01 | 327.33 | 373.9 | 479.01 | 408.03 | 616.49 |
| λmax (nm) | 554 | 463 | 664 | 528 | 574 | 615 |
| Abs0a | 2.634 | 1.042 | 1.381 | 2.534 | 1.086 | 1.019 |
| Abs1b | 0.478 | 0.847 | 0.185 | 1.458 | 0.201 | 0.500 |
| Ce (mmol L−1) | 0.0063 | 0.0410 | 0.0062 | 0.020 | 0.0105 | 0.0245 |
| Qe (g L−1) | 62.799 | 8.838 | 49.128 | 43.11 | 48.351 | 47.16 |
For example, the UV-vis spectrum of MB solution on the top of the hydrogel containing 5 mg mL−1 GO as a function of time is shown in Fig. 7B. Since α-CD and T90R4 are both nonionic materials, we speculate that the adsorption of dyes is mainly due to GO, because there are many functional groups (–COOH and –OH) on the surface and edges of GO which make GO negatively charged. Thus it can interact with positively charged dyes (such as RB, MB, and MV) due to the electrostatic interactions. Moreover, the absorption of AB10B is fairly good due to the π–π interactions and hydrogen bonding between GO and the aromatic moieties present in the molecules of the dye. The standard curves of the dyes at λmax are shown in Fig. S6.† The reason why RB can’t reach full adsorption like MB and MV is that RB can exist in two forms (Fig. S5†). Additionally, the adsorption of MO is worst, which is because MO is anionic and its π–π interaction with GO is the weakest.
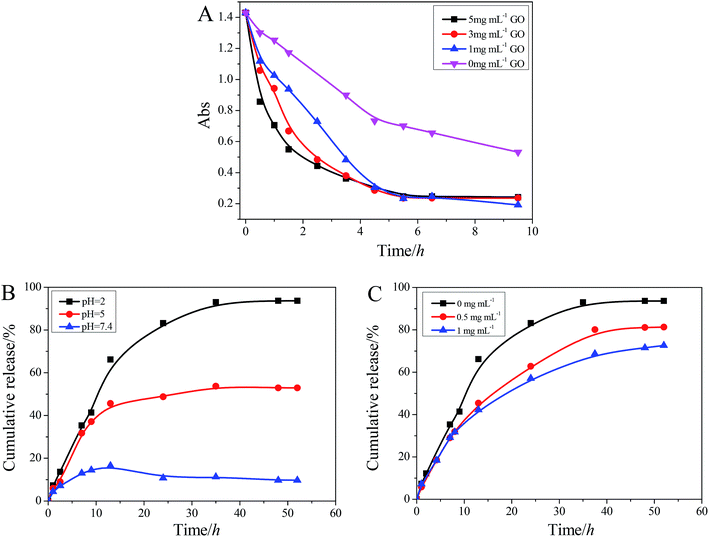
Moreover, in comparison with pure GO powder, which can also adsorb dyes but floated on the surface of the solutions when its freeze-dried samples were used (Fig. S7 B†), α-CD/T90R4/GO hybrid hydrogels can not only play the role of GO, but also fix GO into a hydrogel template. This is a good phenomenon for material recycling. In conclusion, the reason that the hybrid hydrogel can have a good adsorption capacity for dyes is ascribed to electrostatic interactions, strong π–π interactions and hydrogen bonding. Then, we further prepared several hydrogels containing different amounts of GO to study the rate of adsorption and adsorption capacity. As is shown in Fig. S7 A† and Fig. 8A, the adsorption capacity varied in a similar trend, but with increased GO, the rate is increased. Meanwhile, it can be found that the adsorption capacity of the native α-CD/T90R4 hydrogel is weak. The fast adsorption rate and high adsorption capacity of the α-CD/T90R4/GO hybrid hydrogels all proved that this kind of hybrid hydrogel has potential applications for sewage treatment.
In vitro drug release
Because both α-CD and T90R4 are biocompatible, their ICs can always be used as a drug delivery system. To investigate the feasibility of the hydrogel as a carrier for drugs, we selected a water-soluble drug, doxorubicin hydrochloride (DOX), for loading into hydrogel. It has been reported that extracellular pH of tumor tissue is significantly lower than the extracellular pH of normal tissue, and the pH affects the response of tumors to drugs.44 Thus, we selected pH values of 2 and 5 and the physiological pH 7.4 as objects of study. As is shown in Fig. 8B, DOX can achieve sustained release at pH = 2, and the cumulative release reached 94%. With the increasing of pH, the cumulative release is lowered. The incorporation GO into the native hydrogel also reduces the cumulative release (Fig. 8C), which is because GO nanosheets can interact with DOX through π–π interactions (the structure of DOX is shown in Fig. S8†), which hinders the release of DOX. The release of DOX is mainly caused by the break-up of the network structure, which is formed by hydrogen–bond interactions and the crystalline structure of T90R4–α-CD.45 The photographs of the final state of complete DOX release in different conditions are shown in Fig. S9.† Thus, we consider that the α-CD/T90R4 supramolecular hydrogel would be a candidate for an injectable drug release system with a high cumulative release and controllable sustained release kinetics, and that α-CD/T90R4/GO hybrid hydrogels can really exhibit a sustained drug release effect.Conclusions
In conclusion, supramolecular α-CD/T90R4 native hydrogels and α-CD/T90R4/GO hybrid hydrogels were successfully prepared. In the α-CD/T90R4 hydrogels, α-CD could slide past PPO towards the PEO blocks to form inclusion complexes. The hydrogen bonding between PEO and α-CD and the hydrophobic effect of the PPO blocks promotes the formation of a hydrogel. GO-containing α-CD/T90R4 hydrogels had greatly changed phase behavior from the original ternary systems. The results of rheological measurements indicated that the incorporation of GO into α-CD/T90R4 complexes enhanced the mechanical strength of the hybrid hydrogels enormously. DSC and TGA tests proved that the incorporation of GO improved the stability of the hydrogels and that these kinds of α-CD/T90R4/GO hybrid hydrogels respond to temperature reversibly. The GO containing hydrogels could adsorb dyes selectively, making them a promising candidate for sewage treatment. The results of the in vitro drug release experiment illustrated that the α-CD/T90R4 hydrogel showed sustained and controlled release in acidic conditions, and that α-CD/T90R4/GO hybrid hydrogels can really exhibit a sustained drug release effect, which has potential applications in injectable drug release systems.Acknowledgements
We gratefully acknowledge financial support from the National Natural Science Foundation of China (21203109) and Ji’nan Youth Science and Technology Star Program (2013040).References
- D. W. Lim, D. L. Nettles, L. A. Setton, L. A. Setton and A. Chilkoti, Biomacromolecules, 2007, 8, 1463–1470 CrossRef CAS PubMed.
- M. Ma, Y. Kuang, Y. Gao, Y. Zhang, P. Gao and B. Xu, J. Am. Chem. Soc., 2010, 132, 2719–2728 CrossRef CAS PubMed.
- S. J. De Jong, S. C. De Smedt, M. W. C. Wahls, J. Demeester, J. J. Kettenes-Van den Bosch and W. E. Hennink, Macromolecules, 2000, 33, 3680–3686 CrossRef CAS.
- J. S. Park, S. Jeong, B. Ahn, M. Kim, W. Oh and J. Kim, J. Inclusion Phenom. Macrocyclic Chem., 2011, 71, 79–86 CrossRef CAS.
- Y. Lee, S. Fukushima, Y. Bae, S. Hiki, T. Ishii and K. Kataoka, J. Am. Chem. Soc., 2007, 129, 5362–5363 CrossRef CAS PubMed.
- F. Wang, J. Zhang, X. Ding, S. Dong, M. Liu, B. Zheng and F. Huang, Angew. Chem., 2010, 122, 1108–1112 CrossRef PubMed.
- J. Yu, W. Ha, J. Sun and Y. P. Shi, ACS Appl. Mater. Interfaces, 2014, 6, 19544–19551 CAS.
- K. M. Park, J. A. Yang, H. Jung, J. Yeom, J. S. Park, K. Park and K. H. Kim, ACS Nano, 2012, 6, 2960–2968 CrossRef CAS PubMed.
- D. Jiao, J. Geng, X. J. Loh, D. Das, T. C. Lee and O. A. Scherman, Angew. Chem., Int. Ed., 2012, 51, 9633–9637 CrossRef CAS PubMed.
- J. Zhou, M. Chen and G. Diao, ACS Appl. Mater. Interfaces, 2014, 6, 18538–18542 CAS.
- A. Harada, Y. Takashima and H. Yamaguchi, Chem. Soc. Rev., 2009, 38, 875–882 RSC.
- A. L. Nielsen, K. Steffensen and K. L. Larsen, Colloids Surf., B, 2009, 73, 267–275 CrossRef CAS PubMed.
- L. Tan, Y. Liu, W. Ha, L. S. Ding, S. L. Peng, S. Zhang and B. J. Li, Soft Matter, 2012, 8, 5746–5749 RSC.
- A. Harada, H. Adachi, Y. Kawaguchi and M. Kamachi, Macromolecules, 1997, 30, 5181–5182 CrossRef CAS.
- D. S. Guo, K. Wang, Y. X. Wang and Y. Liu, J. Am. Chem. Soc., 2012, 134, 10244–10250 CrossRef CAS PubMed.
- C. Lee, X. Wei, J. W. Kysar and J. Hone, Science, 2008, 321, 385–388 CrossRef CAS PubMed.
- Y. Zheng, N. Wei, Z. Fan, L. Xu and Z. Huang, Nanotechnology, 2011, 22, 405701 CrossRef PubMed.
- D. Li, M. B. Müller, S. Gilje, R. B. Kaner and G. G. Wallace, Nat. Nanotechnol., 2008, 3, 101–105 CrossRef CAS PubMed.
- H. Kim, A. A. Abdala and C. W. Macosko, Macromolecules, 2010, 43, 6515–6530 CrossRef CAS.
- C. Zhang, L. Ren, X. Wang and T. Liu, J. Phys. Chem. C, 2010, 114, 11435–11440 CAS.
- R. Liu, S. Liang, X. Z. Tang, D. Yan, X. Li and Z. Z. Yu, J. Mater. Chem., 2012, 22, 14160–14167 RSC.
- J. Fan, Z. Shi, M. Lian, H. Li and J. Yin, J. Mater. Chem. A, 2013, 1, 7433–7443 CAS.
- H. Zo, J. Lee, K. Song, M. Kim, G. Lee and J. Park, J. Inclusion Phenom. Macrocyclic Chem., 2014, 79, 357–363 CrossRef CAS.
- Z. Hui, X. Zhang, J. Yu, J. Huang, Z. Liang, D. Wang and P. Xu, J. Appl. Polym. Sci., 2010, 116, 1894–1901 CAS.
- X. Zhang, J. Huang, P. Chang, J. Li, Y. Chen, D. Wang and J. Chen, Polymer, 2010, 51, 4398–4407 CrossRef CAS PubMed.
- S. Zu and B. Han, J. Phys. Chem. C, 2009, 113, 13651–13657 CAS.
- J. Shen, X. Xin, Y. Zhang, L. Song, L. Wang, W. Tang and Y. Ren, Carbohydr. Polym., 2015, 117, 592–599 CrossRef CAS PubMed.
- J. Li, X. Ni, Z. Zhou and K. W. Leong, J. Am. Chem. Soc., 2003, 125, 1788–1795 CrossRef CAS PubMed.
- E. Larrañeta and J. R. Isasi, Carbohydr. Polym., 2014, 102, 674–681 CrossRef PubMed.
- E. J. Yoo, T. Okata, T. Akita, M. Kohyama, J. Nakamura and I. Honma, Nano Lett., 2009, 9, 2255–2259 CrossRef CAS PubMed.
- S. Stankovich, D. A. Dikin, R. D. Piner, K. A. Kohlhaas, A. Kleinhammes, Y. Jia and R. S. Ruoff, Carbon, 2007, 45, 1558–1565 CrossRef CAS PubMed.
- A. Harada, Y. Takashima and H. Yamaguchi, Chem. Soc. Rev., 2009, 38, 875–882 RSC.
- E. Larrañeta and J. R. Isasi, Langmuir, 2012, 28, 12457–12462 CrossRef PubMed.
- J. Liu, G. Chen and M. Jiang, Macromolecules, 2011, 44, 7682–7691 CrossRef CAS.
- X. Dong, G. Xing, M. B. Chan-Park, W. Shi, N. Xiao, J. Wang and P. Chen, Carbon, 2011, 49, 5071–5078 CrossRef CAS PubMed.
- W. Saenger, J. Jacob, K. Gessler, T. Steiner, D. Hoffmann, H. Sanbe and T. Takaha, Chem. Rev., 1998, 98, 1787–1802 CrossRef CAS PubMed.
- F. van de Manakker, L. M. J. Kroon-Batenburg, T. Vermonden, C. F. van Nostrum and W. E. Hennink, Soft Matter, 2010, 6, 187–194 RSC.
- M. L. Arnal, V. Balsamo, F. Lopez-Carrasquero, J. Contreras, M. Carrillo, H. Schmalz and A. J. Müller, Macromolecules, 2001, 34, 7973–7982 CrossRef CAS.
- X. Sun, X. Xin, N. Tang, L. Wang and G. Xu, J. Phys. Chem. B, 2014, 118, 824–832 CrossRef CAS PubMed.
- A. Méndez, F. Fernández and G. Gascó, Desalination, 2007, 206, 147–153 CrossRef PubMed.
- G. K. Ramesha, A. Vijaya Kumara and H. B. Muralidhara, J. Colloid Interface Sci., 2011, 361, 270–277 CrossRef CAS PubMed.
- X. Zuo, S. He, D. Li, C. Peng, Q. Huang, S. Song and C. Fan, Langmuir, 2009, 26, 1936–1939 CrossRef PubMed.
- C. Li, M. She, X. She, J. Dai and L. Kong, J. Appl. Polym. Sci., 2014, 131, 39872 Search PubMed.
- L. E. Gerweck, S. Vijayappa and S. Kozin, Mol. Cancer Ther., 2006, 5, 1275–1279 CrossRef CAS PubMed.
- W. Ha, J. Yu, X. Y. Song, J. Chen and Y. P. Shi, ACS Appl. Mater. Interfaces, 2014, 6, 10623–10630 CAS.
Footnote |
| † Electronic supplementary information (ESI) available. See DOI: 10.1039/c5ra04351d |
| This journal is © The Royal Society of Chemistry 2015 |


