Highly active sustainable ferrocenated iron oxide nanocatalysts for the decolorization of methylene blue

Atchaleeya Jinasanab, Thinnaphat Poonsawata, Laksamee Chaicharoenwimolkulc, Soraya Pornsuwana and Ekasith Somsook*a
aNANOCAST Laboratory, Center for Catalysis, Department of Chemistry and Center of Excellence for Innovation in Chemistry, Faculty of Science, Mahidol University, 272 Rama VI Rd., Ratchathewi, Bangkok 10400, Thailand. E-mail: ekasith.som@mahidol.ac.th; Fax: +66 23547151; Tel: +66 22015123
bThe Materials Science and Engineering Program, Faculty of Science, Mahidol University, 272 Rama VI Rd., Ratchathewi, Bangkok 10400, Thailand
cChemistry, Faculty of Science and Technology, Suratthani Rajabhat University, 272 Moo 9, Surat-Nasan Rd., Khuntale, Muang, Surat Thani 84100, Thailand

Received 4th March 2015 , Accepted 27th March 2015

First published on 27th March 2015


Abstract

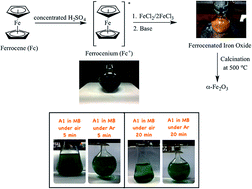
Ferrocenated iron oxide nanoparticles were successfully synthesized in basic conditions. It was unexpected to discover highly active sustainable nanocatalysts for the decolorization of methylene blue in the absence of light and hydrogen peroxide. Cyclopentadienyl radicals may be responsible for the production of active species for the decolorization of methylene blue. The nanocatalysts can be reactivated in sodium chloride solution and reused several times.


The urbanization in many fast-growing developing countries leads to the increasing demand for and shortage of clean water.1 Therefore, new sustainable technologies are being developed to solve this problem. At present, innovative tools such as advanced oxidation processes2 involving highly reactive oxygen species can be used for the treatment of wastewater. Fenton reaction3 is a well-known reaction between Fe(II) and hydrogen peroxide to generate Fe(III), hydroxide and hydroxyl radicals to eliminate pollutants. The key intermediates are hydroxyl radicals generated in situ in those processes. Dyes are basically represented as the pollutants.4 Generally, excess hydrogen peroxide is required for the Fenton reaction to generate active hydroxyl radicals for the decomposition of dyes.5 However, it is not practical to use excess hydrogen peroxide for real applications.

Iron oxides are abundant, cheap and available almost everywhere on earth.6 In the light of environmental concerns, it is sustainable to use iron oxide for the water treatment by adsorption process7 and advanced oxidation process.8 Iron oxide is usually inert and excess hydrogen peroxide is required for generating hydroxyl radicals for this application. Furthermore, iron oxide can be selectively separated out from the reaction by applying a magnetic field.9

Ferrocene ((C5H5)2Fe or Fc)10 is a nonpolar molecule which is soluble in concentrated sulfuric acid to give a blue viscous solution of ferricinium or ferrocenium ((C5H5)2FeH+ or Fc+).10b,11 The decomposition of Fc+ undergoes very fast in neutral or basic aqueous solution.12 It was observed that Fc+ was transformed to orange precipitate at pH 9. Iron oxides are also formed as a result of this decomposition.13 In addition, reactive oxygen species can be generated from the reaction of Fc+ derivatives and dioxygen.13,14 Herein, new ferrocenated iron oxide samples based on the coprecipitation of Fe(II) and Fe(III) and redox active species (Fc/Fc+) in a basic condition were synthesized in which reactive oxygen species were expected to be produced for the decolorization of methylene blue under the aerobic condition. Ferrocenated compounds are termed for species deriving from ferrocene.

Different synthetic conditions were carried out as shown in Scheme 1 and Table 1 to study the phase transformation, morphology, magnetism, surface area, pore size, pore volume, surface state and composition, and catalytic activity of ferrocenated iron oxide nanoparticles. First, ferrocenium was simply prepared by reaction of ferrocene with 0.3 cm3 of concentrated sulfuric acid and then a solution of FeCl2/FeCl3 was added into the ferrocenium solution. A NaOH or NH4OH solution was slowly added dropwise the solution of FeCl2/FeCl3 with and without ferrocenium to adjust pH to 12 to obtain ferrocenated iron oxide samples (A1, A3, B1 and B3) and iron oxide samples (C1 and C3), respectively. Then the prepared samples were calcined in a furnace at 500 °C under ambient atmosphere for 5 hours to produce calcined samples (A2, A4, B2, B4, C2 and C4). The color changes were observed after calcination with phase transformation from amorphous iron oxide to α-Fe2O3 crystalline15 as indicated in XRD pattern (see ESI, Fig. S1). The XRD results revealed the patterns of ferrocene in A1, A3, B1 and B3.


image file: c5ra03885e-s1.tif
Scheme 1 Synthesis of ferrocenated iron oxide nanoparticles.
Table 1 Synthesis of iron oxide nanoparticles
Sample Fc+[thin space (1/6-em)]:[thin space (1/6-em)]Fe(III)[thin space (1/6-em)]:[thin space (1/6-em)]Fe(II) Base Temp. (°C) Color
A1 3[thin space (1/6-em)]:[thin space (1/6-em)]2[thin space (1/6-em)]:[thin space (1/6-em)]1 NaOH Orange
A2 3[thin space (1/6-em)]:[thin space (1/6-em)]2[thin space (1/6-em)]:[thin space (1/6-em)]1 NaOH 500 Red
A3 3[thin space (1/6-em)]:[thin space (1/6-em)]2[thin space (1/6-em)]:[thin space (1/6-em)]1 NH4OH Orange
A4 3[thin space (1/6-em)]:[thin space (1/6-em)]2[thin space (1/6-em)]:[thin space (1/6-em)]1 NH4OH 500 Red
B1 5[thin space (1/6-em)]:[thin space (1/6-em)]2[thin space (1/6-em)]:[thin space (1/6-em)]1 NaOH Orange
B2 5[thin space (1/6-em)]:[thin space (1/6-em)]2[thin space (1/6-em)]:[thin space (1/6-em)]1 NaOH 500 Red
B3 5[thin space (1/6-em)]:[thin space (1/6-em)]2[thin space (1/6-em)]:[thin space (1/6-em)]1 NH4OH Orange
B4 5[thin space (1/6-em)]:[thin space (1/6-em)]2[thin space (1/6-em)]:[thin space (1/6-em)]1 NH4OH 500 Red
C1 0[thin space (1/6-em)]:[thin space (1/6-em)]2[thin space (1/6-em)]:[thin space (1/6-em)]1 NaOH Black
C2 0[thin space (1/6-em)]:[thin space (1/6-em)]2[thin space (1/6-em)]:[thin space (1/6-em)]1 NaOH 500 Red brown
C3 0[thin space (1/6-em)]:[thin space (1/6-em)]2[thin space (1/6-em)]:[thin space (1/6-em)]1 NH4OH Black
C4 0[thin space (1/6-em)]:[thin space (1/6-em)]2[thin space (1/6-em)]:[thin space (1/6-em)]1 NH4OH 500 Red brown


The morphology of ferrocenated iron oxide depends on both base type and the ratio of starting Fc+ in iron oxide reaction. From Fig. 1, the TEM images revealed that the morphology of ferrocenated iron oxide samples prepared in the presence of NaOH was nanofiber having the width and length around 20 and 300 nm, respectively. However, the TEM images of the ferrocenated iron oxide samples synthesized in the presence of NH4OH revealed that many small particles were aggregated to form clusters like a sponge. The particles showed an average diameter of less than 10 nm. Furthermore, the presence of ferrocene in the coprecipitation reaction had effects on the morphology where the higher amount of ferrocene yielded the larger particle size. The iron oxide sample prepared without the addition of Fc+ yielded smaller particles. In addition, the zeta potentials of ferrocenated iron oxide samples were negative on the surface (see ESI, Table S1).


image file: c5ra03885e-f1.tif
Fig. 1 TEM images of ferrocenated iron oxide nanoparticles in ratio (A1) Fc+/Fe(III)/Fe(II) = 3[thin space (1/6-em)]:[thin space (1/6-em)]2[thin space (1/6-em)]:[thin space (1/6-em)]1 with NaOH, (A3) Fc+/Fe(III)/Fe(II) = 3[thin space (1/6-em)]:[thin space (1/6-em)]2[thin space (1/6-em)]:[thin space (1/6-em)]1 with NH4OH, (B1) Fc+/Fe(III)/Fe(II) = 5[thin space (1/6-em)]:[thin space (1/6-em)]2[thin space (1/6-em)]:[thin space (1/6-em)]1 with NaOH, (B3) Fc+/Fe(III)/Fe(II) = 5[thin space (1/6-em)]:[thin space (1/6-em)]2[thin space (1/6-em)]:[thin space (1/6-em)]1 with NH4OH, (C1) Fc+/Fe(III)/Fe(II) = 0[thin space (1/6-em)]:[thin space (1/6-em)]2[thin space (1/6-em)]:[thin space (1/6-em)]1 with NaOH, and (C3) Fc+/Fe(III)/Fe(II) = 0[thin space (1/6-em)]:[thin space (1/6-em)]2[thin space (1/6-em)]:[thin space (1/6-em)]1 with NH4OH.

The surface state and surface composition of the prepared nanoparticles can be determined by XPS (see ESI, Fig. S2 and Table S2).16 The C 1s signal at 284.9 eV (C–C) was observed only in A1, A3, B1 and B3 samples and diminished after calcination in A2 sample.15b The photoelectron spectra revealed the binding energy of Fe 2p at 708 eV for the A1, A3, B1 and B3 samples with the pattern of ferrocene.17 Furthermore, Fe3+ 2p3/2 were found at 710, 711, and 713 eV, respectively for all samples.18 The FTIR spectra confirmed the formation of iron oxide at 475 and 560–580 cm−1 (see ESI, Fig. S3).19 TGA/DSC revealed that the composition percentage of ferrocene in A1 samples was about 60% (see ESI, Fig. S4 and Table S3). The magnetization curves of iron oxide nanoparticles were determined with vibrating sample magnetometer (VSM) (see ESI, Fig. S5). Hysteresis curves of A1 and A3 samples were paramagnetic20 and that of C1 was superparamagnetic21 with zero coercivities. Interestingly, the magnetism change was observed from paramagnetic to ferromagnetic15b after calcination of A1 sample. EPR spectra of all samples before calcination were determined (see ESI, Fig. S6) with a strong signal of g-value about 2.0. This g-value corresponds to iron species of iron oxide.22 On the other hand, the calcined samples gave broaden signals of Fe(III) ion with g-value at 3.8 (ref. 22) as confirmed by the XPS data. The BET analysis describing surface area, pore size and volume of ferrocenated iron oxide nanoparticles was summarized in Table S4 (see ESI). It is clearly shown that the surface area and pore volume of most iron oxide catalysts before calcination decreased significantly when compared with after calcination. Moreover, all prepared samples were mesoporous. Furthermore, the CHN analysis revealed the lower percentages of carbon and hydrogen in the calcined iron oxide samples (see ESI, Table S5). The composition of prepared ferrocenated iron samples (A1, A3, B1 and B3) may contain ferrocene, iron oxide, and other organic species.

The ferrocenated iron oxide nanocatalysts were applied in the decolorization of methylene blue that was monitored by spectrophotometry at λmax = 662 nm. The catalytic decolorizations were carried out in a dark box without the addition of hydrogen peroxide. From Fig. 2, A1, B1 and C1 samples underwent rapid decolorization of methylene blue. The C/C0 values decreased from 1 to less than 0.2 in 5 min for A1, 20 min for B1, and 40 min for C1, respectively. In the absence of ferrocene (C1), the decolorization of methylene blue was slower and the C/C0 was constant at 0.13 even after 2 hours. It was found that the decolorization process was facilitated by ferrocene and the ratio of Fc+[thin space (1/6-em)]:[thin space (1/6-em)]Fe(II) was maximized at 3[thin space (1/6-em)]:[thin space (1/6-em)]1. The NH4OH systems (A3, B3 and C3) generally exhibited slower decolorization. The ESI-MS analysis of the decolorization product in the presence of A1 catalyst collecting at different times was very informative. Before decolorization, the signal of methylene blue was observed with m/z = 284 (see ESI, Fig. S7).23 At the longer time, this signal decreased and disappeared in 20 minutes along with the appearance of the decomposition products with m/z = 285, 301, and 317 (see ESI, Scheme S1). Other signals with m/z = 130 and 186 found at 5 minutes were assigned to dicyclopentadienyl cation and Fc+, respectively. Several catalytic systems including ferrocene24 for the decolorization or decomposition of methylene blue have been reported involving the addition of excess hydrogen peroxide.5 Interestingly, it was found that the decolorization of methylene blue in the absence of hydrogen peroxide could be carried out in the presence of our catalysts even in the dark condition. In addition, the A1 catalyst was further used in the study of reusability as shown in Fig. 3. In the first run, 98% of methylene blue was decolorized in 2 hours. However, the decolorization of methylene blue was dropped to 95, 73, and 3% for the 2nd, 3rd, and 9th runs, respectively. At the 10th run, the catalytic activity of A1 catalyst was completely lost. To prolong the activity of nanocatalysts in the decolorization of methylene blue, the catalyst was reactivated with 0.1 mol dm−3 sodium chloride and de-ionized water at the end of each run. Thus, the catalyst was active as seen in the high decolorization percentage of 95% and 96% for sodium chloride and de-ionized water at the first run and the catalyst was still active even at the 12th run. Here, sodium chloride played a role as exchanging ions to remove cationic methylene blue adsorbed on the catalysts. It was found that the concentrations of methylene blue eliminated from the catalysts were low at the 1st to 5th batch and higher at the 6th to 12th batch (see ESI, Fig. S8). Two mechanisms may be attributed to the decolorization of methylene blue. At the first run, the methylene blue may be decomposed by active species from reaction of catalyst and dioxygen. After the first run, the reactive species may be lost due to leaching to the solution. However, the decolorization of methylene blue could proceed through the adsorption mechanism as the adsorbed species could be removed by sodium chloride.


image file: c5ra03885e-f2.tif
Fig. 2 The decolorization of methylene blue catalyzed by ferrocenated iron oxide nanocatalysts before calcination under the aerobic condition and in the absence of hydrogen peroxide and light.

image file: c5ra03885e-f3.tif
Fig. 3 Reusability of A1 catalyst with and without the reactivation by sodium chloride and de-ionized water.

The detection of “short-lived” free radicals in iron oxide catalyst can be investigated with spin trapping technique.25 EPR spectra of DMPO adducts in phosphate buffer and these simulation of adducts described the percentage of superoxide and hydroxyl adducts were shown in Fig. S9. The percentage of superoxide adduct in fresh A1 catalyst decreased significantly from 72% to 40% when these catalysts were reused in 12 times with 0.1 mol dm−3 sodium chloride as shown in Table S6. The decolorization of methylene blue can be explained by the proposed mechanism of the demetallation of ferrocenium to produce “stable” cyclopentadienyl radical and then reactive oxygen species (ROS) as shown in Scheme 2. Free Fe(II), Fe(III), and iron oxide derived from ferrocene and the coprecipitation of Fe(II) and Fe(III) were not active enough to generate ROS in the system. In a separated experiment, the decolorization of methylene blue solution under an inert atmosphere was slower indicating that molecular oxygen was required to generate ROS and presumably the ROS was not generated at the starting of experiment until dissolving in the water (see ESI, Fig. S10). Dicyclopentadienyl radical was derived from the dimerization of cyclopentadienyl radical as observed by ESI-MS at m/z = 130.


image file: c5ra03885e-s2.tif
Scheme 2 Proposed mechanism of the demetallation of ferrocenium to generate cyclopentadienyl radicals and reactive oxygen species.

In conclusions, ferrocenated iron oxide nanoparticles were successfully synthesized by coprecipitaion of Fc+, Fe(II) and Fe(III) in a basic condition. The decolorization of methylene blue was carried out in the presence of these nanoparticles in the absence of light and hydrogen peroxide. These nanocatalysts can be regenerated to prolong the life of nanocatalysts in the presence of sodium chloride solution. This method can be used as a sustainable approach for the water treatment.

Experimental section

Preparation of nanocatalysts

The coprecipitation of Fe(II), Fe(III), and ferrocenium ion was carried out at different ratio including different bases. The following procedure is for the preparation of A1 or A3 sample. Other ratios can be adjusted accordingly. Concentrated sulfuric acid (0.3 cm3) was added to ferrocene (6.84 g, 36.75 mmol) and stirred for 2 minutes giving a blue viscous solution. Water (5 cm3) was then added and stirred for 30 min. A solution of ferrous chloride tetrahydrate (1.55 g, 12.25 mmol) and ferric chloride hexahydrate (4.15 g, 25.6 mmol) in 80 cm3 de-ionized water was then added into the ferrocenium solution and stirred for 1 hour. 8.35 mol dm−3 NaOH or 4.83 mol dm−3 NH4OH solution was slowly added dropwise to adjust pH to 12 giving an orange precipitate. The mixture was then stirred for 2 hours. The orange precipitate was collected by centrifugation at 4500 rpm for 20 minutes. The product was purified by alternate washing with de-ionized water, collected by centrifugation for 6 times, and checked sulfate salt with dropwise de-ionized water after washing in BaCl2 solution. The orange solid was then incubated at 80 °C for 24 hours giving 8.69 g product. The product may be further calcined at 500 °C for 5 hours to give A2 sample.

The decolorization of methylene blue

The desired catalyst (0.100 g) was added into a solution of methylene blue (9.97 × 10⁻⁶ mol dm−3, 100 cm3). The reaction flask was wrapped with aluminium foil and kept in the dark box while stirring. At desired time, 3 cm3 of the solution mixture was collected for analysis. The catalyst was separated from the mixture by centrifugation at 4500 rpm for 3 minutes. The clear supernatant was analyzed by UV-visible spectrophotometer and ESI-MS. To reuse of the catalyst, the separated resulting catalyst was then added a methylene blue solution (9.97 × 10⁻⁶ mol dm−3, 100 cm3) for the second run. The process was repeated as needed.

The reactivated catalyst

The catalyst was added a solution of the reactivator (100 cm3) (0.1 mol dm−3 sodium chloride and de-ionized water), stirred for 10 minutes, and separated by centrifugation at 4500 rpm for 3 minutes.

Instruments

The ferrocene-trapped iron oxide nanoparticles were characterized by X-ray powder diffraction (XRD). The XRD pattern was obtained on a Bruker D8 ADVANCE diffractometer with Cu-Kα radiation between 10° to 80°. The morphology images of nanoparticles were obtained by transmission electron microscopy (TEM) model JEOL JEM-2100 on copper grid covered by formvar. Fourier transform infrared spectroscopy (FTIR) was performed on Perkin Series to identify the functional groups in iron oxide. The UV-visible spectrophotometer was carried out on JASCO V-530 in range of 350–700 nm and scan speed of 1000 nm min−1. Thermal analysis (DSC/TGA) was performed on TA instruments SDT2960 Simultaneous using the heating rate at 20 °C min−1 from room temperature to 800 °C under nitrogen gas. Electrospray ionization (ESI) was carried out on microTOF, and positive ion mode. Electron paramagnetic resonance spectroscopy (EPR) was carried out on JEOL JES-RE2X operated at X-band microwave (8.8–9.6 GHz), magnetic field range of 3.1 T, cylindrical cavity resonator (TE011 mode), and program ES-PRIT. Vibrating sample magnetometer (VSM) was performed on electromagnet in model HV-4H, Hall probe-based gaussmeter on model Lakeshore 455, and field range up to ±9 kOe. X-ray photoelectron spectroscopy (XPS) was performed on Kratos Axis Ultra. Brunauer–Emmett–Teller (BET) was measured surface area, pore size and volume using a QuantachromeAutosorb Automated Gas Sorption System in nitrogen adsorption. The zeta potential technique was carried out with Zetasizer Nano-ZS model ZEN 3600. Elemental analyses were performed on a Perkin-Elmer series II CHNS/O Analyzer 2400.

Acknowledgements

The financial supports by the Biofuel development for Thailand fund through Center of Excellence for Innovation in Chemistry (PERCH-CIC), the Thailand Research Fund, and the Office of the Higher Education Commission-Mahidol University under the National Research University Initiative are acknowledged.

Notes and references

  1. (a) A. K. Biswas, Int. J. Water Resour. Dev., 2006, 22, 183–197 CrossRef; (b) G. T. Daigger, Water Environ. Res., 2009, 81, 809–823 CrossRef CAS.
  2. (a) S. Malato, P. Fernández-Ibáñez, M. I. Maldonado, J. Blanco and W. Gernjak, Catal. Today, 2009, 147, 1–59 CrossRef CAS PubMed; (b) M. N. Chong, B. Jin, C. W. K. Chow and C. Saint, Water Res., 2010, 44, 2997–3027 CrossRef CAS PubMed; (c) E. Neyens and J. Baeyens, J. Hazard. Mater., 2003, 98, 33–50 CrossRef CAS; (d) R. Andreozzi, V. Caprio, A. Insola and R. Marotta, Catal. Today, 1999, 53, 51–59 CrossRef CAS; (e) P. R. Gogate and A. B. Pandit, Adv. Environ. Res., 2004, 8, 501–551 CrossRef CAS.
  3. H. J. H. Fenton, J. Chem. Soc., Trans., 1894, 65, 899–910 RSC.
  4. (a) P. V. Nidheesh, R. Gandhimathi and S. T. Ramesh, Environ. Sci. Pollut. Res., 2013, 20, 2099–2132 CrossRef CAS PubMed; (b) S. Rahim Pouran, A. A. Abdul Raman and W. M. A. Wan Daud, J. Cleaner Prod., 2014, 64, 24–35 CrossRef CAS PubMed.
  5. A. Dhakshinamoorthy, S. Navalon, M. Alvaro and H. Garcia, ChemSusChem, 2012, 5, 46–64 CrossRef CAS PubMed.
  6. R. M. Cornell and U. Schwertmann, The Iron Oxides: Structure, Properties, Reactions, Occurences and Uses, Wiley VCH, 2003 Search PubMed.
  7. L. S. Zhong, J. S. Hu, H. P. Liang, A. M. Cao, W. G. Song and L. J. Wan, Adv. Mater., 2006, 18, 2426–2431 CrossRef CAS.
  8. S. S. Lin and M. D. Gurol, Environ. Sci. Technol., 1998, 32, 1417–1423 CrossRef CAS.
  9. C. T. Yavuz, J. T. Mayo, W. W. Yu, A. Prakash, J. C. Falkner, S. Yean, L. Cong, H. J. Shipley, A. Kan, M. Tomson, D. Natelson and V. L. Colvin, Science, 2006, 314, 964–967 CrossRef PubMed.
  10. (a) T. J. Kealy and P. L. Pauson, Nature, 1951, 168, 1039–1040 CrossRef CAS; (b) G. Wilkinson, M. Rosenblum, M. C. Whiting and R. B. Woodward, J. Am. Chem. Soc., 1952, 74, 2125–2126 CrossRef CAS.
  11. (a) L. Chaicharoenwimolkul, S. Chairam, M. Namkajorn, A. Khamthip, C. Kamonsatikul, U. Tewasekson, S. Jindabot, W. Pon-On and E. Somsook, J. Appl. Polym. Sci., 2013, 130, 1489–1497 CrossRef CAS; (b) L. Chaicharoenwimolkul, A. Munmai, S. Chairam, U. Tewasekson, S. Sapudom, Y. Lakliang and E. Somsook, Tetrahedron Lett., 2008, 49, 7299–7302 CrossRef CAS PubMed.
  12. H. J. Hwang, J. R. Carey, E. T. Brower, A. J. Gengenbach, J. A. Abramite and Y. Lu, J. Am. Chem. Soc., 2005, 127, 15356–15357 CrossRef CAS PubMed.
  13. (a) G. Zotti, G. Schiavon, S. Zecchin and D. Favretto, J. Electroanal. Chem., 1998, 456, 217–221 CrossRef CAS; (b) J. P. Hurvois and C. Moinet, J. Organomet. Chem., 2005, 690, 1829–1839 CrossRef CAS PubMed.
  14. D. Osella, M. Ferrali, P. Zanello, F. Laschi, M. Fontani, C. Nervi and G. Cavigiolio, Inorg. Chim. Acta, 2000, 306, 42–48 CrossRef CAS.
  15. (a) A. Kay, I. Cesar and M. Grätzel, J. Am. Chem. Soc., 2006, 128, 15714–15721 CrossRef CAS PubMed; (b) J. H. Bang and K. S. Suslick, J. Am. Chem. Soc., 2007, 129, 2242–2243 CrossRef CAS PubMed.
  16. K. Sivula, R. Zboril, F. Le Formal, R. Robert, A. Weidenkaff, J. Tucek, J. Frydrych and M. Grätzel, J. Am. Chem. Soc., 2010, 132, 7436–7444 CrossRef CAS PubMed.
  17. A. W. Taylor and P. Licence, ChemPhysChem, 2012, 13, 1917–1926 CrossRef CAS PubMed.
  18. A. P. Grosvenor, B. A. Kobe, M. C. Biesinger and N. S. McIntyre, Surf. Interface Anal., 2004, 36, 1564–1574 CrossRef CAS.
  19. H. Liu, Y. Wei, P. Li, Y. Zhang and Y. Sun, Mater. Chem. Phys., 2007, 102, 1–6 CrossRef CAS PubMed.
  20. D. N. Srivastava, N. Perkas, A. Gedanken and I. Felner, J. Phys. Chem. B, 2002, 106, 1878–1883 CrossRef CAS.
  21. R. Peng, W. Zhang, Q. Ran, C. Liang, L. Jing, S. Ye and Y. Xian, Langmuir, 2011, 27, 2910–2916 CrossRef CAS PubMed.
  22. K. V. P. M. Shafi, A. Ulman, X. Yan, N.-L. Yang, C. Estournès, H. White and M. Rafailovich, Langmuir, 2001, 17, 5093–5097 CrossRef CAS.
  23. A. C. Silva, R. M. Cepera, M. C. Pereira, D. Q. Lima, J. D. Fabris and L. C. A. Oliveira, Appl. Catal., B, 2011, 107, 237–244 CrossRef CAS PubMed.
  24. (a) Q. Wang, S. Tian and P. Ning, Ind. Eng. Chem. Res., 2014, 53, 643–649 CrossRef CAS; (b) Q. Wang, S. Tian and P. Ning, Ind. Eng. Chem. Res., 2014, 53, 6334–6340 CrossRef CAS.
  25. M. A. Voinov, J. O. S. Pagán, E. Morrison, T. I. Smirnova and A. I. Smirnov, J. Am. Chem. Soc., 2011, 133, 35–41 CrossRef CAS PubMed.

Footnote

Electronic supplementary information (ESI) available: Synthesis and characterization data of the catalysts. See DOI: 10.1039/c5ra03885e

This journal is © The Royal Society of Chemistry 2015
Click here to see how this site uses Cookies. View our privacy policy here.