DOI:
10.1039/C5RA03496E
(Paper)
RSC Adv., 2015,
5, 31329-31340
Coupling electric energy and biogas production in anaerobic digesters – impacts on the microbiome†
Received
26th February 2015
, Accepted 25th March 2015
First published on 25th March 2015
Abstract
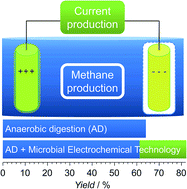
The combination of anaerobic digestion (AD) and microbial electrochemical technologies provides the opportunity to efficiently produce methane and electrical energy from complex biomass. Enhanced methane production and system stability have been reported but the causes (electrolysis or microbial–electrochemical interactions) are less understood. Using the model substrate corn silage it is demonstrated that, for conditions allowing microbiome growth and adaptation, the methane yield of combined reactors remains constant (216 (±29) mL godm−1) while a second product, electrons (q = 14.4 (±0.8) kC, jmax = 1.34 mA cm−2 geometric current density), is also generated. The combined strategy allowed up to a 27% increase in total yield while the reactor community and its dynamics over time were not affected. A typical AD composition of Firmicutes, Bacteroidetes, Proteobacteria, and Synergistetes (bacteria) as well as Methanosarcina, Methanoculleus and Methanobacterium (archaea) was found in the bulk liquid. Specific enrichments of Geobacter (anode) and Methanobacterium (cathode) were of functional relevance.
1 Introduction
Anaerobic digestion (AD) is a widely applied technology that allows turning biomass into methane, which is subsequently most often exploited by combustion. In Germany about 7700 biogas plants are installed,1 most of them in an agricultural setting while internationally AD is more relevant for treating slurries and concentrated industrial or domestic wastewaters with low solid contents.2 During anaerobic digestion, complex organic substrates are degraded by primary and secondary fermenting bacteria to small organic acids, which are then transformed by methanogenic archaea to methane and carbon dioxide. Imbalances between the trophic levels of the reactor microbiome often result in accumulation of organic acids, which leads to process inhibition and failure.3 Microbial fuel cells (MFCs), being the archetype of microbial bioelectrochemical systems (BES), are considered an alternative microbial electrochemical technology (MET)4 for converting biomass to electricity. The core of every BES is the interaction of electroactive microorganism and the electrode, which directly links the microbial and electrochemical activity.5–7 At microbial fuel cell anodes, the electroactive microorganisms oxidize their substrate molecules and thus generate electricity. Important, however, is that most known electroactive microorganisms can only utilize small organic molecules (e.g. acetate and lactate) and rely on the pre-digestion by fermenting bacteria (see e.g. ref. 8) for utilizing complex biomasses. Thus an integrated exploitation of complex biomass by AD (to CH4) and MFCs (to electricity) is appealing, as it shall allow a complete substrate digestion based on flexible product utilization on different trophic levels. This provides the opportunity of process management not only in terms of desired products (steering between CH4 and electric energy gain), but also regarding efficient consumption of substrates, intermediates or undesired side products.
The particular combination of anaerobic digestion with microbial electrochemical technologies, sometimes denominated as “eAD”, was introduced in the recent years. Thereby, enhanced methane production as well as higher system stability was proposed in comparison to “conventional” AD.9–11 An overview on eAD studies and their main results is given in Table 1. Obviously, the reactor type, substrate, microbial source and electrochemical operation conditions differed considerably not allowing any systematic assessment. Most importantly, in all types of setups electric energy was invested, whereas we show here that additional electric energy can potentially be gained. Further, it is most important to clarify whether the (sometimes) reported increased biogas production after investment of electricity was caused by electrolysis related effects or by direct electrochemical interaction of microorganisms with the electrodes.
Table 1 Overview on eAD studies setups and resultsa
Reference |
Operating conditions |
Substrate |
Microbial source |
Operational parameters |
Effect on methane production |
Ecell [V] |
jgeom [A m−2] |
jvol [mA LR−3] |
n.d. not determined, the value was not determined or not given in the reference. Values in italics were calculated based on the data given in the publication. *Working electrode potential vs. Ag/AgCl reference electrode. |
9 |
- Mesophilic UASB reactor |
Synthetic wastewater |
Mesophilic anaerobic granular sludge from a wastewater plant |
2.8–3.5 |
n.d. |
60–110 |
Increase of methane production (10–25%) |
- Single-chamber setup |
- Anode: titanium mesh |
- Cathode: stainless steel mesh |
- Electrolysis conditions |
25 |
- Mesophilic CSTR |
Cow manure, switch grass |
Substrate, anaerobic sludge |
n.d. |
n.d. |
0–33.3 |
Increase of methane production (26%) |
- Single-chamber setup |
- Anode: IrO2-covered titanium mesh |
- Cathode: stainless steel mesh |
28 |
- Mesophilic UASB reactor |
Synthetic wastewater with increasing salinity |
Laboratory-scale UASB reactor |
1.2 |
max. 0.3 |
23.4 |
n.d. |
- Single-chamber setup |
- Anode: hollow FE cylinder |
- Cathode: graphite axle |
11 |
- Mesophilic CSTR |
Waste activated sludge, molasses |
Anaerobic sludge from a municipal sludge digester |
0.5, 1 |
3.36–6.78 |
25.2–50.85 |
No direct effect but stabilization |
- Single-chamber setup |
- Carbon felt electrodes |
10 |
- Mesophilic septic tanc with sequential compartments for anode and cathode reaction |
Simulated black wastewater |
Primary wastewater sludge, pig manure |
2 |
0.9–5.0 |
0.8–7.4 |
Increase of methane production (factor 5) |
- Single-chamber setup |
- Electrolysis conditions |
26 |
- Thermophilic modified H-type MFC |
Artificial garbage slurry (+0.2 mM of 2,6-anthraquinone disulfonate) |
Thermophilic anaerobic digester with garbage slurry |
−0.3, −0.6, −0.8* |
−0.0625–0.3825 |
−1.0–6.12 |
Increase of methane production (81%) |
- Dual-chamber setup |
- Carbon electrodes |
In this study the effect of an electrochemical setup on anaerobic digestion in eAD reactors is examined. The system performance and reactor microbiome in eAD reactors was investigated using an automated biomethane potential test system12 combined with a potentiostatically controlled (providing a constant electrode potential) three-electrode setup. Single chamber eAD reactors (where the microbiome faces the anode and the cathode) as well as dual-chamber eAD reactors (where the microbiome faces only the anode) were investigated at potentials being low enough to avoid water electrolysis. These were benchmarked on “conventional” AD reactors as well as to eAD reactors facing water electrolysis. Process parameters (current production, volatile fatty acids concentration, methane production, pH) were frequently recorded, the reactor microbiome was monitored over time and the community composition (bacteria and archaea in the bulk liquid as well as on the electrodes) was determined at the end of each experiment.
2 Material and methods
2.1 General conditions
All experiments were conducted under anoxic conditions at 37 °C. All chemicals were of analytical or biochemical grade. If not stated otherwise, all potentials provided in this article refer to the Ag/AgCl reference electrode (sat. KCl, 0.195 V vs. SHE (standard hydrogen electrode)).
2.2 Reactor setup
A modified Automatic Methane Potential Test System (AMPTS, Bioprocess Control AB, Sweden12) allowing up to 15 parallel batch experiments was used. It consists of a temperature controlled incubation unit (37 °C) hosting up to 15 tailor-made glass reactors (see ESI Fig. S1†). Fig. 1 shows the dual-chamber (DC) setup, for the single-chamber (SC) setup the counter electrode shielding and membrane were removed and the counter electrode fully immersed. All setups allowed the introduction of electrodes and provided further sampling ports. The stirring was either performed with the AMPTS stirrers (slow rotating agitator from top) for setting I or with magnetic stirrer bars (bottom of reactors, 120 rpm). In the latter case, the experiments were performed within a temperature controlled incubation chamber (37 °C). The change of the steering system was necessary dependent on the seeding sludge (see below) to avoid settling of substrate particles and ensure homogenous mixing of the reactor content in experimental setting II and III, respectively (see Table 2 for details). The standard reactor liquid volume was 400 mL (details see Section 2.4). For gas quantification a CO2 fixing unit and gas volume measuring device with 15 channels was connected and operated according to the provider's regulations. The produced gas from the reactors passed the CO2 fixing bottles that contained each 80 mL 3 M NaOH and thymolphthaleine pH-indicator (0.002%). The remaining gas is supposed to be methane and was quantified by the gas volume measuring device, based on liquid displacement and buoyancy, interfaced to automated data acquisition for each channel including pressure and temperature compensation.
 |
| Fig. 1 Experimental setup: (A) schematic illustration of dual-chamber (DC) eAD reactor. A tailor-made glass reactor was modified to introduce working electrode (anode), Ag/AgCl reference electrode with luggin capillary and shielded counter electrode (cathode) – components not drawn to scale (details see also Section 2.2). (B) Reaction equations for methane and current production and theoretical maximum product yields for the present setup (details Section 2.8). | |
Table 2 Overview of all studied setups, all having 2.5 g corn silage as carbon source
Denomination |
Electrochemical conditionsa |
Single-chamber (SC) or dual-chamber (DC) setup |
Number of replicates |
Seeding sludge 50% |
Seeding sludge 5% |
Potential vs. Ag/AgCl reference electrode. |
Setting I (standard AD conditions, system validation) |
SC−0.2 V |
−0.2 V |
SC |
3 |
|
SC+0.2 V |
+0.2 V |
SC |
3 |
|
DC−0.2 V |
−0.2 V |
DC |
3 |
|
DC+0.2 V |
+0.2 V |
DC |
3 |
|
AD |
OCP |
SC |
8 |
|
![[thin space (1/6-em)]](https://www.rsc.org/images/entities/char_2009.gif) |
Setting II (growth conditions) |
SC−0.2 V |
−0.2 V |
SC |
|
3 |
SC+0.2 V |
+0.2 V |
SC |
|
3 |
DC−0.2 V |
−0.2 V |
DC |
|
3 |
DC+0.2 V |
+0.2 V |
DC |
|
3 |
AD |
OCP |
SC |
|
9 |
![[thin space (1/6-em)]](https://www.rsc.org/images/entities/char_2009.gif) |
Setting III (electrolysis conditions) |
DC+0.2 V |
+0.2 V |
DC |
|
3 |
SC−1.2 mA |
−2.1 mA (electrolysis) |
SC |
|
2 |
AD |
OCP |
SC |
|
3 |
2.3 Electrochemical setup
Each reactor contained a three electrode arrangement consisting of a graphite rod working electrode (projected surface area; 16.2 cm2, CP-Graphite GmbH, Germany), a Ag/AgCl reference electrode (sat. KCl, SE11, Sensortechnik Meinsberg, Germany, 0.195 V vs. SHE) and a graphite rod serving counter electrode (projected surface area; 19.6 cm2, CP-Graphite GmbH, Germany). The three electrodes were either arranged as single-chamber (SC) setup, where the reactor microbiome was facing the working and the counter electrode, or the counter electrode was separated using a cation exchange membrane (fumasep FKE, FuMA-Tech, Germany), denominated as dual-chamber (DC) setups, here the reactor microbiome faces only the working electrode. The latter setup equals the anode chamber of a microbial fuel cell. Thus the anode based effects can be individually studied using DC, while in the SC setup both electrodes can functionally contribute. As AD control reactors served SC setups without any potential applied to the working electrodes (open circuit conditions (OCP)).
The experiments were carried out under potentiostatic or galvanostatic control using a potentiostat (MPG-2, BioLogic Science Instruments, France) equipped with 16 independent channels. Current production, i, was monitored with chronoamperometry and recorded every 5 min. The current density is calculated per projected surface area and denominated as ‘‘geometric current density’’, j see also,13 volumetric current density refers to the liquid reactor volume.
2.4 Seeding sludge and substrate
According to the guidelines by the Association of German Engineers (VDI 4630), the seeding sludge, i.e. inoculum, for all reactors was an anaerobic digestion sludge mixture consisting of wastewater sludge and sludge from a biogas plant and pre-incubated without any substrate. It was sieved (pore size 1 mm) and diluted with mineral salt and buffer solution containing in g L−1 NaHCO3 1.36, KHCO3 1.74, NH4Cl 0.31, KCl 0.13, as well as trace metal and vitamin solution (according to ref. 9 and 14 allowing routine sampling with a 0.9 × 70 mm syringe). The inoculum was either 50% or 5% (vol/vol) of the 400 mL reactor content (final pH 7.7–7.8). The only organic carbon and energy source was 2.5 g dried ground corn silage 1 mm (MF 10.1, IKA®-Werke GmbH & Co. KGA GmbH, Staufen, Germany) with 874 g organic dry matter (godm) per kg of fresh mass (for odm determination see ESI†). It was added to each individual reactor immediately before the start of the experiment.
2.5 Analytical methods
Regularly (every 2–3 days), all reactors were sampled (3 mL) with a syringe for analytical and microbiological analysis. For the sampling procedure, the gas tubes were closed and 3 mL nitrogen gas added for volume adjustment. The pH was determined with a pH-meter (H138 miniLab™ Elite (HACH-Lange, Germany)) that was calibrated on the daily basis. In case of a pH drop in the medium below pH = 6.4 sodium carbonate (1 g per reactor) was added for adjustment. Volatile fatty acids (VFA) concentrations were determined using HPLC (details ESI†).
Methane production was monitored online with a tailor made AMPTS (see 2.2.). Due to the specific setup higher standard deviations, of in average ∼10%, compared to conventional AMPTS, were achieved. All values for methane production are given in mLNORM CH4 per gram odm (mL CH4 godm−1). Norm conditions refer to the dry gas at 101.325 kPa and 273.15 K.
The methane production potential of the seeding sludge without substrate addition for all settings was determined. It was 23 (±4) mL CH4 per setup in setting I, here being subtracted, and <8 mL CH4 per setup for setting II and thus below one tipping unit of the gas counter (ESI Table S1†). For some reactors in setting III regular gas sampling in the headspace and GC analysis (Micro GC CP 2002 P, Chrompack, with Molsieve 5A PLOT and Haye Sep A) was performed.
2.6 Experimental conditions
Three different conditions, denominated further as settings I, II and III were investigated. Each experiment was performed in minimum as independent biological triplicate in parallel (if not stated otherwise, see setting III) and up to 15 reactors were run per installation – see Table 2 for an overview.
2.6.1 Setting I: validation of standard setup for anaerobic digestion batch tests. The first set of experiments was performed with minor dilution of the seeding sludge (50% (vol/vol) of the total reactor content), adapted from a standard setup for methane production potential tests in anaerobic digestion (VDI 4630). Five electrochemical setups were applied (Table 2): Three reactors were run at a constant potential of −0.2 V at the working electrode using single-chamber (SC) setup, denominated as SC−0.2 V, and three reactors with the same potential as dual-chamber (DC) setup (DC−0.2 V). Another set of reactors was run at a potential of +0.2 V in SC and DC setup, respectively (SC+0.2 V, DC+0.2 V). The chronoamperometric measurements were intermitted by cyclic voltammetry (CV) measurements every 24 hours. Further, eight reactors were run as “conventional” AD reactors at open circuit potential (OCP, no potential applied), with the OCP-measurements being intermitted for regular CV measurements. The CV measurements were performed in the potential range of −0.5 to 0.3 V with a scan rate of 1 mV s−1, three cycles were recorded and only the third cycle analyzed.
2.6.2 Setting II: electrochemical stimulation under biomass growth conditions. By applying the standard setup for anaerobic digestion batch tests (setting I) a relatively low amount of carbon and energy substrate (corn silage) is provided per microorganisms in the inoculum, therefore, only minor or even no growth is expected. To monitor the effect of electrochemical stimulation on the microbial community under actively growing conditions the experiments were adapted: the seeding sludge was further diluted (5% (vol/vol)) and an identical organic substrate load (2.5 g dried ground corn silage) per reactor as in setting I was added.Whereas the chronoamperometric and AD control conditions were used for setting II as described for setting I, the scan rate for the CV measurements was adapted: first two CV measurements were performed at 2 mV s−1 (only 2nd cycle analyzed) and one further CV at 0.5 mV s−1.
2.6.3 Setting III: electrolysis conditions. The third set of experiments was performed to create a link to previous publications performed under galvanostatic conditions resp. constant electrolysis (see also 3.1.3). Using biomass growth conditions (setting II) two SC reactors were set to a constant current of −1.2 mA (geometric current density of −0.074 mA cm2, volumetric current density of −3 mA L−1) denominated as SC−1.2 mA. This value was chosen in accordance to previous studies operating at a current range of −40 to −180 mA for a 24 L reactor,10 thus equalling −2.9 mA L−1 on average. For direct comparability of their performance, three DC reactors were run at a potential of +0.2 V (DC+0.2 V) and three AD control reactors under OCP conditions in parallel according to setting II (Table 2). CV measurements for all reactors were performed as described for setting II.For these experiments the AMPTS gas measuring device was not suitable, as in addition to methane, also hydrogen (produced at the working electrode) and oxygen (produced at the counter electrode) are supposed to enter the gas volume measuring device. Instead, GC measurements for determining the gas composition in the headspace of the reactors were performed regularly (see 2.5).
2.7 Microbiological analysis
Microbial community analysis can be performed on different levels and entities. Within this study the microbiome has been described by (1) its structure and structural variation using the single cell based method flow cytometry and cytometric fingerprinting and by (2) its composition on a phylogenetic level using the DNA based fingerprint method T-RFLP.
2.7.1 Flow cytometry. Every cell has individual characteristics based on cell morphology and DNA content. Both can be measured using e.g. the cell size related forward scatter signal (FSC) as well as the DNA content after staining using the DNA specific fluorescent dye DAPI (4′,6-diamidino-2-phenylindole). Performing these measurements for diverse microbial communities sample specific cytometric fingerprints are recorded within minutes for every sample and reflect the specific structure of the microbial community. Changes in the community structure (resulting from changes in the presence of cells and their activity) are reflected by changes in the cytometric fingerprint. Regularly, the bulk liquid of the reactors was sampled for the reactor community. The electrode biofilms (if present) were additionally sampled at the end of the experiments. The sample fixation, staining procedure, cytometric measurements and data analysis were performed according to.15,16 In short, the samples were fixated in 2% paraformaldehyde solution, washed with phosphate buffer and finally stained with DAPI applying a two-step procedure. First, the cells were incubated with solution A (2.1 g citric acid and 0.5 g Tween 20 in 100 mL bidistilled water) for 20 min and then washed and incubated in solution B (0.68 μM DAPI (Sigma-Aldrich, Germany), 400 mM Na2HPO4, pH 7.0) for 3 h in the dark at 20 °C. The cytometric measurements were performed with a MoFlo cell sorter (DakoCytomation, USA) which is equipped with a blue (488 nm) and a UV (355 nm) laser. Excitation with the blue laser was used to analyze the forward and sideward scatter, and the UV laser for the UV induced DAPI-DNA fluorescence. Fluorescent beads (yellow-green fluorescent beads: 2 μm, FluoSpheres 505/515, F-8827, crimson fluorescent beads: 1 μm, FluoSpheres 625/645, F-8816, Molecular Probes Eugene, Oregon, USA, Fluoresbrite BB Carboxylate microspheres, 0.5 μm, Polyscience, USA) were used to ensure instrumental alignment. The cytometric data files were uploaded to the Flow Repository: http://https://flowrepository.org/id/FR-FCM-ZZGB.
2.7.2 DNA extraction, T-RFLP, sequencing. In addition to the community dynamics in the course of the experiment, the microbial community composition of the reactor community and the electrode biofilms were determined on DNA level using T-RFLP at the end of the experiments. In addition, a clone library was constructed from a SD+0.2 V reactor sample that showed an even distribution of the major terminal restriction fragments (T-RFs) in the T-RFLP analysis.DNA extraction was performed with the NucleoSpin Soil® kit (Macherey-Nagel) following the manufacturer's instruction (lysis buffer 2 for biofilms, lysis buffer 1 for reactor content, sample lysis with FastPrep® (Thermo Fisher Scientific) speed 4 for 20 s). The final elution step was performed with 50 μL elution buffer and yielded up to 110 ng μL−1 genomic DNA for reactor content and up to 325 ng μL−1 for biofilms.
PCR was performed with the primer set UniBac27f and Univ1492r for amplifying the partial sequence of the 16S rRNA gene of bacteria17 and the primer set mlas und mcrA_rev for amplification of the archaeal mcrA gene (subunit A of methyl coenzyme M reductase).18 T-RFLP analysis, cloning and sequencing were performed according to standard procedures (further details ESI†).
2.8 Electron balances
The complete aerobic oxidation of the substrate corn silage, C22H36O18 (details ESI Table S2†), can be described as C22H36O18 + 22 O2 → 22 CO2 + 18 H2O. The average oxidation number of the carbon in the substrate corn silage, C22H36O18, is 0 and +4 in the combustion product CO2, thus, 88 moles of electrons are released per mol of substrate. Further, 2.19 godm of substrate were provided to each reactor which equals 1.77 g of fermentable dry matter.19 Based on this consideration and a molecular weight of 588 g mol−1 for C22H36O18, 0.003 mol fermentable substrate was given per reactor.
As an eAD is considered being a combination of anaerobic digestion and a bioelectrochemical system, the electrons of the substrate oxidation can either be transferred to methane (case I) or to the anode as terminal electron acceptor (case II), see also Fig. 1.
Case I: considering the complete anaerobic digestion of the substrate to CH4 and CO2 according to ref. 20 and a molar volume of methane of 22.4 L mol−1 (0 °C) a total of 739 mL methane per reactor can be expected at maximum, equaling to 337 mL godm−1. The efficiency of the anaerobic digestion process in terms of methane yield (YCH4) can be calculated as the ratio of measured and maximum methane production.
Case II: based on Faraday's law, a total electric charge, q, of 25.5 kC (q = 0.003 mol × 88 × 96
485 C mol−1) can be generated per reactor for the complete oxidation of the substrate, equaling to 11.6 kC godm−1. The yield of the electrochemical process, i.e. coulombic efficiency, CE, is then calculated as percentage of measured charge compared to the theoretical maximum value.
Consequently, the yield using eAD is calculated by summing up YCH4 and CE and reaches 100% for the complete anaerobic oxidation of the degradable substrate to methane or electric energy, respectively. This definition applies strictly for the DC setups, equaling MFCs, but for the SC setups the “recycling” of electrons from the unshielded cathode in the reactor compartment resulting in seemingly higher methane formation has to be considered (see also 3.4).
3 Results and discussion
Three experimental settings aiming at different eAD conditions were investigated on process performance and microbial community dynamics using a standardized seeding sludge as inoculum and identical substrate (see Table 2 for a summary). Generally for eAD experiments single chamber (SC) reactors and double chamber (DC) reactors were used. In DC reactors the microbiome faces only the working electrode (anode) and thus mimics a typical anode half-cell; in SC reactors the microbiome faces working electrode (anode) and counter electrode (cathode), as in a microbial electrolysis cell. Two working electrode potentials, being typical for anode half cells (−0.2 V vs. Ag/AgCl and +0.2 V vs. Ag/AgCl), were applied in order to study different driving forces, resp. potential terminal electron acceptors on the eAD process. Furthermore, AD reactors hosting electrodes, but without applying a potential, i.e. open circuit potential (OCP), were used as benchmark.
3.1 Process characteristics: combining current and methane production
3.1.1 System validation. First, the setups were validated using AD standard conditions for testing the methane production potential (setting I). The major methane formation for all reactors occurred within the first few days of the experiment and the average production for all setups was 325 (±25) mL CH4 godm−1 being in good accordance with the expected value21 (see ESI Table S1 for details†). Metabolite analysis revealed that acetate and propionate were only detected at the first sampling point (day 3) and the pH was not affected. An oxidative, i.e. positive, current flow was shown by all eAD setups with maximum current densities between 1.2 and 6 μA cm−2. With decreasing methane production also the current density declined and stabilized in all reactors below 0.004 μA cm−2. Noteworthy, spiking the reactor with acetate resulted in an immediate oxidative current flow (details ESI Fig. S2†).As expected, a very fast substrate turnover took place applying setting I. The fast turnover is intended by this type of experiment designed for testing the methane production potential of substrates, i.e. the maximum methane yield per g of organic dry matter. Microbial growth and thus microbiome shifts were marginal. As consequence the current production of the not growing cells was very low indicating a major conversion of the substrate to methane (see 3.2 Yield and electron balances). In accordance, only a very thin layer of attached biomass was found at the anodes (further details in Section 3.3 Microbiome structure and composition).
3.1.2 Biomass growth conditions. For understanding the impact of the electrochemical setting on the microbiome, methane production potential and current production, the experiments were adapted (setting II). The same reactor designs as used for setting I were applied, with the only exception that lower biomass seeding of only 5% was used. The methane production and VFA accumulation started slower and lasted longer than in setting I, indicating an overall slower substrate turnover. As a consequence of the higher substrate availability per cell, actively metabolising cells were able to reproduce and thus an overall shift of the reactor microbiome took place (details Section 3.3). The methane production depleted after 12 to 18 days at an overall average of 216 (±29) mL CH4 godm−1 for all settings without significant differences between the eAD and AD reactors (for details see ESI Table S1†).Fig. 2 shows the course of the VFA concentrations, methane formation and current production exemplarily for an SC+0.2 V reactor applying setting II. All processes started within four days and the successful substrate degradation is reflected by accumulation of volatile fatty acids which are then degraded until day 20 of the experiment. This is in accordance with the methane production curve, which reaches its plateau at day 16 indicating no further methanogenesis. The oxidative current production at the anodes showed a similar development as the daily methane production with a rapid start within the first four days, a nearly constant current density between day four and 11 and a sharp decline afterwards. Interestingly, the VFA concentrations are in line with the current production, i.e. after degradation of free acetate, propionate and butyrate on the reactor liquid the current density declines.
 |
| Fig. 2 Exemplary course of process parameters of a SC+0.2 V eAD-reactor: the geometric current density j was monitored continuously (chronoamperometry) and is given as solid black line. Volatile fatty acid concentrations, cOA, were measured regularly in reactor samples: acetate (green rectangle), propionate (green circle) and butyrate (green triangle). The accumulated methane production on the daily basis is given with black rectangles. | |
Considering all reactors with setting II (Fig. 3), acetate, propionate, and butyrate were detected in the bulk liquid after three days but in significantly different amounts. The lowest maximum concentrations for acetate were present in the SC reactors (acetate: 970 (±85) mg L−1 SC−0.2 V and 1054 (±108) mg L−1 SC+0.2 V, both at day 3), while the AD control reactors reached the higher concentrations of VFAs with 1620 (±35) mg L−1 acetate at day seven. For propionate and butyrate the peak concentrations showed no significant differences, but the degradation rate was higher for the SC setups, with the highest rate in the SC−0.2 V reactors. Finally, all VFAs were degraded after 20 days. This is in accordance with the by then stationary methane production curves.
 |
| Fig. 3 Organic acids production: time-course of volatile fatty acids concentrations (A–C) and pH (D) for growth conditions (setting II) in different reactor setups and applied potentials. The pH was adjusted after measurement at day 2 (*). | |
All eAD reactors were characterized by oxidative current production starting after 2 days (−0.2 V) and after 3 days (+0.2 V) independently of the SC or DC setup (see ESI Fig. S3 for all chronoamperograms as well as ESI Fig. S4† for representative CV measurements). Peak values of current production in the SC setups reached jmax = 1.34 mA cm−2 geometric current density (SC−0.2 V, day 3) and jmax = 1.18 mA cm−2 (SC+0.2 V, day 4). This equals to volumetric peak current densities up to 54.3 mA LR−1 (SC−0.2 V, day 3). The peak current production in the DC reactors was about 22% (DC−0.2 V) and 30% (DC+0.2 V) lower than in the respective SC reactors, which can be assigned to separation of the anode and cathode chamber (see Section 3.4 for detailed discussion). The course of the current production correlated with the acetate concentrations in the reactors, this is not as pronounced for the other VFAs. This finding as well as the CV results (ESI Fig. S4†) already indicates a dominance of Geobacteraceae for the microbial electrocatalysis in the anode biofilms.
The described combined methane production and electric current flow in setting II can either be the result of an adaptation of the reactor community to the electrochemical stimulation or be related to the formation of a biofilm on the electrodes which additionally contributes to the anaerobic digestion process. Both options and their functional implications will be discussed in Section 3.3.
As Fig. 3 shows, pH decreased below pH 7 at day 2 and was adjusted one time for all reactors (indicated in the figure). Over the time course of the experiment, the DC reactors had considerable lower pH values compared to SC and AD control setup (Fig. 3). This pH-shift between anode and cathode compartment is caused by charge balancing ion transport not being based on H+/OH−, due to the membrane performance as described earlier,22,23 resulting in a proton accumulation in the anode chamber. As a pH-value below 7.0 is seen as critical for the anaerobic digestion process,24 there might have been some inhibitory effects in the DC reactors leading to reduced VFA degradation. The pH change was not found in the previous set of experiments (setting I) as the total charge produced was lower and the higher amount of seeding sludge led to a higher buffer capacity.
These results clearly show that for conditions allowing microbial growth (i.e. setting II) a combined substrate exploitation for methane and electron production takes place. This is reflected in an adaptation of the microbial community and leads to a general conceptual model of substrate utilization (Section 3.4).
3.1.3 Electrolysis conditions. In previous studies (see Table 1) voltages (of the electrochemical cell) or constant currents were applied to eAD setups facilitating water electrolysis. Water electrolysis results in hydrogen production at the cathode and oxygen production at the anode. These reactions can therewith improve the AD process (among others increased methane production, see Table 1) by (i) abiotic electro-hydrolysis of the substrate, (ii) support of microbial substrate hydrolysis based on micro-aerobic conditions and (iii) hydrogenotrophic methane formation. Consequently, to investigate, if the positive effects of electrochemical stimulation on anaerobic digestion described (Table 1) result from electrochemically stimulated microbial activity (as found in the current study) or is rather based on abiotic substrate electro-hydrolysis an additional set of experiments was performed (setting III). According to the conditions in a previous study10 two SC reactors were set to a constant current of −1.2 mA (SC−1.2 mA, equal to 54 mmol H2 per day at the working electrode) and three DC+0.2 V reactors as well as three AD control reactors were run in parallel.When using the constant electrolysis current (SC−1.2 mA) the anaerobic digestion process was delayed in comparison to DC+0.2 V and AD control reactors run in parallel. While similar peak concentrations of acetate and propionate were found in all reactors (acetate: 1802 (±167) mg L−1 DC+0.2 V (day 7), 1749 (±76) mg L−1 OCP (day 7), 1940 (±114) mg L−1 SC−1.2 mA (day 15); propionate: 415 (±60) mg L−1 DC+0.2 V (day 15), 424 (±101) mg L−1 OCP (day 15), 390 (±25) mg L−1 SC−1.2 mA (day 21)), their complete degradation was only achieved for the DC+0.2 V reactors and the AD control reactors. Significant amounts were accumulated at day 23 in the electrolysis reactors SC−1.2 mA (780 (±56) mg L−1 acetate, 358 (±44) mg L−1 propionate). For butyrate higher concentrations of up to 504 (±17) mg L−1 (day 3) were measured compared to the other setups 427 (±24) mg L−1 DC+0.2 V (day 7), 295 (±47) mg L−1 OCP (day 4) but found degraded by the end of the experiment.
Analysis of gas composition in the headspace revealed a delay in methane production of electrolysis reactors. They differed in gas composition during the first days of the experiment: hydrogen (9 (±4)%) was found in the continuous electrolysis reactors SC−1.2 mA at day 2 but depleted at the following sampling points, meaning that microorganisms metabolised 1.4 L H2 and 0.7 L O2 produced daily by electrolysis. The maximum relative methane concentration in the headspace of the reactors was comparable for all setups in setting III (DC+0.2 V, 58 (±14)% day 17; SC−1.2 mA, 59 (±9)% day 21; AD control (OCP), 57 (±29)% day 21).
In conclusion, no positive effect of electrolysis on the biogas production process performance was found. This is in contrast to earlier studies.9,10,25,26 For the reported differences the increased substrate availability after electrolysis might be one reason, as better process performance may also result from (abiotic) substrate disintegration by radicals formed during electrolysis. This cannot be accounted for in the current study, as carbohydrates in corn silage are already well available, but may play a bigger role for more complex substrates like manure10,25 or lignin rich compounds.27 However, positive effects of electrolysis on AD were also described for synthetic wastewater fed reactors.9 Thus, the substrate disintegration cannot be the only positive effect. However, also different experimental setups (batch and fed-batch experiments26 vs. continuous reactors,28 electrode material9 and biomass retention11) will play a role and hamper a systematic comparison (Table 1).
3.2 Yield and electron balances
Considering that all electrons of the complete oxidation of the substrate (corn silage) would be used for methane formation 337 mL godm−1 can be expected (see 2.8). For standard AD conditions (setting I) an average methane production of 325 mL godm−1, representing a methane yield (YCH4) of 96%, and thus an eAD overall performance efficiency of 96%, was found, being in good accordance with literature.21 For biomass growth conditions (setting II), however, the total methane production was independent of the reactor type (on average 216 mL godm−1), equaling a YCH4 of 64%. It can be assumed that for biomass growth conditions, provided by setting II, a higher amount of carbon from the substrate was stored in biomass instead of being converted to methane which is causing the lower methane yield in comparison to setting I.
Most interestingly, whereas for standard AD (setting I) conditions the electric current production was negligible, for growth conditions (setting II) the electric current production had a significant contribution to the eAD yield independent of the applied working electrode potential. In detail, the total charge transfer, q, per batch in setting II was higher for the SC reactors (qSC−0.2 V = 14.4 (±0.8) kC, qSC+0.2 V = 11.3 (±0.8) kC) than for the DC reactors (qDC−0.2 V = 5.3 (±1.2) kC, qDC+0.2 V = 4.9 (±2.2) kC) meaning that a higher share of available electrons was transferred to the electrode, leading to coulombic efficiencies of CESC−0.2 V = 56.5 (±3.1)%, CESC+0.2 V = 44.3 (±3.0)%, CEDC−0.2 V = 20.8 (±4.6)%, CEDC+0.2 V = 19.2 (±8.6)%. Consequently, the overall eAD yield, calculated by summing up the YCH4 and CE for each setup, shows that the eAD yield was clearly higher (SC−0.2 V (123%), SC+0.2 V (118%), DC−0.2 V (82%), DC+0.2 V (81%)) than the anaerobic digestion process alone (OCP, 64% setting II). For the latter the productivity is restricted to methane production and no additional value can be obtained. On the first sight the yield of the SC reactors exceeded 100%. This can be explained by the unshielded counter electrode, serving as cathode to the microbiome, in the SC setups in contrast to the DC setups. The electrons that contributed to the increased coulombic efficiency are reintroduced into the reactor and can be “recycled” by the microorganisms for methane production (details Section 3.3). Thus, a yield exceeding 100% is certainly a mathematical artifact, owing to the underlying concept (see 2.8). However, as discussed below this pathway may provide an opportunity for process management. The methane productivity of the DC reactors was below the SC reactors. One reason for that could be a reduced microbial activity in the DC reactors, due to lower pH, caused by the volatile fatty acid production resulting also in lower peak currents. In addition, SC reactors showed biofilm formation at the cathode, which cannot take place in the DC reactors. The cathode biofilm consisted of hydrogenotrophic methanogenic archaea that obviously contributed to the methane production. This formation of an alternative loop for substrate utilization will be further discussed in the Section 3.3 Microbiome structure and composition.
3.3 Microbiome structure and composition
To analyze the microbiome structure and function, the microbial communities of the reactors were sampled regularly (i.e. simultaneously with the process parameters) and the electrode biofilms at the end of each experiment.
3.3.1 Reactor community. The community structure was monitored over time using flow cytometry (FCM). In general, flow cytometry revealed a diverse microbial community being typical for AD reactors15 (exemplary cytometric fingerprint ESI Fig. S5†). The microbial seeding community (inoculum) was found to differ from all other samples in setting II and III regarding its cytometric fingerprint, i.e. community structure, as well as number of stainable cells. This is in line with expectations, as the microbial communities started immediately to utilize the substrate and its degradation products. As a result, general growth (higher number of stainable cells) but also a shift of the microbiome to its new habitat and the provided substrate was reflected in the community structure. In setting I after an initial community shift the community structure was found stable for all reactor setups in accordance with the main methane and VFA production as well as their utilization in the first few days. In contrast, the microbial communities in settings II and III were performed under microbial growth conditions (5% seeding sludge) thus showing stronger structural variation over the complete course of the experiment (Fig. 4A). Importantly, the variation over time was similar for all reactors and respective triplicates of setting II (Fig. 4A). This indicates that most organisms in the microbial community, in the setup under study, were not immediately affected by the applied electrochemical conditions or the additional substrate utilization by the electrode associated communities (see below).
 |
| Fig. 4 Microbial community analysis: (A) time resolved analysis of the microbial community in setting II: the microbial community structure of the reactor communities was monitored with flow cytometry, the derived results were arranged regarding their similarity (non-metric multidimensional scaling, NMDS) for SC−0.2 V, SC+0.2 V, DC−0.2 V, DC−0.2 V and AD control (OCP) setup. The reactor communities were analysed at respective days (black solid line) and each triplicate reactor setup is indicated with grey lines. The anode biofilms were very different from the reactor community (ESI Fig S5†) and, therefore, not included in the plot. (B) At the end point of the experiments (day 20) the microbial community composition was determined with T-RFLP for the bacterial reactor community and the biofilms at the working electrodes. | |
In addition to the time resolved monitoring the bacterial community composition was determined at the end point of the experiments (setting II and III) using T-RFLP and analysis of a clone library. The reactor microbiome was found to be a typical diverse anaerobic digestion community with Firmicutes contributing as the major bacterial phylum accompanied by Bacteroidetes, Proteobacteria, and Synergistetes (Fig. 4B and details in ESI Results†). The T-RFLP analysis confirmed that the reactor communities differed from the seeding community. The reactor communities themselves were similar towards presence of T-RFs but differed in the individual T-RF's contribution in the different samples (Fig. 4B and ESI Results†). Grouping T-RFs based on the eAD setups allowed a certain differentiation, but the differences were relatively small and mostly not significant (ESI Fig. S6†). The methanogenic archaea in the reactor community were also investigated with T-RFLP at the end point of the experiments (setting II and III, details ESI Fig. S7†). The highest abundance showed Methanosarcina, a mixotrophic genus, while all other found groups (Methanoculleus spp. and three groups of Methanobacterium spp.) are hydrogenotrophic. Therefore, acetate and hydrogen were probably both used as substrates for the methanogenic archaea in the reactor community.
3.3.2 Electrode associated communities. The biofilms were sampled at the end of the experiments and no biomass was found on the counter electrodes (cathodes) of the DC setups and a very thin biofilm was present at some working electrodes (anodes) of the AD control reactors (these were operated at OCP, but we assume that these are mainly formed due to the presence of an electrode potential during daily CV measurements). In contrast to the working electrodes in setting I, which showed only a small amount of adherent biomass from the reactor community, there was a thick biofilm formed on the working electrodes of the SC−0.2 V, SC+0.2 V, DC−0.2 V and DC+0.2 V setups for setting II. Similar to the description in ref. 29 two different biofilm layers were found: a reddish biofilm layer closer to the electrode surface and covered by a darker brownish one (ESI Fig. S5†).FCM revealed that the microbial community structure was very similar for all working electrodes in setting II (independent of the applied potential +0.2 V or −0.2 V) and differed clearly from the reactor community (ESI Fig. S5†). The biofilms were dominated by one phylotype, which can be derived from the characteristic cell cycle related distribution in the cytometric histograms.14 DNA based analyses supported these results, as dominance of a single T-RF (240 bp) with a contribution of 83 to 95% of the total T-RF area was found. Sequencing assigned this T-RF to a Geobacter spp. and BLAST search (15/01/27) revealed highest similarity (99% identity with 100% query coverage) with the GenBank entry NR_126282.1, a novel isolate Geobacter anodereducens strain SD-1.30 For Geobacter sulfurreducens strain PCA (NCBI Reference Sequence: NR_075009.1) the identity was 97%. This finding is in accordance with many previous studies that also found a strong anodic enrichment of Geobacter spp. using similar electrode potentials.31,32
The counter electrodes, i.e. cathodes, operated at −1.4 V vs. Ag/AgCl maximum negative voltage, in the SC reactors were also covered by a biofilm at the end of the experiment. Flow cytometric analysis showed that the microbial community structure was clearly different from the anode biofilms as well as from the reactor community. DNA analysis revealed that the cathode biofilm was dominated by one group of Methanobacterium spp. and fluorescence microscopy showed a biofilm consisting of bright autofluorescent cells, which is typical for methanogenic archaea (ESI Fig. S8†). We therefore conclude that a specific enrichment of archaea on the counter electrode took place (see also discussion below). They are supposed to either use hydrogen produced at the cathode or directly take up electrons by extracellular electron transfer.2,33–35
3.4 Increasing the overall performance by division of labour in the reactor microbiome
It was shown, for conditions allowing microbiome adaptation to new substrates (setting II) that the methane production remains constant for eAD setup and AD setup, but in addition the electron yield of the eAD setup could be utilized for electric energy generation. This increased turnover of substrate into useful products was achieved with an overall eAD yield of 123% in the SC setup and 82% for the DC setup. It has to be stressed that the electric current in the DC setup, equaling the anode compartment of a MFC with an oxygen reduction cathode, is directly exploitable. For the SC setup, being related to a microbial electrolysis cell, additional energy input is necessary, but this approach does allow a better steering of the processes and energy fluxes. Independent from the electric current production, the microbial community structure and composition in the reactor liquid remained unaffected. Thus, the generation of the second product, electrons, can only be explained by the formation of a functional anodic biofilm at the working electrodes (both SC and DC setup) and a cathodic biofilm at the counter electrode for SC setups leading to a functional and spatial division of labour in the microbiome. The overall concept is depicted in Fig. 5. The substrate is not only utilized regarding carbon (which can also be stored as biomass and thus is not converted to a chemical product) but also regarding the electrons for anode respiration. Whereas in AD reactors only the methane production process in the bulk liquid takes place, additional microbial transformations can take place at the electrode(s) for eAD reactors utilizing excess substrates or substrates unsuitable for the methanogenic community without affecting the methane production. In the DC setup the functional contribution is restricted to the working electrode biofilm performing anode respiration and current production as the counter electrode is shielded from the reactor community. In the SC reactors, showing best overall yield, extensive biofilms were found at working and counter electrodes. This finding suggests the formation of an alternative loop for metabolite utilization (Fig. 5) allowing the additional valorisation pathway of acetate conversion to electrons, CO2 and protons on the anode (working electrode) and methane production from electrons, protons and CO2 on the cathode (counter electrode) as follows:
 |
| Fig. 5 Division of labour in the eAD reactor microbiome: Overview on anaerobic digestion pathways and involvement of electrode biofilms in single-chamber setup: Primary and secondary fermentation of the substrate by bacteria leads to the formation of the key intermediates acetate, H2 and C1-compounds (for better readability referred to by CO2 as major compound). They are further utilized by methanogenic archaea to yield CH4 and CO2. In addition to methane formation in the bulk liquid further reactions can take place at the electrode surfaces. Anodic biofilms utilize key intermediates (e.g. acetate) and further biogenic methane production at the cathode is possible. (Chemical compounds and intermediates that were measured are highlighted in blue.) | |
At the anode the Geobacteraceae dominated biofilm utilizes (excess) acetate, accumulating in the reactor liquid, for current production while competing with syntrophic acetate oxidizing bacteria and acetotrophic methanogens of the reactor community. As only a low number of other species was found in the anode biofilm little, if any, utilization of other substrates is expected as long as acetate is available. Noteworthy, the acetate oxidation at the anode does not hamper the functional groups in the reactor liquid under the applied conditions. Further investigations with more sophisticated methods like carbon tracer experiments could help to quantify the differential metabolic contribution of the subcommunities under varying conditions. In the SC reactors, where the microbiome faces both electrodes, protons and CO2 can additionally be utilized by the cathodic biofilm of hydrogenotrophic methanogenic archaea at the counter electrodes. The formation of methanogenic biofilms on biocathodes was reported before.35–37 In these studies also Methanobacterium spp. (Methanobacterium palustre and Methanobacterium aarhusense) and Methanococcus maripaludis were the major involved organisms. The presence of two functionally distinct biofilms at anode and cathode did not significantly affect the microbial community structure of the reactor community and its development over time (for the used electrode surface to reactor volume ratio). On DNA level, only the contribution of hydrogenotrophic archaea to the reactor community was higher in the SC reactors compared to DC and AD control.
The data strongly suggests the presence of an alternative anode-based loop for acetate utilization that does not interfere with the reactor community, but has the potential to yield electric energy as additional product. The reaction of the cathode biofilm (in the SC-setup) may additionally contribute to the methane production. Furthermore, the anodic oxidation may also buffer against acidification (accumulation of acetate, pH decrease) in the reactor. This is in line with the finding of ref. 11 that colonized electrodes can have a stabilizing effect for the anaerobic digestion process although these authors conclude biomass retention being the key-effect, whereas here the specific functional enrichment is sought to account for it. The advantage of an alternative loop for substrate utilization may also apply to biogas processes that suffer inhibition due to e.g. high ammonium loadings.38,39 Here the spatial and functional labour division can support a more flexible process. So far, the principle of spatial and functional labour division was only demonstrated using batch experiments. But the development of similar interactions is supposed to remain also in a continuous process including system scale up.
4 Conclusions
We have investigated the combination of anaerobic digestion and microbial electrochemical technologies and found that this strategy allowed an up to 27% increase in total yield. This is achieved by the functional contribution of electroactive biofilms at the electrodes showing specific enrichments, while the reactor community kept its composition and functionality. The general concept can be transferred to related MET processes for increasing substrate utilization efficiencies, side product valorization and process stabilisation and, therewith, lead to a sustainable production of energy and commodities.
Acknowledgements
We thank Franciska Hedrich for very valuable technical assistance in molecular biology analysis and Birke Brumme for GC measurements. F.H. acknowledges support by the BMBF (Research Award “Next generation biotechnological processes – Biotechnology 2020+”) and the Helmholtz-Association (Young Investigators Group). S.M. acknowledges support by the European Fond for Regional Development (EFRE) and Sächsische AufbauBank (SAB). This work was supported by the Helmholtz Association within the Research Programme Renewable Energies.
References
- M. Scheftelowitz, D. Thrän, C. Hennig, A. Krautz, V. Lenz, J. Liebetrau, J. Daniel-Gromke, V. Denysenko, K. Hillebrand, K. Naumann, N. Rensberg and W. Stinner, DBFZ Report Nr. 21 - Entwicklung der Förderung der Stromerzeugung aus Biomasse, im Rahmen des EEG, DBFZ Deutsches Biomasseforschungszentrum gemeinnützige GmbH, Prof. Dr. mont. Michael Nelles (Hg.), Leipzig, 2014, https://www.dbfz.de/fileadmin/user_upload/DBFZ_Reports/DBFZ_Report21.pdf Search PubMed.
- D. J. Batstone and B. Virdis, Curr. Opin. Biotechnol., 2014, 27, 142–149 CrossRef CAS PubMed.
- B. Demirel and P. Scherer, Rev. Environ. Sci. Biotechnol., 2008, 7, 173–190 CrossRef CAS.
- U. Schröder, F. Harnisch and L. T. Angenent, Energy Environ. Sci., 2015, 8, 513–519 Search PubMed.
- D. R. Lovley, Nat. Rev. Microbiol., 2006, 4, 497–508 CrossRef CAS PubMed.
- K. Rabaey, J. Rodriguez, L. L. Blackall, J. Keller, P. Gross, D. Batstone, W. Verstraete and K. H. Nealson, ISME J., 2007, 1, 9–18 CrossRef CAS PubMed.
- B. E. Logan, B. Hamelers, R. Rozendal, U. Schröder, J. Keller, S. Freguia, P. Aelterman, W. Verstraete and K. Rabaey, Environ. Sci. Technol., 2006, 40, 5181–5192 CrossRef CAS.
- M. A. Rosenbaum, H. Y. Bar, Q. K. Beg, D. Segrè, J. Booth, M. A. Cotta and L. T. Angenent, Bioresour. Technol., 2011, 102, 2623–2628 CrossRef CAS PubMed.
- B. Tartakovsky, P. Mehta, J. S. Bourque and S. R. Guiot, Bioresour. Technol., 2011, 102, 5685–5691 CrossRef CAS PubMed.
- C. Zamalloa, J. B. A. Arends, N. Boon and W. Verstraete, New Biotechnol., 2013, 30, 573–580 CrossRef CAS PubMed.
- J. De Vrieze, S. Gildemyn, J. B. A. Arends, I. Vanwonterghem, K. Verbeken, N. Boon, W. Verstraete, G. W. Tyson, T. Hennebel and K. Rabaey, Water Res., 2014, 54, 211–221 CrossRef CAS PubMed.
- M. Badshah, D. M. Lam, J. Liu and B. Mattiasson, Bioresour. Technol., 2012, 114, 262–269 CrossRef CAS PubMed.
- S. Chen, G. He, Q. Liu, F. Harnisch, Y. Zhou, Y. Chen, M. Hanif, S. Wang, X. Peng, H. Hou and U. Schroder, Energy Environ. Sci., 2012, 5, 9769–9772 CAS.
- F. Harnisch, C. Koch, S. A. Patil, T. Hübschmann, S. Müller and U. Schröder, Energy Environ. Sci., 2011, 4, 1265–1267 CAS.
- C. Koch, I. Fetzer, T. Schmidt, H. Harms and S. Müller, Environ. Sci. Technol., 2013, 47, 1753–1760 CAS.
- C. Koch, S. Günther, A. F. Desta, T. Hübschmann and S. Müller, Nat. Protoc., 2013, 8, 190–202 CrossRef CAS PubMed.
- D. Lane, in Nucleic acid techniques in bacterial systematics, ed. E. Stackbrandt and M. Goodfellow, John Wiley & Sons, Chichester, 1991, pp. 115–175 Search PubMed.
- L. M. Steinberg and J. M. Regan, Appl. Environ. Microbiol., 2008, 74, 6663–6671 CrossRef CAS PubMed.
- F. Weissbach, Landtechnik, 2008, 63, 356–358 Search PubMed.
- A. M. Buswell and H. F. Mueller, Ind. Eng. Chem., 1952, 44, 550–551 CrossRef CAS.
- Fachagentur Nachwachsende Rohstoffe e. V. (FNR), Guide to Biogas. From production to use, Gülzow, 2010.
- R. A. Rozendal, H. V. M. Hamelers and C. J. N. Buisman, Environ. Sci. Technol., 2006, 40, 5206–5211 CrossRef CAS.
- F. Harnisch, U. Schröder and F. Scholz, Environ. Sci. Technol., 2008, 42, 1740–1746 CrossRef CAS.
- P. Weiland, Appl. Microbiol. Biotechnol., 2010, 85, 849–860 CrossRef CAS PubMed.
- B. Tartakovsky, P. Mehta, G. Santoyo, C. Roy, J.-C. Frigon and S. R. Guiot, J. Chem. Technol. Biotechnol., 2014, 89, 1501–1506 CrossRef CAS.
- K. Sasaki, D. Sasaki, M. Morita, S.-I. Hirano, N. Matsumoto, N. Ohmura and Y. Igarashi, Bioresour. Technol., 2010, 101, 3415–3422 CrossRef CAS PubMed.
- E. Tamburini, T. Bernardi, G. Castaldelli, G. Tumiatti and S. Ferro, Energy Environ. Sci., 2011, 4, 551–557 CAS.
- J. Zhang, Y. Zhang and X. Quan, Water Res., 2012, 46, 3535–3543 CrossRef CAS PubMed.
- N. S. Malvankar, J. Lau, K. P. Nevin, A. E. Franks, M. T. Tuominen and D. R. Lovley, Appl. Environ. Microbiol., 2012, 78, 5967–5971 CrossRef CAS PubMed.
- D. Sun, A. Wang, S. Cheng, M. D. Yates and B. Logan, Int. J. Syst. Evol. Microbiol., 2014, 64, 3485–3491 CrossRef PubMed.
- K. Fricke, F. Harnisch and U. Schröder, Energy Environ. Sci., 2008, 1, 144 CAS.
- C. I. Torres, A. K. Marcus, H.-S. Lee, P. Parameswaran, R. Krajmalnik-Brown and B. E. Rittmann, FEMS Microbiol. Rev., 2010, 34, 3–17 CrossRef CAS PubMed.
- D. R. Lovley and K. P. Nevin, Curr. Opin. Biotechnol., 2013, 24, 385–390 CrossRef CAS PubMed.
- P. G. Dennis, F. Harnisch, Y. K. Yeoh, G. W. Tyson and K. Rabaey, Appl. Environ. Microbiol., 2013, 79, 4008–4014 CrossRef CAS PubMed.
- S. Cheng, D. Xing, D. F. Call and B. E. Logan, Environ. Sci. Technol., 2009, 43, 3953–3958 CrossRef CAS.
- M. C. A. A. Van Eerten-Jansen, A. B. Veldhoen, C. M. Plugge, A. J. M. Stams, C. J. N. Buisman and A. Ter Heijne, Archaea, 2013, 2013, 12 CrossRef PubMed.
- S. T. Lohner, J. S. Deutzmann, B. E. Logan, J. Leigh and A. M. Spormann, ISME J., 2014, 8, 1673–1681 CrossRef CAS PubMed.
- J. Desloover, A. Abate Woldeyohannis, W. Verstraete, N. Boon and K. Rabaey, Environ. Sci. Technol., 2012, 46, 12209–12216 CrossRef CAS PubMed.
- Y. Zhang and I. Angelidaki, Biotechnol. Bioeng., 2015 DOI:10.1002/bit.25549.
Footnote |
† Electronic supplementary information (ESI) available. See DOI: 10.1039/c5ra03496e |
|
This journal is © The Royal Society of Chemistry 2015 |
Click here to see how this site uses Cookies. View our privacy policy here.