Simultaneous ultrasonic-assisted removal of malachite green and safranin O by copper nanowires loaded on activated carbon: central composite design optimization

Mostafa Roosta*, Mehrorang Ghaedi and Arash Asfaram
Chemistry Department, Yasouj University, Yasouj 75918-74831, Iran. E-mail: mostafaroosta.mr@gmail.com; Fax: +98 741 2223048; Tel: +98 741 2223048

Received 27th February 2015 , Accepted 23rd June 2015

First published on 23rd June 2015


Abstract

The present study investigates the simultaneous ultrasound-assisted adsorption of malachite green (MG) and safranin O (SO) dyes from aqueous solutions by ultrasound-assisted adsorption onto copper nanowires loaded on activated carbon (Cu-NWs-AC). In this study a novel and green approach is described for the synthesis of Cu nanowires. This novel material was characterized using different techniques such as FESEM, XRD, EDS, and UV-vis. The effects of variables such as sonication time, pH, adsorbent dosage, and initial dye concentrations on simultaneous dye removals were studied and optimized by a central composite design (CCD) combined with a desirability function (DF). A good agreement between experimental and predicted data using an optimal model in this study was observed. These results indicated that when a small amount of proposed adsorbent (0.022 g) was applied, it resulted in simultaneous removal of 15 mg L−1 of malachite green and 15 mg L−1 of safranin O (>99%) in a short time (6.0 min) at a pH of 5.5.

1. Introduction

Dyes are extensively used in textiles, dyeing, electroplating, printing, tanneries, and related industries and their discharges into wastewaters generate contaminated environments.1–3 Therefore, removal of dyes from industrial effluents are challenging requirements and, when they are successfully removed, help to produce safe and clean media. MG is used with silk, wool, cotton, leather, and paper (Fig. 1a) plus it is also employed as a therapeutic agent to treat parasites, fungal, and bacterial infections.4,5 SO (Fig. 1b) is used as a biological stain, in histology and cytology, and for detection of cartilage and mast cell granules.6 Extensive usage of adsorption for wastewater treatment is related to properties such as high efficiency, capacity, and large scale ability of re-generable adsorbents.7–10 Nanometer sized adsorbents with special physical and chemical properties (for example, presence of various surface reactive sites and a high surface to volume ratio) attain much focus and applicability in adsorption and separation sciences.11–14 Activated carbon (AC) due to distinguished remarks, viz. low cost and porous structure, is a good and re-usable support for loading nanomaterials. AC simultaneously leads to an increase in numbers and types of reactive centers and increases life time of adsorbents, while simultaneously reducing toxicity and facilitating phase separation.4,15–17 Synthesized and characterized Cu-NWs-AC was applied for simultaneous removal of MG and SO, while adsorption rate was accelerated via ultrasonic power. Determination of non-adsorbed dyes using simple and cost-effective methods was done by UV-vis detection.
image file: c5ra03519h-f1.tif
Fig. 1 (a) Chemical structures of malachite green and (b) safranin O.

Sonochemistry has received considerable interest over the past few decades due to its ability to cause acoustic cavitation leading to formation, growth, and collapse of micrometrical bubbles from propagation of a pressure wave through a liquid. Ultrasound has proven to be a very useful tool for enhancing mass transfer rates in sorption processes and increased/facilitated pore diffusion and breaking the affinity between adsorbate and adsorbent.18–20 Combining ultrasound with the adsorption process was found to be very promising for the removal of pollutants like dyes and metal ions.21–24 The use of ultrasound for degrading dyes has been reported in recent decades.25–28 Ultrasound events such as micro-streaming, micro-turbulence, acoustic (or shock) waves, and microjets possibly enhance performance of an adsorption/desorption system.19,27,29–32 Shock waves have the potential of creating microscopic turbulence within interfacial films surrounding nearby solid particles. Acoustic streaming induced by the sonic wave is the movement of the liquid, which means conversion of sound to the kinetic energy.

Designing and optimizing experiments, and evaluations of the influence of experimental variables, are best achieved with simultaneous optimization to estimate the presence and magnitude of their interactions. Statistical designs of experiments are possible for such a purpose by a number of experiments.33,34 Response surface methodology (RSM) is a good and appropriate tool for designing experiments, constructing models, evaluating the effects of multiple factors, and investigating optimum conditions.35 RSM combined with CCD and DF makes it possible to investigate full details of the influence of variables such as sonication time, pH, initial MG and SO concentrations, and adsorbent dosage.

2. Experimental

2.1. Instruments and reagents

An ultrasonic bath with a heating system (Tecno-GAZ SPA Ultra Sonic System, Bologna, Italy) at 40 kHz of frequency and 130 W of power was used for the ultrasound-assisted adsorption procedure. The pH measurements were carried out using a digital pH meter (Ino Lab pH 730, Germany) and the dye concentrations were determined using a Jasco UV-vis spectrophotometer model V-530 (Jasco, Japan) at a wavelength of 619 and 521 nm respectively for MG and SO.

The atomic composition of the Cu-NWs-AC was analyzed by an energy-dispersive X-ray spectrometer (EDX) using an Oxford INCA II energy solid state detector. The X-ray diffraction (XRD) pattern was recorded by an automated Philips X'Pert X-ray diffractometer (Philips Analytical X-ray, Netherlands) with Co Kα radiation (40 kV and 30 mA) for 2θ values over 10–100°. For XRD analyses, solid samples of the Cu NWs were separated from the aqueous suspension by centrifugation at 4000 rpm with a dilute hydrazine solution and then nitrogen gas was gently blown into it to dry the sample. The shape and surface morphology of the Cu NWs were investigated by a field emission scanning electron microscope (FE-SEM, Hitachi S4160, Tokyo, Japan) under an acceleration voltage of 15 kV.

Absorption measurements of nanoparticles were carried out on a Perkin-Elmer Lambda 25 spectrophotometer (Massachusetts, USA) using a quartz cell with an optical path of 1 cm. The stock solutions (200 mg L−1) of MG and/or SO were prepared by dissolving 20 mg of each solid dye in 100 mL double distilled water and the working concentrations daily were prepared for their suitable dilution. All chemicals, including NaOH and HCl with the highest purity available, were purchased from Merck (Darmstadt, Germany).

2.2. Ultrasound assisted adsorption method

The ultrasound assisted adsorption method was carried out in a batch mode as follows: 50 mL of 15 mg L−1 of MG and SO at pH of 5.5 was mixed with 0.022 g of Cu-NWs-AC that dispersed thoroughly during a sonication time of 6.0 min at room temperature. At each stage, the sample was immediately centrifuged and analyzed by UV-vis spectrophotometry at maximum wavelength over working concentrations. The efficiency of dye removal was determined in different experimental conditions according to a CCD method. The dye removal percentages were calculated using the following equation:
 
% dye removal = ((C0Ct)/C0) × 100 (1)
where C0 (mg L−1) and Ct (mg L−1) is the concentration of target at initial time and after time t respectively.

2.3. Preparation of carbon-supported Cu nanowires (Cu-NWs-AC)

The Cu-NW was prepared as follows: 150 mL of NaOH solution (7 mol L−1) and 7.5 mL of copper nitrate (0.1 mol L−1; aqueous solution) were added to a 250 mL glass reactor. Then, 1.95 mL of ethylenediamine (99%) and 0.75 mL of hydrazine solution (2.8 mol L−1) were added and mixed thoroughly. Holding this mixture in a bath at 60 °C for 45 min caused the royal blue solution to change to bronze after 38 min (formation of the Cu nanowires). Then, 150 mL of the freshly prepared Cu NWs solution was added to activated carbon (30 g) in a 250 mL flask with magnetic stirring for up to 4 h leading to the formation of Cu-NWs-AC which was generally dried at 110 °C for 12 h.36 A mortar was used to homogeneously grind the carbon-supported Cu NWs powder. The Cu-NWs-AC was stored in air at room temperature.

2.4. Central composite design

The CCD (five-level with α value fixed at 2.0, rotatable) was designed by using the program STATISTICA 7 based on 32 runs. This was used to investigate the effects of sonication time, pH, amount of adsorbent, MG concentration and SO concentration (Table 1). The center points were used to determine experimental error and reproducibility of the data. Table 2 shows that the experimental design points consist of 2n factorial points with 2n axial points, Nc central points, and the test results for the response variables. The independent variables were coded to the (−1, +1) interval where the low and high levels were coded as −1 and +1, respectively. The axial points are located at a distance of α from the center and make the design rotatable.
Table 1 Experimental factors and levels in the central composite design
Factors Levels Star point α = 2.0
Low (−1) Central (0) High (+1) α +α
(X1) Sonication time (min) 2.0 3.5 5.0 0.5 6.5
(X2) pH 3.0 5.0 7.0 1.0 9.0
(X3) Adsorbent dosage (g) 0.009 0.015 0.021 0.003 0.027
(X4) MG concentration (mg L−1) 10 15 20 5 25
(X5) SO concentration (mg L−1) 10 15 20 5 25


Table 2 Experimental conditions and values obtained through the CCD
Runs X1 X2 X3 X4 X5 MG removal (%) SO removal (%)
1 2 3 0.009 10 20 22.11 24.24
2 2 3 0.009 20 10 20.37 24.24
3 2 3 0.021 10 10 85.53 89.29
4 2 3 0.021 20 20 46.51 61.28
5 2 7 0.009 10 10 57.16 31.548
6 2 7 0.009 20 20 47.12 21.188
7 2 7 0.021 10 20 74.87 59.43
8 2 7 0.021 20 10 55.40 44.17
9 5 3 0.009 10 10 50.75 53.39
10 5 3 0.009 20 20 36.97 39.51
11 5 3 0.021 10 20 91.11 90.42
12 5 3 0.021 20 10 91.75 91.70
13 5 7 0.009 10 20 76.15 52.80
14 5 7 0.009 20 10 79.84 58.47
15 5 7 0.021 10 10 99.20 97.93
16 5 7 0.021 20 20 86.30 74.86
17 (C) 3.5 5 0.015 15 15 66.68 61.98
18 (C) 3.5 5 0.015 15 15 77.23 72.51
19 (C) 3.5 5 0.015 15 15 67.97 63.77
20 0.5 5 0.015 15 15 43.60 41.84
21 6.5 5 0.015 15 15 83.68 74.23
22 3.5 1 0.015 15 15 48.16 78.50
23 3.5 9 0.015 15 15 72.31 56.62
24 3.5 5 0.003 15 15 21.92 16.91
25 3.5 5 0.027 15 15 90.19 90.00
26 3.5 5 0.015 5 15 84.55 78.48
27 3.5 5 0.015 25 15 63.39 59.46
28 3.5 5 0.015 15 5 87.40 84.74
29 3.5 5 0.015 15 25 61.59 55.28
30 (C) 3.5 5 0.015 15 15 72.12 66.51
31 (C) 3.5 5 0.015 15 15 74.72 67.98
32 (C) 3.5 5 0.015 15 15 72.49 68.48


The mathematical relationship between the five independent variables can be approximated by the second order polynomial model:37,38

 
image file: c5ra03519h-t1.tif(2)
where y is the predicted response (removal percentage); xi's are the independent variables (sonication time, pH, amount of adsorbent, MG concentration and SO concentration) that are known for each experimental run. The parameter β0 is the model constant; βi is the linear coefficient; βii are the quadratic coefficients and βij are the cross-product coefficients.

2.5. Desirability function

A desirability function (DF) is an established technique based on Derringer's desirability function.39 Each predicted response Ûi and experimental response Ui can be transformed to create a function for each individual response di and finally determine a global function D that should be maximized following selection of an optimum value of affective variables by considering their interactions. First, the response (U) is converted into a particular desirability function (dfi) in the range of 0 to 1. The di = 0 represents a completely undesirable response or minimum applicability and di = 1 represents a completely desirable or ideal response. The individual desirability scores dis are then combined using geometrical mean, for a single overall (global) desirability D, which is optimized to find the optimum set of input variables:
 
image file: c5ra03519h-t2.tif(3)

image file: c5ra03519h-t3.tif
where dfi indicate the desirability of the response Ui (i = 1, 2, 3, …, n) and vi represents the importance of responses.

The individual desirability function for the ith characteristic is computed via the following equation where α and β are the lowest and highest obtained values of the response i and wi is the weight:

 
image file: c5ra03519h-t4.tif(4)

3. Results and discussion

3.1. Characterization of adsorbent

Hydrazine acts as a reducing agent for transformation of Cu2+ ions into Cu0 and the reaction was accelerated and catalyzed by a large amount of NaOH aqueous solution. The extent of the reaction was followed using visual and spectrophotometric studies. The Cu NWs, similar to other zero-valence elements, have a distinguishing and sensitive absorption peak corresponding to Surface Plasmon Resonance (SPR)40 (Fig. 2a). The peak has a maximum wavelength of about 575 nm and supports the narrow size distribution of the Cu NWs. It also has good correlation with sizes of nano-structures that shift to shorter wavelengths with decreasing sizes of the nanowires (quantum confinement).36,41
image file: c5ra03519h-f2.tif
Fig. 2 (a) UV-vis absorption spectrum of the Cu nanowires and (b) X-ray diffraction (XRD) pattern of the Cu nanowires loaded on activated carbon.

The X-ray diffraction (XRD) pattern of Cu NWs powder (Fig. 1b) has good agreement with the standard copper XRD pattern (Joint Committee for Powder Diffraction Standards, JCPDS, no. 65-9743; bottom of Fig. 2b). It exhibited three major diffraction peaks related to the diffraction angles at around 44.16°, 51.60°, 73.81° and 89.32° related to the planes (111), (200), (220) and (311) and proved the face-centered cubic lattice structure of copper NWs.42,43 No diffraction peaks corresponding to CuO or Cu2O in the XRD pattern were found. The average nanocrystallites size (D), estimated according to the Debye–Scherrer eqn based on K of 0.9 and X-ray wavelength λ (1.78897 Å) and belonging to the most intense peak (111), was estimated to be about 75 nm:44

 
image file: c5ra03519h-t5.tif(5)

The FESEM images of the activated carbon surface and the Cu NWs deposited on activated carbon are shown in Fig. 3a and b. It can be seen that the surface morphology of the activated carbon is homogeneous and relatively smooth. Fig. 3b shows the detailed morphologies of the Cu NWs deposited on the activated carbon which are composed of a large quantity of well-dispersed Cu NWs. The average diameter of the Cu NWs is ∼81 nm as calculated from 20 nanowires randomly selected from the SEM image. The lengths of the nanowires vary from tens to hundreds of micrometers.


image file: c5ra03519h-f3.tif
Fig. 3 FESEM images of (a) the activated carbon and (b) the Cu nanowires deposited on activated carbon.

In order to further confirm the composition on the surface of copper nanowires loaded on activated carbon, energy-dispersive spectra (EDS) from different sample spots were obtained. The EDS spectra of Cu-NWs-AC and the quantitative elemental composition are shown in Fig. 4.


image file: c5ra03519h-f4.tif
Fig. 4 (a) EDS mapping and (b) EDS analysis of the Cu-NWs-AC adsorbent.

The EDS mapping of the Cu-NWs-AC is presented in Fig. 4a and was obtained in order to investigate their localized elemental information. It is worth noting that the element Cu was well dispersed on the surface of Cu-NWs-AC.

Fig. 4a and b confirmed the presence of C and Cu in Cu-NWs-AC. The C signal originated from the activated carbon while the Cu signal came from the Cu-NWs nanoparticles; this confirms the existence of Cu-NWs and is consistent with the results of XRD and SEM.

3.2. Central composite design (CCD)

CCD design and its further analysis (Tables 1 and 2) for the following variables (sonication time (X1), pH (X2), adsorbent dosage (X3), MG concentration (X4), and SO concentration (X5)) according to the prescribed above conditions (32 experiments) were undertaken. To find the most important effects and interactions, analysis of variance (ANOVA) was calculated using STATISTICA 7.0 (Table 3). A p-value less than 0.05 in the ANOVA table indicates the statistical significance of an effect at a 95% confidence level. The F-test was used to estimate the statistical significance of all terms in the polynomial equation within a 95% confidence interval. Data analysis gave a semi-empirical expression of removal percentage with the following equation:
 
y = 71.93 + 11.79x1 + 7.46x2 + 15.69x3 − 5.62x4 − 4.60x5 − 2.11x12 − 2.96x22 − 4.01x32 + 2.99x1x4 − 8.07x2x3 + 2.78x2x5 − 3.05x3x4 (6)
Table 3 Analysis of variance (ANOVA) for CCD
Source of variation Sum of square Degree of freedom Mean square F-value P-value
X1 3340.95 1 3340.953 209.9830 0.000028
X12 131.13 1 131.126 8.2415 0.034962
X2 1338.46 1 1338.461 84.1239 0.000258
X22 257.94 1 257.936 16.2116 0.010057
X3 5914.91 1 5914.912 371.7594 0.000007
X32 471.73 1 471.732 29.6489 0.002837
X4 758.55 1 758.551 47.6759 0.000976
X42 6.43 1 6.430 0.4042 0.552902
X5 508.48 1 508.479 31.9585 0.002406
X52 10.58 1 10.584 0.6652 0.451803
X1X2 7.40 1 7.399 0.4650 0.525584
X1X3 5.17 1 5.171 0.3250 0.593292
X1X4 143.49 1 143.487 9.0183 0.029994
X1X5 0.62 1 0.621 0.0390 0.851159
X2X3 1043.42 1 1043.417 65.5800 0.000465
X2X4 14.36 1 14.360 0.9026 0.385725
X2X5 123.96 1 123.961 7.7911 0.038388
X3X4 149.26 1 149.257 9.3810 0.028011
X3X5 3.35 1 3.347 0.2103 0.665746
X4X5 0.27 1 0.268 0.0169 0.901725
Lack of fit 127.93 6 21.322 1.3401 0.382742
Pure error 79.55 5 15.911    
Total SS 14[thin space (1/6-em)]389.07 31      


The plot of experimental values of removal (%) values versus those calculated from the equation indicated a good fit, as presented in Fig. 5.


image file: c5ra03519h-f5.tif
Fig. 5 The experimental data versus the predicted data of normalized removal of MG.

3.3. Response surface methodology

Response surface methodology (RSM) was developed by considering all the significant interactions in the CCD to optimize the critical factors and describe the nature of the response surface in the experiment. Fig. 6 represents the most relevant fitted response surfaces for the design and depicts the response surface plots of removal (%) versus significant variables; their curvatures support the presence of interaction among the variables.
image file: c5ra03519h-f6.tif
Fig. 6 Response surfaces for the CCD: MG concentration–sonication time; (b) Adsorbent dosage–pH; (c) SO concentration–pH; and (d) MG concentration–adsorbent dosage.

The effect of initial MG concentration on its removal percentage and the interaction of it with some factors were shown in Fig. 6a and d. It was seen that despite an increase in the amount of dye uptake, its removal efficiency was decreased and, at lower dye concentrations, the ratio of solute concentrations to adsorbent sites is lower, which caused an increase in dye removal. As shown in Fig. 6a, c and d, at higher dye concentrations, a lower adsorption yield is due to the saturation of adsorption sites. On the other hand, the dye removal percentage was higher at lower initial dye concentrations and smaller at higher initial concentrations, which clearly indicate that the adsorption of MG and SO from aqueous solution was dependent on their initial concentrations.

Fig. 6b and c present the interaction of pH with other variables. The increased removal percentage of MG was observed with an increase in pH. This is probably due to the fact that at low initial pH, as a result of protonation of the functional groups, the MWCNTs surfaces get positively charged and the strong repulsive forces between the cationic dye molecules and adsorbent surface lead to a significant decrease in dye removal percentage. An increase in the initial pH leads to deprotonation of the active adsorption sites on the MWCNTs surface via electrostatic interaction and/or hydrogen bonding which adsorbs the MG and SO molecules.

Fig. 6a also reveals the remarkable contribution of ultrasound to increase mass transfer that makes possible the rapid uptake and fast establishment of equilibrium. The initial high adsorption rate is related to the high available surface area and vacant sites of adsorbent due to dispersion of adsorbent into solution by ultrasonic power. It was found that more than 80% of MG removal occurred in the first 3.0 min.

For the adsorbent dosage, the response surface plots shown in Fig. 6b and d demonstrated the changes in response as a function of adsorbent dosage and other variables with interactions of them. The percentage removal increased with an increase in adsorbent dosage due to its high specific surface area and small particle size. At higher values, probably due to an increase in surface area and availability of more active adsorption sites, the rate of adsorption significantly increased. With lower amounts of adsorbent, the removal percentage significantly decreased because of a high ratio of dye molecules to vacant sites.

3.4. Optimization of CCD by DF for extraction procedure

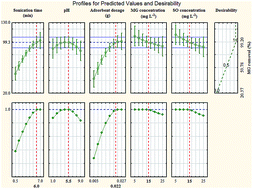
The profile for predicted values and desirability option in the STATISTICA 7.0 software was used for the optimization process (Fig. 7). Profiling the desirability of responses involves specifying the DF for each dependent variable (removal percentage) by assigning predicted values. The scale in the range of 0.0 (undesirable) to 1.0 (very desirable) was used to obtain a global function (D) that should be maximized according to efficient selection and optimization of designed variables. The CCD design matrix results (Table 2) show the maximum (99.2%) and minimum (20.37%) adsorption of MG, respectively. According to these values, DF settings for each dependent variable of removal percentage are depicted on the right hand side of Fig. 7: desirability of 1.0 was assigned for maximum removal (99.2%), 0.0 for minimum (20.37%) and 0.5 for middle (59.78%). On the left hand side of Fig. 7 (bottom) the individual desirability scores are illustrated, to calculate the removal percentage. Since desirability 1.0 was selected as the target value, the overall response obtained from these plots, with the current level of each variable in the model, is depicted at the top (left) of Fig. 7. A glance at the figures shows that variables affect simultaneously the response and its desirability. On the basis of these calculations and a desirability score of 1.0, maximum recovery (99.3%) was obtained at optimum conditions set as: 6.0 min of sonication time, 0.022 g of adsorbent, initial MG concentration of 15 mg L−1 and initial SO concentration of 15 mg L−1 at pH 5.5. The validity of duplicate assenting experiments at the optimized value of all parameters was investigated. The results are closely correlated with the data obtained from desirability optimization analysis using CCD.
image file: c5ra03519h-f7.tif
Fig. 7 Profiles for predicated values and desirability function for removal percentage of MG. Dashed line indicated current values after optimization.

3.5. Comparison with other methods

It may be seen from Table 4 that the contact times for the proposed method, in comparison with all of the adsorbents, are preferable and superior and it also shows satisfactory removal performance for MG and SO.6,45,46 The results indicated that the ultrasound assisted removal method has a remarkable ability to improve removal efficiency of the dyes. The ultrasonic-assisted enhancement of removal could be attributed to the high-pressure shock waves and high-speed microjets during the violent collapse of cavitation bubbles.47,48
Table 4 Comparison for the removal of dyes by different methods and adsorbents
Adsorbent Adsorbate Concentration (mg L−1) Contact time (min) Ref.
Ricinus communis MG 50 90 45
Brown-rotted pine wood MG 7 600 46
Activated carbon SO 25 80 6
MWCNT SO 25 26 6
Cd(OH)2-NW-AC SO 25 23 6
Cu-NWs-AC MG 15 6.0 Proposed method
Cu-NWs-AC SO 15 6.0 Proposed method


In such a procedure real applicability was investigated by spiking real samples including tap water and distilled water and it was found that more than 95% of dye removal was achieved for all the dyes.

4. Conclusion

In this study, Cu-NWs-AC adsorbent was synthesized and characterized. The adsorbent was utilized to remove MG and SO dyes from an aqueous medium in the presence of ultrasound. Analysis of the results by CCD allowed for achievement of the following optimization point: 0.022 g of adsorbent, 6 min of contact time and 15 mg L−1 MG and 15 mg L−1 SO at a pH of 5.5. It was found that application of ultrasound leads to a significant enhancement in the extent of adsorption and removal percentage of MG and SO from aqueous solutions. Combining ultrasound with Cu-NWs-AC increased the dye removal percentage (more than 99%) by using a small amount of adsorbent (0.022 g) in a short time (6.0 min). This procedure may also be applicable for simultaneous removal of dyes from actual waste water. It was found that a small amount of adsorbent (0.022 g) can remove a large amount of MG (34 mg g−1) and SO (34 mg g−1). Finally, the proposed method has good potential for the removal of dyes from wastewater compared to several other adsorbents. The data and methodology presented in this paper might be useful for designing an adsorbent for the treatment of actual effluent. Furthermore, the strength of this study suggests the possibility of using ultrasound devises as worldwide equipment.

Acknowledgements

The authors express their appreciation to the Graduate School and Research Council of the University of Yasouj for financial support of this work.

References

  1. S.-T. Yang, S. Chen, Y. Chang, A. Cao, Y. Liu and H. Wang, J. Colloid Interface Sci., 2011, 359, 24–29 CrossRef CAS PubMed.
  2. F. P. de Sá, B. N. Cunha and L. M. Nunes, Chem. Eng. J., 2013, 215, 122–127 CrossRef PubMed.
  3. T. Gan, J. Sun, S. Cao, F. Gao, Y. Zhang and Y. Yang, Electrochim. Acta, 2012, 74, 151–157 CrossRef CAS PubMed.
  4. M. Roosta, M. Ghaedi, N. Shokri, A. Daneshfar, R. Sahraei and A. Asghari, Spectrochim. Acta, Part A, 2014, 118, 55–65 CrossRef CAS PubMed.
  5. M. A. Ahmad and R. Alrozi, Chem. Eng. J., 2011, 171, 510–516 CrossRef CAS PubMed.
  6. M. Ghaedi, S. Haghdoust, S. N. Kokhdan, A. Mihandoost, R. Sahraie and A. Daneshfar, Spectrosc. Lett., 2012, 45, 500–510 CrossRef CAS PubMed.
  7. M. Roosta, M. Ghaedi, A. Daneshfar and R. Sahraei, Spectrochim. Acta, Part A, 2014, 122, 223–231 CrossRef CAS PubMed.
  8. M. Ghaedi, H. Khajehsharifi, A. H. Yadkuri, M. Roosta and A. Asghari, Toxicol. Environ. Chem., 2012, 94, 873–883 CrossRef CAS PubMed.
  9. G. Dotto and L. Pinto, J. Hazard. Mater., 2011, 187, 164–170 CrossRef CAS PubMed.
  10. M. Ghaedi, K. Mortazavi, M. Jamshidi, M. Roosta and B. Karami, Toxicol. Environ. Chem., 2012, 94, 846–859 CrossRef CAS PubMed.
  11. M. Ghaedi, H. Khajesharifi, A. Hemmati Yadkuri, M. Roosta, R. Sahraei and A. Daneshfar, Spectrochim. Acta, Part A, 2012, 86, 62–68 CrossRef CAS PubMed.
  12. M. Ghaedi, D. Elhamifar, M. Roosta and R. Moshkelgosha, J. Ind. Eng. Chem., 2014, 20, 1703–1712 CrossRef CAS PubMed.
  13. M. Ghaedi, K. Niknam, S. Zamani, H. Abasi Larki, M. Roosta and M. Soylak, Mater. Sci. Eng., C, 2013, 33, 3180–3189 CrossRef CAS PubMed.
  14. M. Shamsipur, H. R. Rajabi, S. M. Pourmortazavi and M. Roushani, Spectrochim. Acta, Part A, 2014, 117, 24–33 CrossRef CAS PubMed.
  15. M. Ghaedi, A. Ghaedi, F. Abdi, M. Roosta, A. Vafaei and A. Asghari, Ecotoxicol. Environ. Saf., 2013, 96, 110–117 CrossRef CAS PubMed.
  16. H. Treviño-Cordero, L. Juárez-Aguilar, D. Mendoza-Castillo, V. Hernández-Montoya, A. Bonilla-Petriciolet and M. Montes-Morán, Ind. Crops Prod., 2013, 42, 315–323 CrossRef PubMed.
  17. M. Ghaedi, Z. Rozkhoosh, A. Asfaram, B. Mirtamizdoust, Z. Mahmoudi and A. A. Bazrafshan, Spectrochim. Acta, Part A, 2015, 138, 176–186 CrossRef CAS PubMed.
  18. J. P. D. S. Fernandes, B. S. Carvalho, C. V. Luchez, M. J. Politi and C. A. Brandt, Ultrason. Sonochem., 2011, 18, 489–493 CrossRef CAS PubMed.
  19. O. Hamdaoui and E. Naffrechoux, Ultrason. Sonochem., 2009, 16, 15–22 CrossRef CAS PubMed.
  20. A. N. Chermahini, A. Teimouri, F. Momenbeik, A. Zarei, Z. Dalirnasab, A. Ghaedi and M. Roosta, J. Heterocycl. Chem., 2010, 47, 913–922 CrossRef CAS PubMed.
  21. S. Sonawane, P. Chaudhari, S. Ghodke, M. Parande, V. Bhandari, S. Mishra and R. Kulkarni, Ultrason. Sonochem., 2009, 16, 351–355 CrossRef CAS PubMed.
  22. Y. Li, A. S. Fabiano-Tixier, V. Tomao, G. Cravotto and F. Chemat, Ultrason. Sonochem., 2013, 20, 12–18 CrossRef CAS PubMed.
  23. M. Roosta, M. Ghaedi, A. Daneshfar, R. Sahraei and A. Asghari, Ultrason. Sonochem., 2014, 21, 242–252 CrossRef CAS PubMed.
  24. M. Roosta, M. Ghaedi, A. Daneshfar, S. Darafarin, R. Sahraei and M. Purkait, Ultrason. Sonochem., 2014, 21, 1441–1450 CrossRef CAS PubMed.
  25. M. Geng and S. M. Thagard, Ultrason. Sonochem., 2013, 20, 618–625 CrossRef CAS PubMed.
  26. D. Markovic, Z. Saponjic, M. Radoicic, T. Radetic, V. Vodnik, B. Potkonjak and M. Radetic, Ultrason. Sonochem., 2015, 24, 221–229 CrossRef CAS PubMed.
  27. P. Saharan, G. R. Chaudhary, S. Lata, S. Mehta and S. Mor, Ultrason. Sonochem., 2015, 22, 317–325 CrossRef CAS PubMed.
  28. O. Moumeni and O. Hamdaoui, Ultrason. Sonochem., 2012, 19, 404–409 CrossRef CAS PubMed.
  29. M. Hauptmann, F. Frederickx, H. Struyf, P. Mertens, M. Heyns, S. De Gendt, C. Glorieux and S. Brems, Ultrason. Sonochem., 2013, 20, 69–76 CrossRef CAS PubMed.
  30. S. Chakma and V. S. Moholkar, Chem. Eng. J., 2011, 175, 356–367 CrossRef CAS PubMed.
  31. G. L. Maddikeri, A. B. Pandit and P. R. Gogate, Ind. Eng. Chem. Res., 2012, 51, 6869–6876 CrossRef CAS.
  32. İ. Küncek and S. Şener, Ultrason. Sonochem., 2010, 17, 250–257 CrossRef PubMed.
  33. F. Momenbeik, M. Roosta and A. A. Nikoukar, J. Chromatogr. A, 2010, 1217, 3770–3773 CrossRef CAS PubMed.
  34. M. Roosta, M. Ghaedi and A. Daneshfar, Food Chem., 2014, 161, 120–126 CrossRef CAS PubMed.
  35. M. Chaichi, A. Mohammadi and M. Hashemi, Microchem. J., 2013, 108, 46–52 CrossRef CAS PubMed.
  36. M. Ghaedi, E. Shojaeipour, A. M. Ghaedi and R. Sahraei, Spectrochim. Acta, Part A, 2015, 142, 135–149 CrossRef CAS PubMed.
  37. P. F. Martins, C. Carmona, E. L. Martinez, P. Sbaite, R. M. Filho and M. R. W. Maciel, Sep. Purif. Technol., 2012, 98, 464–471 CrossRef CAS PubMed.
  38. M. B. Hossain, N. P. Brunton, A. Patras, B. Tiwari, C. O'Donnell, A. B. Martin-Diana and C. Barry-Ryan, Ultrason. Sonochem., 2012, 19, 582–590 CrossRef CAS PubMed.
  39. G. Derringer, J. Qual. Technol., 1980, 12, 214–219 Search PubMed.
  40. Q. Darugar, W. Qian, M. A. El-Sayed and M.-P. Pileni, J. Phys. Chem. B, 2006, 110, 143–149 CrossRef CAS PubMed.
  41. M. Roosta, M. Ghaedi, A. Daneshfar, R. Sahraei and A. Asghari, J. Ind. Eng. Chem., 2015, 21, 459–469 CrossRef CAS PubMed.
  42. Y. Chang, M. L. Lye and H. C. Zeng, Langmuir, 2005, 21, 3746–3748 CrossRef CAS PubMed.
  43. J. Zhao, D. Zhang and X. Zhang, Surf. Interface Anal., 2015, 47, 529–534 CrossRef CAS PubMed.
  44. R. Sahraei, G. M. Aval and A. Goudarzi, J. Alloys Compd., 2008, 466, 488–492 CrossRef CAS PubMed.
  45. T. Santhi, S. Manonmani and T. Smitha, J. Hazard. Mater., 2010, 179, 178–186 CrossRef CAS PubMed.
  46. H. Zhang, Y. Tang, X. Liu, Z. Ke, X. Su, D. Cai, X. Wang, Y. Liu, Q. Huang and Z. Yu, Desalination, 2011, 274, 97–104 CrossRef CAS PubMed.
  47. S. Shirsath, D. Pinjari, P. Gogate, S. Sonawane and A. Pandit, Ultrason. Sonochem., 2013, 20, 277–286 CrossRef CAS PubMed.
  48. P. R. Gogate, V. S. Sutkar and A. B. Pandit, Chem. Eng. J., 2011, 166, 1066–1082 CrossRef CAS PubMed.

This journal is © The Royal Society of Chemistry 2015