Effects of potassium additive on the activity of Ru catalyst for acetylene hydrochlorination†
Yunhe Jina,
Guangbi Lia,
Jinli Zhanga,
Yanfeng Pu*b and
Wei Li*a
aSchool of Chemical Engineering and Technology, Tianjin University, Tianjin 300072, PR China. E-mail: liwei@tju.edu.cn
bState Key Laboratory of Coal Conversion, Institute of Coal Chemistry, Chinese Academy of Sciences, Taiyuan 030001, China. E-mail: family725365@126.com
First published on 14th April 2015
Abstract
Ruthenium and ruthenium–potassium bimetallic catalysts for acetylene hydrochlorination were prepared with RuCl3·H2O and KCl as precursors and active carbon as the support. It is found that Ru–K/SAC catalysts have a higher catalytic performance than Ru/SAC catalysts and the optimal conversion of acetylene over Ru1K1/SAC is 93.4% under the conditions of 170 °C, C2H2 hourly space velocity (GHSV) of 180 h−1, feed volume ratio V(HCl)/V(C2H2) = 1.1. Characterized with BET, TG, TEM, TPR, TPD and XPS, it is indicated that the K additive can promote the formation of more active RuO2 species during the catalyst preparation, but also enhance the ruthenium dispersion of catalysts. In particular, K additive can enhance the reactant adsorption and the product desorption properties of Ru-based catalysts, but also facilitate the function of auxiliary RuCl3 species to inhibit coke deposition.
1. Introduction
Polyvinyl chloride (PVC) is one of the largest general plastics and the production process of its monomer, vinyl chloride monomer (VCM), has attracted more attention recently in China. Currently, the domestic production of VCM is mainly through the acetylene hydrochlorination reaction owing to the abundant coal resources,1,2 with the industrial catalyst of mercuric chloride supported on activated carbon (HgCl2/C). However, due to the toxicity and volatility of HgCl2,3,4 it is urgent to explore green non-mercury catalysts for acetylene hydrochlorination to replace the toxic HgCl2/C.Gold-based catalysts, since the pioneering work of Hutchings et al.,5 have been intensively studied as a potential substitute for mercury catalysts.6–19 It has been suggested that for gold-based catalysts there are two main deactivation pathways involving the coke deposition and the reduction of Au3+ specie.20 Consequently many reports still focused on inhibiting the carbonaceous residues deposition and retarding the reduction of Au3+ through adding the second metallic component into gold catalysts, including the bimetallic Au–Ba catalyst21 and Au–Cs,22 etc.
The ruthenium-based catalyst, on the other hand, has recently been reported to show good performance for the acetylene hydrochlorination and considered as a cheaper alternative to Au-based catalyst.23–25 For instances, a RuCl3 catalyst with the support of spherical activated carbon (SAC) showed the average acetylene conversion of 85.0%, the selectivity to VCM of 99.0% under the reaction conditions of 170 °C, C2H2 hourly space velocity (GHSV) = 180 h−1 and V(HCl)/V(C2H2) = 1.1.25 A RuCl3 catalyst with multiwalled carbon nanotubes as the support showed the acetylene conversion of 95.0%, the selectivity to VCM of 99.9% after 10 h under the conditions of 170 °C, C2H2 GHSV = 90 h−1 and V(HCl)/V(C2H2) = 1.1.24 In particular, it has been disclosed that the species of RuO2 plays a more important role to improve the activity of Ru-based catalyst towards acetylene hydrochlorination reaction comparing with Ru0 and Ru3+.25 However, it is still a challenge to modulate effectively the distribution of ruthenium species in Ru-based catalysts, which is essential to improve the catalytic activity for ruthenium-based catalysts, so as to develop a substantial non-mercury catalyst for acetylene hydrochlorination.
Potassium has been reported as the promoter for several catalysts. Gálvez et al.26 studied K–Me (Me = Cu, Co, V) bimetallic catalysts supported on alumina for the simultaneous removal of soot and NOx, and found that K worked as a good promoter to Cu catalysts. Wang et al.27 synthesized bimetallic Pd–K/Y-zeolite catalyst and found that K promoter could effectively improve the catalytic properties of Pd-based catalyst for acetylene hydrochlorination.
In this article, a series of ruthenium–potassium (Ru–K) catalysts were prepared with the spherical activated carbon (SAC) as the support to study the effects of KCl on the performance of Ru-based catalysts for acetylene hydrochlorination. The best catalytic activity was obtained over Ru1K1/SAC with the acetylene conversion of 93.4% under 170 °C and C2H2 GHSV = 180 h−1. The influences of KCl doping on electronic properties, adsorption and redox of the Ru-based catalysts were characterized by BET, TG, TPR, TEM, TPD and XPS.
2. Experimental
2.1. Catalyst preparation
The Ru-based catalysts were prepared by an incipient impregnation technique with tri-distilled water as a solvent. The support SAC (20–40 mesh) was pretreated by a 1 mol L−1 HCl aqueous solution at 70 °C for 5 h to remove impurities, followed by water washing to be neutral and dessication at 150 °C for 18 h. Ru/SAC and Ru–K/SAC catalysts were prepared using RuCl3·3H2O and KCl as the precursors. The Ru loading content of each Ru-based catalyst is maintained at 1 wt%. To prepare Ru/SAC, a RuCl3 aqueous solution was dropped stirringly into the SAC support at room temperature, followed by the incubation at 60 °C for 12 h and dessication further at 150 °C for 12 h. To prepare Ru–K/SAC, the mixed RuCl3 and KCl aqueous solution, with different Ru/K molar ratio, was dropped stirringly into the SAC support with the similar preparation procedure. The Ru–K/SAC catalysts were named in terms of the Ru/K ratio, i.e., Ru1K0.5/SAC, Ru1K1/SAC and Ru1K2/SAC are denoted respectively to the catalyst prepared with the Ru/K ratio of 1![[thin space (1/6-em)]](https://www.rsc.org/images/entities/char_2009.gif) :
:![[thin space (1/6-em)]](https://www.rsc.org/images/entities/char_2009.gif) 0.5, 1
0.5, 1![[thin space (1/6-em)]](https://www.rsc.org/images/entities/char_2009.gif) :
:![[thin space (1/6-em)]](https://www.rsc.org/images/entities/char_2009.gif) 1 and 1
1 and 1![[thin space (1/6-em)]](https://www.rsc.org/images/entities/char_2009.gif) :
:![[thin space (1/6-em)]](https://www.rsc.org/images/entities/char_2009.gif) 2.
2.
2.2. Catalyst characterization
The BET surface area and pore volume were analysed by Micromeritics ASAP 2020C porosity analyzer. The catalysts were heated at 300 °C and outgassed for 6 h at this temperature and conducted with N2 adsorption–desorption at −196 °C.The carbon deposition was tested by thermogravimetric analysis (TGA) with a thermogravimetric-differential scanning calorimetry (TG-DSC, NETZSCH STA 449F3 Jupiter®) simultaneous thermal analyzer, flushing with a pure N2 gas flow rate of 50 mL min−1 and an air flow rate of 20 mL min−1. The temperature increased from 35 to 900 °C using a rate of 10 °C min−1.
Transmission electron microscopy (TEM) was conducted using a JEM2100F TEM and an FEI Titan 80-300 TEM/STEM which was equipped with CEOS spherical aberration corrector. The samples were ground to obtain a fine powder and dispersed in ethanol, then, several droplets of the ethanol suspension were laid on a TEM grid with 300-mesh copper and holey carbon film.
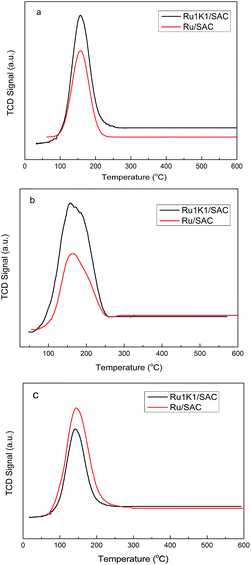
TPD (temperature programmed desorption) and TPR (temperature programmed reduction) were measured by an AutoChem BET TPR/TPD (Quantachrome Instruments AMI-90). The weight of all samples for TPR and TPD experiments were fixed as 120 mg. For TPR experiment, the sample was heated from 35 to 900 °C under a heating rate of 10 °C min−1, with a flow gas mixture containing 6 vol% H2 in Ar of 20 mL min−1. The desorption of moisture was performed at 300 °C for 60 min before the TPD experiment. For CO-, C2H2- and C2H3Cl-TPD experiment, the adsorption experiments were performed at 100 °C for 30 min, and the flow gas was a 20 mL min−1 pure CO/C2H2/C2H3Cl. After the adsorption, the samples were treated with pure He gas at 100 °C for 60 min, then cooled to the 30 °C within 60 min. Then, the desorption was performed from 30 to 630 °C at He atmosphere. For the HCl-TPD experiment, the process was same with that of CO-, C2H2- or C2H3Cl-TPD, expect the HCl was injected to the equipment by a 500 μL injector. The total injection volume of HCl was 3500 μL.
X-ray photoelectron spectroscopy (XPS) was collected by a PHI5000 Versa Probe spectrometer (ULVAC-PHI, JP) with a 24.2 W monochromatised Al Kα X-ray source. All XPS spectra were conducted with a pass energy of 187.85 eV, while that of high resolution spectra was 46.95 eV. C 1s line which performed as the calibration of the spectra was 284.6 eV.
2.3. Catalytic testing
Catalyst tests were performed in a fixed-bed flow microreactor (inner diameter = 10 mm), equipped with a CKW-1100 temperature controller (Chao yang Automation Instrument Factory, Beijing, China). Before the reaction, nitrogen was flowed for 30 min to remove water and impurity. C2H2 (99.9%, 15 mL min−1) and HCl (99.9%, 16.5 mL min−1) were then fed through the filter with a GHSV(C2H2) of 180 h−1 (5 mL) at the initial temperature of 190 °C. The reaction temperature was 170 °C, and the pressures of HCl and C2H2 were both in a safe and mild range of 1.1–1.2 bar. The effluent of the reactor was passed through a NaOH aqueous solution absorption bottle and then analyzed by a Beifen 3420A chromatograph.3. Results
3.1. Catalytic performance
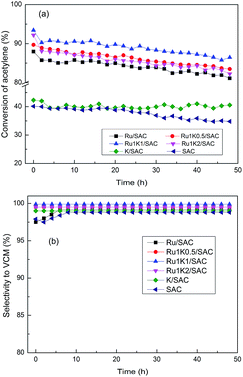
Fig. 1 displays the catalytic performance of Ru–K/SAC with different Ru/K molar ratios for acetylene hydrochlorination. It is indicated that the monometallic K catalyst shows the initial acetylene conversion about 42.2%, which is close to that over the support SAC in the reaction time of 30 h. As the reaction time lasts up to 40 h, the acetylene conversion over the support SAC decreases greatly to lower than 35.0% whereas over K catalyst the acetylene conversion is 40.0% in the reaction time of 48 h (Fig. 1a). The monometallic Ru catalyst has an initial acetylene conversion of 87.9% and decreases to 81.1% in 48 h. In case of bimetallic Ru–K catalysts, the optimal initial acetylene conversion is obtained over Ru1K1/SAC as 93.4% and reduces to 86.5% in 48 h. The selectivity to VCM is 99.2% over Ru/SAC, 99.5%, over Ru1K0.5/SAC, 99.9% over Ru1K1/SAC, and 99.6% over Ru1K2/SAC, respectively (Fig. 1b). Moreover, we also assessed the performance of Ru–K catalysts for acetylene hydrochlorination under higher GHSV of 900 h−1, and the results are shown in Fig. S1.† It is indicated that the relationship between the acetylene conversion and the molar ratio of Ru/K under high GHSV (900 h−1) is similar with that under low GHSV (180 h−1), i.e., the best catalytic activity is achieved at the optimal Ru/K molar ratio of 1![[thin space (1/6-em)]](https://www.rsc.org/images/entities/char_2009.gif) :
:![[thin space (1/6-em)]](https://www.rsc.org/images/entities/char_2009.gif) 1. It is illustrated that the K additive indeed improves the activity of Ru/SAC catalyst.
1. It is illustrated that the K additive indeed improves the activity of Ru/SAC catalyst.
3.2. Catalyst properties
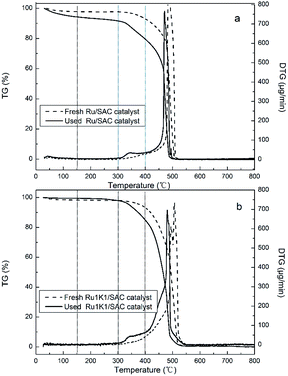
Table 1 lists the specific surface area and total pore volume of fresh and used Ru-based catalysts. After impregnation of Ru or Ru–K, the specific surface area and total pore volume of catalysts are lower than those of the single carbon support. Compared with the fresh monometallic Ru/SAC (954 m2 g−1), the specific surface areas of fresh Ru–K/SAC catalysts increase to some extent, but still lower than that of the carbon support (1133 m2 g−1). For the used catalysts, the individual catalyst shows a lower specific surface area than the corresponding fresh one. The decrease of specific surface area and total pore volume of used catalysts may be attributed to the coke deposition during the reaction.17 The used Ru/SAC shows a surface area decrease about 13.1% (from the initial 954 m2 g−1 to 827 m2 g−1), while the used Ru1K0.5/SAC, Ru1K1/SAC and Ru1K2/SAC catalyst shows respectively a surface area decrease about 12.8%, 10.4%, and 9.2%. Meanwhile, the total pore volume of each catalyst, either fresh or used, is lower than that of the support. It is noteworthy to mention that for the fresh and used Ru1K1/SAC catalyst the total pore volume is close to each other. The less reduction of surface area and total pore volume of used Ru–K/SAC catalysts may suggest that the addition of KCl can resist the formation of coke deposition, compared with Ru/SAC.
| Catalyst | SBET (m2 g−1) | Total pore volume (cm3 g−1) | ||
|---|---|---|---|---|
| Fresh | Used | Fresh | Used | |
| SAC | 1133 | 1021 | 0.65 | 0.57 |
| Ru/SAC | 954 | 827 | 0.58 | 0.48 |
| Ru1K0.5/SAC | 1053 | 918 | 0.52 | 0.48 |
| Ru1K1/SAC | 1043 | 934 | 0.51 | 0.50 |
| Ru1K2/SAC | 972 | 882 | 0.48 | 0.47 |
For the Ru1K1/SAC catalyst, there appears a slight weight loss before 150 °C (Fig. 2b), so do the catalysts of Ru1K0.5/SAC and Ru1K2/SAC (Fig. S3†). Similarly, the amount of coke deposition is calculated according to the mass loss of the fresh and the used Ru–K/SAC in temperature range of 150–400 °C. As listed in Table 2, the coke deposition equals 10.4%, 9.3% and 5.9% over Ru1K0.5/SAC, Ru1K1/SAC and Ru1K2/SAC, respectively. It is indicated that K additive can effectively inhibit the formation of coke deposition on Ru-based catalysts, which is in accord with BET results (Table 1).
| Catalyst | Amount of coke deposition (%) |
|---|---|
| Ru/SAC | 10.8 |
| Ru1K0.5/SAC | 10.4 |
| Ru1K1/SAC | 9.3 |
| Ru1K2/SAC | 5.9 |
![[thin space (1/6-em)]](https://www.rsc.org/images/entities/char_2009.gif) :
:![[thin space (1/6-em)]](https://www.rsc.org/images/entities/char_2009.gif) Ru stoichiometry of 5
Ru stoichiometry of 5![[thin space (1/6-em)]](https://www.rsc.org/images/entities/char_2009.gif) :
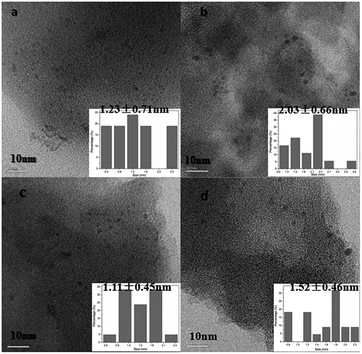
:![[thin space (1/6-em)]](https://www.rsc.org/images/entities/char_2009.gif) 1 and neglecting the potential interaction between CO and RuO2.25,29 As listed in Table 3, the dispersion degree decreases in the order: Ru1K1/SAC (50.1%) > Ru1K0.5 (49.2%) > Ru1K2 (48.0%) > Ru/SAC (37.5%). It is illustrated that the potassium additive improves the ruthenium dispersion of catalysts and the dispersion is the highest when the molar ratio equals to 1
1 and neglecting the potential interaction between CO and RuO2.25,29 As listed in Table 3, the dispersion degree decreases in the order: Ru1K1/SAC (50.1%) > Ru1K0.5 (49.2%) > Ru1K2 (48.0%) > Ru/SAC (37.5%). It is illustrated that the potassium additive improves the ruthenium dispersion of catalysts and the dispersion is the highest when the molar ratio equals to 1![[thin space (1/6-em)]](https://www.rsc.org/images/entities/char_2009.gif) :
:![[thin space (1/6-em)]](https://www.rsc.org/images/entities/char_2009.gif) 1. This result is in accord with the morphology (TEM images in Fig. 4) and the activity of Ru-based catalysts (the catalytic activity in Fig. 1).
1. This result is in accord with the morphology (TEM images in Fig. 4) and the activity of Ru-based catalysts (the catalytic activity in Fig. 1).
| Samples | CO uptake (10−2 mmol g−1) | Ru dispersion (%) |
|---|---|---|
| Ru/SAC | 3.71 | 37.5% |
| Ru1K0.5/SAC | 4.87 | 49.2% |
| Ru1K1/SAC | 5.14 | 50.1% |
| Ru1K2/SAC | 4.75 | 48.0% |
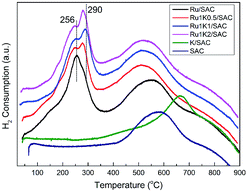
Fig. 5 shows TPR profiles of fresh Ru-based catalysts. It is indicated that the support SAC shows one H2 consumption zone at 400–700 °C, which is mainly related to the decomposition of functional groups on the support. In addition, in the presence of K additive, the H2 consumption zone of the support (K/SAC) shifts to higher temperature of 500–800 °C. The profile of each Ru-based catalyst shows clear bands at 200–300 °C due to the reduction of Ru species, besides the broad band at 400–700 °C due to the reduction of the support. For the Ru/SAC, there appears the peak at 256 °C together with a shoulder at 277 °C, attributed to the reduction of RuCl3 and RuO2 respectively. For the Ru–K catalysts, there exist two peaks at 200–300 °C, in particular, the peak around 290 °C becomes stronger. For instance, the Ru1K1/SAC exhibits a strong peak at 290 °C besides the small peak 256 °C, suggesting that the amount of RuO2 species in the catalyst is increased upon adding potassium. It is illustrated that K additive can facilitate the formation of RuO2 species through enhancing the interaction between Ru species and SAC support.
| Sample | XPS analysis, eV (area%) | |||
|---|---|---|---|---|
| Metallic Ru | RuCl3 | RuO2 | RuOx | |
| Ru/SAC | 461.4 (14.7) | 463.4 (50.9) | 464.9 (17.6) | 466.2 (16.8) |
| Ru1K0.5/SAC | 462.2 (21.7) | 463.2 (36.1) | 464.8 (26.4) | 466.2 (15.8) |
| Ru1K1/SAC | 461.8 (14.3) | 463.0 (28.4) | 464.1 (38.6) | 465.7 (18.7) |
| Ru1K2/SAC | 461.7 (21.8) | 463.0 (28.9) | 464.2 (29.2) | 465.4 (20.1) |
| Sample | XPS analysis, eV (area%) | |||
|---|---|---|---|---|
| Metallic Ru | RuCl3 | RuO2 | RuOx | |
| Ru/SAC | 461.1 (27.3) | 463.1 (40.1) | 464.3 (16.3) | 465.7 (16.3) |
| Ru1K0.5/SAC | 461.5 (42.8) | 463.0 (29.1) | 464.2 (18.1) | 465.2 (10.0) |
| Ru1K1/SAC | 461.8 (15.4) | 463.2 (27.7) | 464.6 (26.8) | 466.0 (30.1) |
| Ru1K2/SAC | 461.0 (52.0) | 462.7 (24.7) | 463.9 (14.7) | 465.1 (8.6) |
4. Discussion
The turnover frequency (TOF) value of each Ru-based catalyst is calculated considering the Ru dispersion and the acetylene conversion at the reaction time of 12 h.30 As listed in Table S2,† the TOF values of Ru-based catalysts decrease in the order: Ru1K1/SAC (2.45 min−1) > Ru1K0.5/SAC (2.12 min−1) > Ru1K2/SAC (2.02 min−1) > Ru/SAC (1.89 min−1). It is worthwhile to note that Ru1K1/SAC catalyst has the highest TOF value and the highest catalytic activity for acetylene hydrochlorination (Fig. 1), which is in accord with the most abundance of RuO2 species (Table 4 and 5). Whereas Ru/SAC catalyst has the lowest TOF value and the lowest acetylene conversion, consistent with the least abundance of RuO2 species.Take into account the coke deposition on Ru–K based catalysts, as listed in Table 2, the coke deposition amount on Ru–K/SAC catalysts decreases as the Ru/K molar ratio of rises from 0.5 to 2, i.e., Ru1K2/SAC has the least coke deposition of 5.9%, even lower than that of Ru1K1/SAC (9.3%). However, the catalytic activity of Ru1K2/SAC is lower than that of Ru1K1/SAC. Comparing the content of RuCl3 species in the catalysts (Table 4 and 5), it is indicated that Ru1K2/SAC has a little higher content of RuCl3 species than Ru1K1/SAC, besides the second abundance of RuO2 (29.2%), suggesting that the higher content of RuCl3 species can inhibit the coke deposition on catalysts, in accompany with the active RuO2 species of ruthenium catalysts whose condition is similar to the gold catalysts.31 It is reasonable to conclude that the K additive can effectively enhance the content of active RuO2 species in Ru-based catalysts so as to improve the catalytic activity, but also facilitate the function of auxiliary RuCl3 species to inhibit the coke deposition.
5. Conclusion
Compared with the monometallic Ru/SAC, bimetallic Ru–K/SAC catalysts show obvious higher catalytic performance for acetylene hydrochlorination and the optimal acetylene conversion achieves 93.4% over Ru1K1/SAC catalyst under the conditions of temperature 170 °C, C2H2 GHSV 180 h−1, and V(HCl)/V(C2H2) = 1.1. It is indicated that K additive can promote the formation of more amount of active RuO2 species during the catalyst preparation, but also enhance the ruthenium dispersion of catalysts. In particular, K additive can enhance the adsorption of reactants and the desorption of product C2H3Cl on Ru-based catalysts. It is conclude that K additive can effectively enhance the content of active RuO2 species in Ru-based catalysts so as to improve the catalytic activity, but also facilitate the function of auxiliary RuCl3 species to inhibit the coke deposition.Acknowledgements
This work was supported by the Special Funds for Major State Research Program of China (2012CB720300), 863 (2012AA062901), NSFC (21176174), and Program for Changjiang Scholars and Innovative Research Team in University (IRT1161).Notes and references
- L. Wang, F. Wang, J. Wang, X. Tang, Y. Zhao, D. Yang, F. Jia and T. Hao, React. Kinet., Mech. Catal., 2013, 110, 187 CrossRef CAS.
- J. Zhao, J. Xu, J. Xu, T. Zhang, X. Di, J. Ni and X. Li, Chem. Eng. J., 2015, 262, 1152 CrossRef CAS PubMed.
- W. Wittanadecha, N. Laosiripojana, A. Ketcong, N. Ningnuek, P. Praserthdam, J. R. Monnier and S. Assabumrungrat, React. Kinet., Mech. Catal., 2014, 112, 189 CrossRef CAS.
- K. Chen, L. Kang, M. Zhu and B. Dai, Catal. Sci. Technol., 2015, 5, 1035 CAS.
- G. J. Hutchings, J. Catal., 1985, 96, 292 CrossRef CAS.
- M. Conte, C. J. Davies, D. J. Morgan, A. F. Carley, P. Johnston and G. J. Hutchings, Catal. Lett., 2013, 144, 1 CrossRef PubMed.
- B. Nkosi, M. D. Adams, N. J. Coville and G. J. Hutchings, J. Catal., 1991, 128, 378 CrossRef CAS.
- K. Zhou, W. Wang, Z. Zhao, G. Luo, J. T. Miller, M. S. Wong and F. Wei, ACS Catal., 2014, 4, 3112 CrossRef CAS.
- C. Huang, M. Zhu, L. Kang, X. Li and B. Dai, Chem. Eng. J., 2014, 242, 69 CrossRef CAS PubMed.
- M. Conte, A. F. Carley, G. Attard, A. A. Herzing, C. J. Kiely and G. J. Hutchings, J. Catal., 2008, 257, 190 CrossRef CAS PubMed.
- S. Wang, B. Shen and Q. Song, Catal. Lett., 2010, 134, 102 CrossRef CAS.
- J. Ma, S. Wang and B. Shen, React. Kinet., Mech. Catal., 2013, 110, 176 Search PubMed.
- H. Zhang, B. Dai, X. Wang, L. Xu and M. Zhu, J. Ind. Eng. Chem., 2012, 18, 49 CrossRef CAS PubMed.
- J. Zhang, Z. He, W. Li and Y. Han, RSC Adv., 2012, 2, 4814 RSC.
- Y. Pu, J. Zhang, X. Wang, H. Zhang, L. Yu, Y. Dong and W. Li, Catal. Sci. Technol., 2014, 4, 4426 CAS.
- J. Zhao, X. Cheng, L. Wang, R. Ren, J. Zeng, H. Yang and B. Shen, Catal. Lett., 2014, 144, 2191 CrossRef CAS PubMed.
- H. Zhang, B. Dai, W. Li, X. Wang, J. Zhang, M. Zhu and J. Gu, J. Catal., 2014, 316, 141 CrossRef CAS PubMed.
- J. Zhao, J. Zeng, X. Cheng, L. Wang, H. Yang and B. Shen, RSC Adv., 2015, 5, 16727 RSC.
- B. Wang, L. Yu, Y. Pu, H. Zhang and W. Li, RSC Adv., 2014, 4, 15877 RSC.
- B. Nkosi, N. J. Coville, G. J. Hutchings, M. D. Adams, J. Friedl and F. E. Wanger, J. Catal., 1991, 128, 366 CrossRef CAS.
- H. Zhang, W. Li, X. Li, W. Zhao, J. Gu, X. Qi, Y. Dong, B. Dai and J. Zhang, Catal. Sci. Technol., 2015, 5, 1870 CAS.
- J. Zhao, J. Xu, J. Xu, J. Ni, T. Zhang, X. Xu and X. Li, ChemPlusChem, 2014, 80, 196 CrossRef PubMed.
- J. Zhang, W. Sheng, C. Guo and W. Li, RSC Adv., 2013, 3, 21062 RSC.
- G. Li, W. Li, H. Zhang, Y. Pu, M. Sun and J. Zhang, RSC Adv., 2015, 5, 9002 RSC.
- Y. Pu, J. Zhang, L. Yu, Y. Jin and W. Li, Appl. Catal., A, 2014, 488, 28 CrossRef CAS PubMed.
- M. E. Gálvez, S. Ascaso, I. Suelves, R. Moliner, R. Jiménez, X. García, A. Gordon and M. J. Lázaro, Catal. Today, 2011, 176, 361 CrossRef PubMed.
- F. Wang, L. Wang, J. Wang, Y. Zhao, Y. Wang and D. Yang, React. Kinet., Mech. Catal., 2014, 114(2), 725 CrossRef.
- M. Wang, F. Wang, J. Ma, C. Chen, S. Shi and J. Xu, Chem. Commun., 2013, 49(59), 6623 RSC.
- R. Nie, D. Liang, L. Shen, J. Gao, P. Chen and Z. Hou, Appl. Catal., B, 2012, 127, 212 CrossRef CAS PubMed.
- L. Chen, Y. Li, X. Zhang, Q. Zhang, T. Wang and L. Ma, Appl. Catal., A, 2014, 478, 117 CrossRef CAS PubMed.
- M. Wang, F. Wang, J. Ma, M. Li, Z. Zhang, Y. Wang, X. Zhang and J. Xu, Chem. Commun., 2014, 50, 292 RSC.
Footnote |
| † Electronic supplementary information (ESI) available. See DOI: 10.1039/c5ra03466c |
| This journal is © The Royal Society of Chemistry 2015 |

