Controlled fabrication of hierarchically porous Ti/Sb–SnO2 anode from honeycomb to network structure with high electrocatalytic activity

Sumreen Asimab, Jiao Yina, Xiu Yuea, Muhammad Wajid Shahab, Yunqing Zhu*a, Yingxuan Lia and Chuanyi Wang*a
aLaboratory of Environmental Sciences and Technology, Xinjiang Technical Institute of Physics & Chemistry, Key Laboratory of Functional Materials and Devices for Special Environments, Chinese Academy of Sciences, Urumqi 830011, China. E-mail: zhuyq@ms.xjb.ac.cn; cywang@ms.xjb.ac.cn; Fax: +86 911 3838957; Tel: +86 911 3835879
bUniversity of Chinese Academy of Sciences, Beijing, 100049, China

Received 13th February 2015 , Accepted 17th March 2015

First published on 17th March 2015


Abstract

A simple template removal method has been developed for fabrication of hierarchically porous Sb doped SnO2 electrode with high porosity, effective electroactive sites, and enhanced electrocatalytic efficiency. Two different kinds of hierarchically porous architectures (Ti/Sb–SnO2-honeycomb and Ti/Sb–SnO2-network) with remarkable porosity and layer by layer arrangement in multiple directions are fabricated as observed by SEM measurements. EDS confirms the uniform distribution of Sb, Sn and O on substrate surface and the peaks of XRD at 33.9° and 51.8° proves the presences of rutile SnO2. Linear sweep voltammetry shows the Ti/Sb–SnO2-honeycomb and Ti/Sb–SnO2-network possess high OEP value upto 2.60 V, and 2.76 V. By analyzing CV curves, the recorded total voltammetric charge for hierarchically porous electrodes is boosted upto 7.46 mC cm−2 and 11.96 mC cm−2, compared to the conventional one (3.0 mC cm−2), which indicates the significant enhancement in electrochemical active sites. The electrocatalytic efficiency is explored by degradation of Rhodamine B under different parameters (pH, current density, and concentration). The reaction rates for Ti/Sb–SnO2-honeycomb and Ti/Sb–SnO2-network are 9.2 × 10⁻² min−1 and 19.7 × 10⁻² min−1, respectively, which are 2.2 and 4.7 times higher than conventional one (k = 4.2 × 10⁻² min−1). Further mechanistic study suggests that more electroactive sites provided by hierarchically porous electrodes lead to accelerate HO˙ generation and the channels of porous structure significantly promotes the adsorption and diffusion of pollutant molecules.

1. Introduction

Electrochemical advanced oxidation process (EAOP) is a versatile and effective technology for degradation of toxic or refractory organic pollutants due to environmental capability and easy operation.1 As EAOP is an electron transfer reaction between electrode and electrolyte (solid/liquid),2 therefore, electrode material has decisive influence on the efficiency of the oxidation reaction. Much work has been done to enhance the electrochemical oxidation activity, such as different electrode materials and compositions are used including carbon fiber,3 boron-doped diamond,4 PbO2,5 RuO2,6 graphite,7 and Sb–SnO2 (ref. 8) etc. Interest in Sb doped SnO2 has been increased due to its high oxygen evolution, high HO˙ generation, low cost, and enhanced conductivity.9 Although Ti/Sb–SnO2 electrode shows high effectiveness towards the electrochemical oxidation, but still some problems remained to hinder the contact of pollutant molecules with catalyst, like low electroactive sites, limited mass transfer efficiency, formation of the resistive layer between substrate and catalyst, and loss of catalyst into the electrolyte solution. Considerable efforts have been directed to resolve these issues by adding some interlayer,10 rare earth metal doping,11 and modification of catalyst with other metals (Ir, Pt, Au, Fe, etc.).12 However, limited attention is paid towards the structural development of electrode to overcome such problems. Actually, the target pollutants are oxidized in EAOPs by hydroxyl radicals (HO˙) as following.13

Firstly, H2O is splitted to produce physico-sorbed (HO˙) radical (eqn (1)).

 
MOx + H2O → MOx(HO˙) + H+ + e (1)

In the absence of organic molecule, oxygen is evolved from physico-sorbed (HO˙) radical in the following way (eqn (2)).

 
MOx(HO˙) → 1/2O2 + H+ + MOx + e (2)

When organic contaminant is present following reaction occurs (eqn (3)).

 
R + MOx(HO˙) → CO2 + MOx + zH+ + ze (3)
where R represents the pollutant molecules.

The reactive oxygen species produced at anode surface is adsorbed by catalyst, and at the same time oxidation of the pollutant occurs at electrode surface. The enhancement of the surface area of the electrode can provide more active sites for HO˙ generation which would promote the pollutant degradation. Therefore, the anodic material with good adsorption and mass transfer ability is desirable for the fast interaction between HO˙ radical and target pollutant molecules. Considering all these factors, the structural properties of the electrode should be highly relevant with EOAPs. From this prospective, hierarchically porous structure composed of mesopores and macropores provides high surface area,14 improves the mass transfer ability,15 reduces the diffusion path, and possesses good mechanical integrity,16 which exhibits remarkable potentials for application in energy storage,17 separation and catalysis.18 Anodes with hierarchical pore channels can thereby be utilized in a more effective way to overcome the current issues and challenges, such as low removal rate at high-energy consumption, diffusion barriers, and fluid catalytic cracking etc.18 The abundant electroactive sites of hierarchically porous electrodes may significantly increase the HO˙ generation and adsorption capability of organic pollutant molecules on the catalyst surface. The approach of the pollutant molecules towards less accessible region in electrodes may be enhanced by multi scale layered arrangement of hierarchical porous channels.

In the present work, hierarchically porous Sb–SnO2 anodes have been fabricated in two different kinds of architectures, Sb–SnO2-honeycomb and Sb–SnO2-network. The particular interest of this study is to enhance the surface area with multiple scale of porosity to create great quantity of reactive sites for the fast diffusion of the guest molecules in the porous channels to maximize the electrocatalytic activity. The formation processes of the two different kinds of structures are investigated thoroughly by SEM, XRD, and EDS measurements. Different electrochemical properties like CV, voltammetric charge calculations, AC impedance, and roughness factor are analyzed to explore the advancement and advantages of the hierarchically porous Sb–SnO2 anode. Furthermore, the electrocatalytic performance of fabricated anodes is evaluated in detail under different parameters (RhB concentration, pH, and current densities). The efficiency towards the pollutant degradation is analyzed by interaction of the contaminant molecules with the fabricated catalyst in a whole reaction system.

2. Experimental section

2.1. Chemical reagents

All chemical reagents used in this experiment are of analytic grade and used without further purification. All solutions were prepared using deionized water with resistance of 18 MΩ cm−1 obtained from an EPED-40TF, water purification laboratory system (Yipuyida technology development Ltd. Nanjing, China).

2.2. Preparation of hierarchically porous anodes

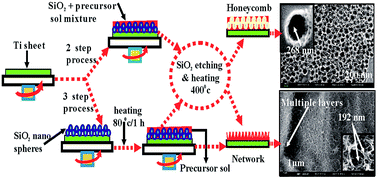
For the fabrication of hierarchically porous anodes, titanium plates (30 mm × 25 mm) were used as a substrate. The substrate surface was cleaned and polished by sand paper 40-grid and 320-grid, treated with H2SO4[thin space (1/6-em)]:[thin space (1/6-em)]H2O2 (3[thin space (1/6-em)]:[thin space (1/6-em)]1) for 30 min. After that the Ti-sheets were dipped in acetic acid (10%) for 50 min, then washed thoroughly with water and dried. The fabrication process is presented in Fig. 1 and involved steps are as following.
image file: c5ra02838h-f1.tif
Fig. 1 Schematic view of fabrication process for Ti/Sb–SnO2-honeycomb and Ti/Sb–SnO2-network anodes.

Silica spheres (average diameter 50–300 nm) were prepared by typical Stöber method. The Sb–SnO2 precursor solution for hierarchically porous and conventional electrode was prepared by modifying the previous method19 to obtain the desired concentrations. SnCl4[thin space (1/6-em)]:[thin space (1/6-em)]SbCl3[thin space (1/6-em)]:[thin space (1/6-em)]F127[thin space (1/6-em)]:[thin space (1/6-em)]H2O[thin space (1/6-em)]:[thin space (1/6-em)]EtOH at molar ratio of 1[thin space (1/6-em)]:[thin space (1/6-em)]0.05[thin space (1/6-em)]:[thin space (1/6-em)]0.0055[thin space (1/6-em)]:[thin space (1/6-em)]18[thin space (1/6-em)]:[thin space (1/6-em)]90, respectively, were stirred for 8 hours at ambient condition. Where tin tetrachloride (SnCl4) was used as precursor and F127 acted as pore forming agent. Two types of controlled hierarchical anodes were designed by changing the concentrations of sol and experimental parameters.

Ti/Sb–SnO2-honeycomb was fabricated in two steps, Step 1: the above prepared Sb–SnO2 precursor solution and silica spheres were mixed at a ratio of 1[thin space (1/6-em)]:[thin space (1/6-em)]2 and spin coated (1 mL) on pre-acid treated Ti-substrate at the rate of 1500 rpm for 60 s then calcinated at 400 °C in muffle oven for one hour at ramping rate of 1 °C min−1. Step 2: the pre-coated Ti-substrate was dipped overnight in a 4 M NaOH solution for the complete removal of the silica spheres, then washed thoroughly with distilled water and dried at room temperature.

Ti/Sb–SnO2-network was prepared in three steps. Step 1: cleaned substrate (Ti Sheet) was spin-coated with prepared silica spheres (1 mL), and heated in oven at 80 °C for 1 hour to bind this silica layer on substrate. Step 2: the Ti-substrate assembled with silica spheres was again spin-coated by the prepared Sb–SnO2 precursor solution, drop wise at the rate of 2000 rpm for 80 s and then exposed to air to dry the solvent. Subsequently, the coated Ti-substrate was calcinated at 400 °C in a muffle oven for one hour at the ramping rate of 1 °C min−1. Step 3: for the removal of the template, the coated Ti-sheet was dipped in a 4 M NaOH solution for 12 hours then washed thoroughly and dried.

For comparison purpose the conventional electrode was also prepared by using the sol–gel method. Under ambient conditions 5 g of SnCl2, 0.25 g of SbCl3 and 5 mL hydrochloric acid in 50 mL ethanol were stirred for 6 hours. The prepared solution was spin coated on pre-acid treated Ti-substrate at the rate of 1500 rpm for 60 s and baked in an oven at 80 °C for 30 min. This deposition and baking cycle was repeated for 10 times and finally the resultant film was muffled at 400 °C for 10 min at ramping rate of 1 °C min−1.

2.3. Characterization of anodes

The micro-morphology and the elemental composition of the coatings were characterized by scanning electron microscope (FE-SEM, Zeiss Supra55vp, Germany) with energy dispersive X-ray spectroscope (EDS-Bruker X-Flash-SDD-5010, Germany). X-ray diffraction (XRD, Adv D8, Germany) was performed under ambient conditions over the 2θ region of 20–80° at a rate of 5° min−1.

2.4. Electrochemical experiments

Electrochemical measurements were performed using electrochemical workstation (CHI 660E, China) in a conventional three-electrode cell. The prepared Ti/Sb–SnO2-honeycomb and Ti/Sb–SnO2-network electrodes served as the working electrodes, while a platinum sheet (20 mm × 20 mm) and saturated calomel electrode (SCE) were used as counter and reference electrodes, respectively. Na2SO4 solution (0.1 M) was used as electrolyte. Linear sweep voltammetry (LSV) measurements were performed with a sweep speed of 50 mV s−1 to find out the oxygen evolution potential. Cyclic voltammetry (CV) was performed to test the voltammetric charge and electroactive sites of electrodes with the potential region of 0.6 V to 0.8 V at different sweep rates (5.0 mV s−1 to 200 mV s−1). Electro-chemical impedance spectroscope (EIS) was conducted in the range of 104 to 10−1 Hz and at a potential of 1.9 V (vs. SCE) with an amplitude signal of 5 mV. Before each measurement, the system was stabilized at open circuit voltage for 5–10 min.

The oxidation of Rhodamine B (RhB) was performed in a two-electrode system cell under galvanostatic conditions at room temperature with a potentiostat/galvanostat (DH 1720A-6, China). The prepared hierarchical porous Ti/Sb–SnO2 electrodes were used as anodes with a working geometric area of 4.5 cm2 and Ti sheet of the same size was used as cathode. The effects of pH, current density, and different RhB concentrations were considered as the influencing parameters and an exact volume of 45 mL of dye solution was used in each experiment. Samples were collected from the cell at various intervals for chemical analysis. All the experiments were repeated three times for accurate results and the error is within 5%. The solution pH was determined by a microprocessor pH meter (PHSJ-4F, China) and the electric current was provided by DC power supply with a constant current control mode. Constant plate distance (5 mm) was adopted for all the experiments with supporting electrolyte (0.1 M Na2SO4 + 0.01 M NaCl). A UV-visible spectrophotometer (UV 1800, China) was used to follow the absorption spectral change of the dye during electrochemical reactions. The maximum absorption peak of the dye solution was 554 nm. The RhB removal efficiency was calculated by using eqn (4).

 
image file: c5ra02838h-t1.tif(4)
where RhB0 and RhBt are the average absorbance before electrolysis and after an electrolysis time t, respectively.

The kinetic of RhB removal behavior follows the well known pseudo first order kinetic as following eqn (5).

 
In(C0/C) = kt (5)
where C0 is the initial concentration of RhB, C is the concentration of RhB at given time t, and k is the kinetic rate constant which can be determined analytically from the slope of the concentration vs. time plot.

3. Results and discussion

3.1. Structural characterization

3.1.1. SEM characterization. Fig. 2(a and b) presents the morphology of hierarchically porous Ti/Sb–SnO2-honeycomb, and the uniform distribution of pores on entire surface of Ti sheet is clearly seen by the SEM images. The calculated average pore size in honeycomb structure is about 268 nm with a wall thickness of 64 nm. This honeycomb like appearance is achieved by the deposition of the mixture of SiO2 spheres and Sb–SnO2 solution. During spin coating, the mixture solutions arrange themselves smoothly in different layers on the Ti-sheet. There is a strong interaction between silica sphere and Sb–SnO2 solution, which make them to bind in smooth multiple layers. The Sb–SnO2 hindered the silica spheres to move away and thus give rise to a compact layered arrangement on the substrate. By the removal of silica template, Sb–SnO2 is left behind in the form of honeycomb like architecture with remarkable porosity.
image file: c5ra02838h-f2.tif
Fig. 2 SEM micrographs of hierarchically porous Ti/Sb–SnO2-honeycomb (a and b) and Ti/Sb–SnO2-network (c and d).

Fig. 2(c and d) shows the successful development of the hierarchically porous Ti/Sb–SnO2-network structure. The calculated average pore size in network structure is about 192 nm with wall thickness of 25 nm. It can be seen that the network is homogenously distributed on the entire surface of the substrate, and the layer by layer porous network is wavy and rough in multiple directions with high fidelity. The development of such network is achieved by spin coating of the silica spheres and Sb–SnO2 solution separately on Ti-substrate. During the high speed spin coating of SiO2 spheres, the layer by layer rough arrangement in multiple directions take place. When Sb–SnO2 solution is coated on substrate in second step, it filled the inter-spaces roughly and the remaining solution is spinning out because the interaction between silica spheres and Sb–SnO2 sol is not as strong as that in the case of Ti/Sb–SnO2-honeycomb. Finally, the removal of template caused a network like appearance on electrode surface. The pore size of Ti/Sb–SnO2-network is 1.4 times smaller than that of Ti/Sb–SnO2-honeycomb and the porosity over the large surface area is much higher in case of Ti/Sb–SnO2-network. By creating these two hierarchically porous structures considerable large surface area and more electroactive sites are achieved. The guest molecules are expected to diffuse easily through the pore channels to react quickly with hydroxyl radical and could maximize the electrocatalyic performance.

3.1.2. XRD analysis. The crystal structures of Ti/Sb–SnO2, Ti/Sb–SnO2-honeycomb and Ti/Sb–SnO2-network electrodes were monitored by XRD. Fig. 3 depicts the XRD pattern of coated film on a flat titanium substrate. In addition to the Ti metal peaks from the substrate, some noticeable diffraction peaks are observed at 2θ = 33.9° and 51.8°, which are assigned to 101, and 211 planes of SnO2. Rutile structure of SnO2 can be indexed by these peaks. While for antimony oxide, no peak is detected, possibly due to the fact that only traces amount of the antimony was added in the sol–gel or antimony had been doped in the lattice of SnO2. For further confirmation of antimony, EDS analysis were performed.
image file: c5ra02838h-f3.tif
Fig. 3 XRD spectra of (a) Ti/Sb–SnO2 (b) Ti/Sb–SnO2-honeycomb (c) Ti/Sb–SnO2-network.
3.1.3. EDS analysis. EDS confirmed the presence of Sb, Sn, O, and Ti on the fabricated anode surface. X-ray dot-mapping was used to analyze the metal distribution on Ti/Sb–SnO2-honeycomb (Fig. 4) and Ti/Sb–SnO2-network film (Fig. 5). Fig. 4 and 5 depict the smooth distribution of the Sn, Sb, and O on the entire surface of Ti sheet. The inset table shows the molar ration of elements Sb, (0.17, 0.21) Sn, (1.77, 4.25) and O (23.86, 27.66) for Ti/Sb–SnO2-honeycomb and Ti/Sb–SnO2-network, respectively.
image file: c5ra02838h-f4.tif
Fig. 4 X-ray dot-mapping and EDS spectrum of Ti/Sb–SnO2-honeycomb.

image file: c5ra02838h-f5.tif
Fig. 5 X-ray dot-mapping and EDS spectrum of Ti/Sb–SnO2-network.

The EDS spectrum of coating of the hierarchically porous electrodes show the clear peaks of Sb, Sn and O on Ti substrate, indicating the well formation of the oxide mixture of Sb and Sn on the anode surface. Here, in the spectrum peak the presence of the Sb is confirmed which is undetectable in XRD due to limited amount of antimony in sol–gel. The inset (Fig. 4 and 5) shows the molar ration of antimony, which is about 0.17% and 0.21% for Ti/Sb–SnO2-honeycomb and Ti/Sb–SnO2-network, respectively, which is too less to be detected by XRD.

3.2. Electrochemical properties

The electrochemical experiments were performed to analyze the advantages of hierarchically porous anodes over conventional one.
3.2.1. Linear sweep voltammetry measurements. In order to explore the impact of developed hierarchically porous structures, oxidation evolution potential (OEP) is recorded by linear sweep voltammetry (LSV). The electrochemical oxidation ability can be assessed at the rate of OEP value.20 The OEP of Ti/Sb–SnO2-honeycomb and Ti/Sb–SnO2-network is examined and compared with Ti/Sb–SnO2. As shown in Fig. 6, OEP for Ti/Sb–SnO2 is 2.2 V, comparable to what previously reported, 2.16 V.9 For Ti/Sb–SnO2-honeycomb and Ti/Sb–SnO2-network, 2.60 V and 2.76 V are recorded, respectively. Obviously the OEP has been boosted up 1.18 V and 1.25 V for Ti/Sb–SnO2-honeycomb and Ti/Sb–SnO2-network, respectively, compared with conventional one. This can be ascribed to the porous morphology and the enhanced oxygen vacancies of the porous oxide film. The hierarchically porous material with high surface area provides more active sites for reaction, while the conventional electrode with low surface area and low adsorption ability cannot be so efficient in this respect. Actually, the high OEP meant low side reactions of oxygen formation with high current efficiency, which would benefit to promote the electrocatalytic oxidation efficiency of pollutants.21 And it also facilitates the HO˙ production for stronger catalytic reactivity.22 On the basis of increased OEP values for fabricated structures, it is expected that the oxidation ability and the catalytic activity of developed hierarchically porous electrodes are enhanced.
image file: c5ra02838h-f6.tif
Fig. 6 LSV curves of Ti/Sb–SnO2, Ti/Sb–SnO2-honeycomb, and Ti/Sb–SnO2-network in 0.1 M Na2SO4 solution at a scan rate of 50 mV s−1.
3.2.2. Roughness factor and voltammetric charge analysis. Roughness factor (Rf) is the electrocatalytic activity determining factor, which is the real surface area per geometrical area of the electrode. It can be calculated by comparing the determined capacitance of the electrode with the capacitance of smooth oxide surface.23 The relative Rf of the prepared anodes is estimated by cyclic voltammetric (CV) curves between 0.6 to 0.8 V in one compartment electrochemical cell. Fig. 7 presents the current densities at 0.7 V, the point (E = 0.7 V) at which approximate symmetry of cathodic and anodic current is observed, for hierarchically porous and conventional electrode. The inset (Fig. 7) presents several cyclic voltammograms recorded between the potential ranges of 0.6 to 0.8 V at various sweep rates in an aqueous solution of 0.1 M Na2SO4 versus SCE. In contrast to the Ti/Sb–SnO2, the Rf of Ti/Sb–SnO2-honeycomb is enhanced from 38.80 to 71.41 and for the Ti/Sb–SnO2-network further boosted upto 144.80. Thus, the Rf of the hierarchically porous electrodes is improved, implying the real surface area per geometric area has been increased. This increase in surface area for hierarchically porous electrodes indicates the improved electrocatalytic activity. The values of the capacitance and Rf for all the electrodes are listed in Table 1.
image file: c5ra02838h-f7.tif
Fig. 7 Evaluation of the current density at 0.7 V vs. SCE for Ti/Sb–SnO2, Ti/Sb–SnO2-honeycomb, and Ti/Sb–SnO2-network. The inset is cyclic voltammograms between 0.6 V and 0.8 V at different sweep rates in 0.1 M Na2SO4 solution.
Table 1 Capacitance and roughness factor for the Ti/Sb–SnO2, Ti/Sb–SnO2-honeycomb, and Ti/Sb–SnO2-network
Electrode Capacitance (μ F cm−2) Rf
Ti/Sb–SnO2 2328 38.80
Ti/Sb–SnO2-honeycomb 4285 71.41
Ti/Sb–SnO2-network 8685 144.8


The voltammetric charge (q*) determines the electrocatalytic performance of the electrode, which is directly related to the electroactive sites and the real surface area. Voltammetric charge (q*) is inversely proportional to the scan rate (v). That means, by increasing the scan rate, voltammetric charge will be decreased. This is due to the approach of the electrolyte species becomes more difficult to the inner region of the oxide film.24 Total voltammetric charge (q*T) is the entire electroactive surface of the electrode, which is obtained when scan rate (v) tends to be zero. Outer voltammetric charge (q*0) is the most accessible region, which can be determined when scan rate (v) is infinity. On the other hand, the inner voltammetric charge (q*I) is less accessible electroactive sites, which is calculated by subtracting the total (q*T) and outer voltammetric charge (q*0). The relation between inner charge (q*I) and the total voltammetric charge (q*T) is defined as the electrochemical porosity q*I/q*T.24 The total voltammetric charge (q*T) is obtained through plotting the reciprocal of (q*) against the square root of the potential scan rate (eqn (6)).25

 
(q*)−1 = (q*T)−1 + kv1/2 (6)

The outer voltammetric charge (q*0), is obtained by the plot of (q*) vs. v−1/2 as follows (eqn (7)).26

 
q* = (q*0) + kv−1/2 (7)

The total voltammetric charges (q*T) and outer voltammetric charge (q*0) for the hierarchically porous and conventional electrode are studied as a function of different scan rates (v) as presented in Fig. 8(a and b). The values of the charges and electrochemical porosity for hierarchical and conventional electrode are listed in Table 2.


image file: c5ra02838h-f8.tif
Fig. 8 (a) Extrapolation of (q*T) for Ti/Sb–SnO2, Ti/Sb–SnO2-honeycomb, Ti/Sb–SnO2-network, from the representation of (q*)−1 versus v1/2 (b) extrapolation of (q*0) for Ti/Sb–SnO2, Ti/Sb–SnO2-honeycomb, Ti/SnO2–Sb-network from the representation of (q*) versus v−1/2 data obtained from the cyclic voltammograms obtained between 0.5–2.5 V versus SCE at various scan rates in a 0.1 M Na2SO4 solution.
Table 2 Total, outer, inner charge values and porosity for the Ti/Sb–SnO2, Ti/Sb–SnO2-honeycomb, and Ti/Sb–SnO2-network
Electrode q*T (mC cm−2) q*0 (mC cm−2) q*I (mC cm−2) q*I/q*T
Ti/Sb–SnO2 3.00 0.52 2.48 0.82
Ti/Sb–SnO2-honeycomb 7.46 0.81 6.43 0.89
Ti/Sb–SnO2-network 11.96 1.12 10.84 0.91


It can be seen in Fig. 8(a and b) that the electrochemical surface area and the porosity for the hierarchically porous anodes are higher than that of conventional one. With the increase in the total charge (q*T), the values of inner charge (q*I) and porosity are also increased. The values of q*T, q*I, and porosity for Ti/Sb–SnO2-network are 3.98, 4.37, 1.1 times than that of Ti/Sb–SnO2 and they are 1.60, 1.68, and 1.02 times as large as that of Ti/Sb–SnO2-honeycomb, respectively. These results indicate that the Ti/Sb–SnO2-network and Ti/Sb–SnO2-honeycomb are highly porous, having higher entire electrochemical surface area for the generation of hydroxyl radicals as compared to Ti/Sb–SnO2. Therefore, the pollutant molecules can easily be diffused into the channels of these porous structures to achieve fast electrocatalytic reaction.

3.2.3. Electrochemical impedance spectroscopy (EIS). Fig. 9 shows the electrochemical impedance spectrum (EIS) of Ti/Sb–SnO2, Ti/Sb–SnO2-honeycomb, and Ti/Sb–SnO2-netwok. In order to analyze EIS spectra, the equivalent circuit was used to fit, and to model the EIS behavior as shown in the inset (Fig. 9), and the simulation parameters are depicted in Table 3. Nyquist plots for all electrodes are characterized by resistance in higher frequency region and depressed capacitive–resistive semicircle in middle-low frequency region. In this model R1 is the resistance in high frequency region which represents the resistance of the solution. CPE2 is the constant phase element that is depressed semicircle in middle-low frequency region, while R2 is the charge transfer resistance in the equivalent circuit. In Fig. 9 the smallest depressed semicircular arc reveals the best electron transfer ability by the Ti/Sb–SnO2-network. The R2 values of the Ti/Sb–SnO2, Ti/Sb–SnO2-honeycomb, and Ti/Sb–SnO2-network are 180, 89.7, and 66.5 ohm, respectively (Table 3). The charge transfer resistance (89.7, 66.5 ohm) for hierarchically porous anode is much less than that of conventional one, which indicates the enhanced electrochemical activity of the Ti/Sb–SnO2-honeycomb and Ti/Sb–SnO2-network.
image file: c5ra02838h-f9.tif
Fig. 9 Electrochemical impedance spectra (Nyquist plots) of Ti/Sb–SnO2, Ti/Sb–SnO2-honeycomb, and Ti/Sb–SnO2-network. The inset is corresponding equivalent circuit model.
Table 3 EIS fitting results of Ti/Sb–SnO2, Ti/Sb–SnO2-honeycomb, and Ti/Sb–SnO2-network
Electrode R1 (ohm) R2 (ohm) CPE2 (F) N
Ti/Sb–SnO2 22.7 180 7.89 × 10⁻² 0.81
Ti/Sb–SnO2-honeycomb 2.34 89.7 1.27 × 10⁻¹ 0.80
Ti/Sb–SnO2-network 7.59 66.5 6.99 × 10⁻² 0.70


These results are consistent with the results of the previous section that the active electrochemical surface area/porosity (voltammetric charge) and roughness factor of the hierarchically porous anodes are higher than that of conventional one. From these facts the considerable high electrochemical activity of the hierarchically porous Ti/Sb–SnO2-honeycomb and Ti/Sb–SnO2-network is expected.

3.3. Electrochemical degradation analysis

3.3.1. Voltammetric characteristics. Cyclic voltammograms are recorded for the Ti/Sb–SnO2-honeycomb and Ti/Sb–SnO2-network in blank as well as in RhB solution as shown in Fig. 10. As no other peak is appeared in the presence of RhB which indicates that direct electron transfer does not occur between the anodes and dye during the electrochemical oxidation process. Therefore, the degradation of RhB must be achieved via oxygen mediated by hydroxyl radicals27 and/or active chloride28 originating from electrolysis.
image file: c5ra02838h-f10.tif
Fig. 10 Cyclic voltammograms of Ti/Sb–SnO2-honeycomb and Ti/Sb–SnO2-network in the presence and absence of RhB (scan rate: 100 mV; initial concentration of RhB: 100 mg L−1; supporting electrolyte: 0.1 M Na2SO4).
3.3.2. Comparison of hierarchically porous with conventional electrode. Fig. 11 shows the degradation of the RhB on Ti/Sb–SnO2-honeycomb, and Ti/Sb–SnO2-network, and their counterpart conventional Ti/Sb–SnO2 as a function of time. It can be seen, that the degradation efficiency of RhB is significantly improved by the hierarchically porous structures. The kinetic rate constant for Ti/Sb–SnO2-network, Ti/Sb–SnO2-honeycomb, and Ti/Sb–SnO2 are 19.7 × 10⁻², 9.2 × 10⁻², and 4.2 × 10⁻² min−1, respectively. These values indicate that the degradation of RhB is much faster by hierarchically porous anodes as compared to the conventional one. The value of k for Ti/Sb–SnO2-network, and Ti/Sb–SnO2-honeycomb are 4.7 and 2.2 times higher, respectively, than that of Ti/Sb–SnO2.
image file: c5ra02838h-f11.tif
Fig. 11 Comparison of degradation of the RhB by hierarchically porous Ti/Sb–SnO2-honeycomb, Ti/Sb–SnO2-network and Ti/Sb–SnO2 electrode (current density: 30 mA cm−2; initial pH: 3.0; initial concentration of RhB: 100 mg L−1; supporting electrolyte: 0.1 M Na2SO4 + 0.01 M NaCl).

On the other hand, after 20 min of degradation under same conditions, the removal rate of RhB on Ti/Sb–SnO2-honeycomb and Ti/Sb–SnO2-network is 84.8% and 98.02%, respectively, which is much higher than Ti/Sb–SnO2 (58.3%). These results demonstrate a good degradation capacity of developed hierarchically porous anodes. The removal efficiency is enhanced up to 26% and 40% by Ti/Sb–SnO2-honeycomb and Ti/Sb–SnO2-network. This improved catalytic activity of fabricated anodes is essentially attributed to the hierarchically porous structural property. The increased active surface area of the electrodes is a significant component for the enhancement of electrocatalyic activity. As discussed in previous section that the Rf values of the Ti/Sb–SnO2-honeycomb and Ti/Sb–SnO2-network are much higher than the conventional one (Table 1), which confirms the improved catalytic activity by hierarchically porous structures. In addition, having large surface area, the Ti/Sb–SnO2-honeycomb and Ti/Sb–SnO2-network electrodes also possess abundant electroactive sites with remarkable porosity for the fast electrocatalytic reaction. The high OEP of developed hierarchical electrodes is another strong factor to evaluate this fast electrocatalytic oxidation. Consequently, the Ti/Sb–SnO2-honeycomb and Ti/Sb–SnO2-network are highly energy efficient to generate the HO˙ radicals effectively, and the pore channels of the fabricated anodes cause the quick diffusion of the pollutant molecules in hierarchically porous surface which react rapidly with the generated HO˙ radicals resulting in enhanced electrocatalytic degradation.

3.3.3. Effect of current density. Current density plays a significant role in electrochemical oxidation process. The degradation of RhB is explored at different current densities in the range of 10–50 mA cm−2. Fig. 12(a and b) shows that the increase in the current density leads to faster degradation process which is due to the fact that the HO˙ radical production from water oxidation is directly proportional to the applied current, and the formed HO˙ radical reacts with the dye molecules quickly to degrade it.29 It can be seen (Fig. 12) that the color is almost totally disappeared at about 40 and 30 min for Ti/Sb–SnO2-honeycomb and Ti/Sb–SnO2-network, respectively. However, an irregular behavior is also observed that the rate of degradation becomes less efficient as the current density increases from 30 to 50 mA cm−2. There are two possibilities for this behavior. Firstly, some undesirable side reaction and the electrolysis of water may compete with the electrochemical oxidation of the dye.30 Secondly, the limited mass transfer of the dye from bulk solution to the electrode surface may take place which leads to lowering down the degradation efficiency.31 The rate constant values (k, min−1) at current densities of 50, 30, 20, and 10 mA cm−2 are 6.4 × 10⁻², 5.8 × 10⁻², 1.4 × 10⁻² and 1.2 × 10⁻² min−1 for Ti/Sb–SnO2-honeycomb and 13.5 × 10⁻², 13.1 × 10⁻², 2.3 × 10⁻², and 1.4 × 10⁻² min−1 for Ti/Sb–SnO2-network, respectively (Table 4). The maximum degradation efficiency is obtained at current density of 30 mA cm−2 for both, Ti/Sb–SnO2-honeycomb and Ti/Sb–SnO2-network, furthermore, the degradation by Ti/Sb–SnO2-network (30 mA cm−2) is 2.04 times faster than that of Ti/Sb–SnO2-honeycomb.
image file: c5ra02838h-f12.tif
Fig. 12 Degradation of RhB at different current densities (a) Ti/Sb–SnO2-honeycomb (b) Ti/Sb–SnO2-network (initial concentration of RhB: 100 mg L−1; initial pH: 3.0; supporting electrolyte: 0.1 M Na2SO4 + 0.01 M NaCl).
Table 4 Rate constant values for RhB degradation over Ti/Sb–SnO2-honeycomb and Ti/Sb–SnO2-network at different experimental parameters
Parameters   Ti/Sb–SnO2-honeycomb (k, min−1) Ti/Sb–SnO2-network (k, min−1)
Initial concentration (mg L−1) 100 7.9 × 10⁻² 21.3 × 10⁻²
150 2.7 × 10⁻² 3.5 × 10⁻²
200 1.2 × 10⁻² 2.6 × 10⁻²
pH (C0 = 100 mg L−1) 3.0 7.9 × 10⁻² 21.3 × 10⁻²
7.0 3.9 × 10⁻² 6.1 × 10⁻²
11 1.0 × 10⁻² 3.2 × 10⁻²
Current density (mA cm−2) 50 6.4 × 10⁻² 13.5 × 10⁻²
(C0 = 100 mg L−1, pH = 3.0) 30 5.8 × 10⁻² 13.1 × 10⁻²
20 1.4 × 10⁻² 2.3 × 10⁻²
10 1.2 × 10⁻² 1.4 × 10⁻²


3.3.4. Effect of RhB concentration. Fig. 13(a and b) shows the rate of degradation at different concentrations of RhB at the range of 100–200 mg L−1. It can be seen that at 100 mg L−1 complete degradation is achieved in 25–30 min, while at the concentration of 200 mg L−1 degradation is accomplished in 80–90 min by Ti/Sb–SnO2-honeycomb and Ti/Sb–SnO2-network, respectively. It shows that, with the increase in the initial concentration, the degradation efficiency is decreased. This decrease in efficiency might be due to the consumption of the hydroxyl radical by the intermediates at higher dye concentration. In such condition, more molecules of dye attracted towards the anode surface and occupy the active sites of the electrodes, thereby the production of the hydroxyl radical is reduced, which causes to lower down the removal efficiency.29 On the other hand, when the dye is initially less concentrated, the oxidation process goes on faster than diffusion.27 At higher initial concentration, there are not enough hydroxyl radical generated to react with the dye molecules and the degradation rate is lowered down. Another important factor can be seen (Fig. 13) that at the concentration of 200 mg L−1 complete degradation is achieved and no further dye is left behind. Therefore, the fabricated hierarchically porous structures are very effective for the complete degradation at higher concentration. The rate constant values (k, min−1) at 100, 150, and 200 mg L−1 of RhB are 7.9 × 10⁻², 2.7 × 10⁻², and 1.2 × 10⁻² min−1 for Ti/Sb–SnO2-honeycomb and 21.3 × 10⁻², 3.5 × 10⁻², and 2.6 × 10⁻² min−1 for Ti/Sb–SnO2-network, respectively. These values shows that the maximum degradation occurs at 100 mg L−1, which is 2.69 times faster by Ti/Sb–SnO2-network compared to Ti/Sb–SnO2-honeycomb, as listed in Table 4.
image file: c5ra02838h-f13.tif
Fig. 13 Degradation at different initial concentration of the RhB (a) Ti/Sb–SnO2-honeycomb (b) Ti/Sb–SnO2-network (current density: 30 mA cm−2; initial pH: 3.0; supporting electrolyte: 0.1 M Na2SO4 + 0.01 M NaCl).
3.3.5. Effect of solution pH. The pH of the solution is one of the crucially important factors influencing the oxidation process in many aspects like, it controls generation of hydroxyl radical, and it may change the configuration of the target species or co-existing ions, and also the surface charge in the contaminated water. The effect of the initial pH of the medium on oxidation process is investigated in the range of acidic, neutral, and basic conditions (3.0–7.0–11.0). As from Fig. 14(a and b) at acidic condition the degradation of the dye is completed in 25–20 min and at neutral condition 30–30 min for Ti/Sb–SnO2-honeycomb and Ti/Sb–SnO2-network electrode, respectively. The degradation in acidic condition is much faster than in basic condition. It is commonly known that high pH of the solution is favorable for the OEP and also for the HO˙ radical production at anode surface29 eqn (8) and (9).
 
2HO˙ → O2 + 2H+ + 2e (8)
 
2H2O → O2 + 4H+ + 4e (9)

image file: c5ra02838h-f14.tif
Fig. 14 Degradation at different initial pH of the RhB (a) Ti/Sb–SnO2-honeycomb (b) Ti/Sb–SnO2-network (current density: 30 mA cm−2; initial concentration of RhB: 100 mg L−1; supporting electrolyte: 0.1 M Na2SO4 + 0.01 M NaCl).

But during this process, the great amount of oxygen bubbles adsorbed at the anode surface hinder the contact of the dye molecules with the catalyst, and thereby lower down the degradation at basic condition, which is similar to what previously reported.32 It can also be seen (Fig. 14) that in case of acidic medium initially, the removal efficiency is very high, and within 10 min about 75% removal is achieved but gradually the electrolysis efficiency is lowered down. Actually the life time of the HO˙ radical is very short (only few nanoseconds). At the initial time, the concentration of the dye molecules around the anode is higher with more probability to collide with the HO˙ radical efficiently, which causes faster removal of RhB.

The gradual decrease in degradation efficiency can be attributed as, the residual concentration of the dye molecules and its distribution speed is decreased as the time proceeds. It is also possible that the reaction of by product molecules with HO˙ radical hinders the RhB to react with hydroxyl radical, which makes the removal rate slower. From this study the higher degradation of the dye is achieved from both Ti/Sb–SnO2-honeycomb and Ti/Sb–SnO2-network electrodes at acidic and neutral medium as compared to the basic condition. The values of rate constant (k, min−1) for Ti/Sb–SnO2-honeycomb is 7.9 × 10⁻², 3.9 × 10⁻², and 1.0 × 10⁻² min−1 and for Ti/Sb–SnO2-network is 21.3 × 10⁻², 6.1 × 10⁻², and 3.2 × 10⁻² min−1 at different pH values (3.0, 7.0, 11.0) respectively, as listed in Table 4.

4. Conclusions

In this work, two kinds of hierarchically porous architectures Ti/Sb–SnO2-honeycomb and Ti/Sb–SnO2-network anodes were fabricated. The adequate dimensions and compact arrangement of building blocks resulted in significant high porosity and enhanced electroactive sites in the obtained structures. The prepared hierarchical anodes had low mass transfer resistance, high oxygen evolution potential, and large surface area, which led to enhance the electrocatalytic degradation of RhB under different possible parameters compared with the conventional one. Such significantly improved electrocatalytic performance could be attributed to the following two aspects. Firstly, the high porosity and effective large surface area of electrode caused to increase the active sites for radical generation and contaminant oxidation, which enhanced the reactivity of the catalyst towards electrochemical oxidation process. Secondly, the hierarchical anode surface promoted the diffusion of incoming contaminant molecules in the porous channels which increased the possibility of collision between generated HO˙ radical and contaminant molecules, resulting in faster degradation process.

In short, these facts could be summarized as, this facile architecture fabrication process led towards the efficient electrocatalytic activity which held great potential for the application in aquatic pollutant removal. Most importantly, this study demonstrated a new perspective for the designing and fabrication of advanced and interesting structured electrodes with improved catalytic activity towards contaminated water treatment.

Acknowledgements

This work was supported by the “Western Light” Program of Chinese Academy of Sciences (XBBS201410), the National Nature Science Foundation of China (Grant no. 21173261), the “One Hundred Talents Project Foundation Program” of Chinese Academy of Sciences, the “Cross-Cooperation Program for Creative Research Teams” of Chinese Academy of Sciences, the CAS “Western Action Plan” (KGZD-EW-502), and the High-Technology Research & Development Project of Xinjiang Uyghur Autonomous Region (201415110).

Notes and references

  1. Y. Feng, Y. Cui, B. Logan and Z. Liu, Chemosphere, 2008, 70, 1629 CrossRef CAS PubMed; S. Ding, J. S. Chen and G. Qi, J. Am. Chem. Soc., 2010, 133, 21 CrossRef PubMed; J. Niu, H. Lin and J. Xu, Environ. Sci. Technol., 2012, 46, 10191 Search PubMed.
  2. J. Zhang, T. Nakai and M. Uno, Carbon, 2014, 70, 207 CrossRef CAS PubMed.
  3. C. L. Liu, W. S. Dong and G. P. Cao, J. Electroanal. Chem., 2007, 611, 225 CrossRef CAS PubMed.
  4. M. Panizza, P. A. Michaud and G. Cerisola, Electrochem. Commun., 2001, 3, 336 CrossRef CAS.
  5. M. Panizza and G. Cerisola, Appl. Catal., B, 2007, 75, 95 CrossRef CAS PubMed.
  6. J. Chenga, H. Zhanga and G. Chena, Electrochim. Acta, 2009, 54, 6250 CrossRef PubMed.
  7. F. Regisser, M. A. Lavoie and G. Y. Champagne, J. Electroanal. Chem., 1996, 415, 47 CrossRef CAS.
  8. H. He, H. Dai and C. T. Au, Catal. Today, 2004, 90, 245 CrossRef CAS PubMed.
  9. L. Zhang, L. Xua and J. Hec, Electrochim. Acta, 2014, 117, 192 CrossRef CAS PubMed; H. Ana, H. Cui and W. Zhang, Chem. Eng. J., 2012, 209, 86 CrossRef PubMed.
  10. B. Wang, W. Kong and H. Ma, J. Hazard. Mater., 2007, 146, 295 CrossRef CAS PubMed.
  11. Y. Fenga, Y. Cuia and J. Liua, J. Hazard. Mater., 2010, 178, 29 CrossRef CAS PubMed; H. Xu, A. Li and X. Cheng, Int. J. Electrochem. Sci., 2011, 6, 5114 Search PubMed.
  12. H. M. Villullas, F. I. Mattos-Costaa and P. A. P. Nascenteb, Electrochim. Acta, 2004, 49, 3909 CrossRef CAS PubMed; G. Chen and P. L. Yue, J. Phys. Chem. B, 2002, 106, 4364 CrossRef; F. H. Oliveira, M. E. Osugi and F. M. M. Paschoal, J. Appl. Electrochem., 2007, 37, 583 CrossRef PubMed.
  13. C. Tan, B. Xiang and Y. Li, Chem. Eng. J., 2011, 166, 15 CrossRef CAS PubMed.
  14. H. Wang and A. L. Rogach, Chem. Mater., 2013, 26, 123 CrossRef.
  15. P. Yang, T. Deng and D. Zhao, Science, 1998, 282, 2244 CrossRef CAS.
  16. A. Magasinski, P. Dixon and B. Hertzberg, Nat. Mater., 2010, 9, 353 CrossRef CAS PubMed; B. G. Choi, Y. S. Huh and W. H. Hong, Nanoscale, 2013, 5, 3976 RSC.
  17. Y. Li, Z. Fu and B. Su, Adv. Funct. Mater., 2012, 22, 4634 CrossRef CAS.
  18. C. M. A. Parlett, K. Wilson and A. F. Lee, Chem. Soc. Rev., 2013, 42, 3876 RSC.
  19. J. Fan, G. Zhao and H. Zhao, Electrochim. Acta, 2013, 94, 21 CrossRef CAS PubMed.
  20. D. Shao, X. Li and H. Yu, RSC Adv., 2014, 4, 21230 RSC.
  21. F. H. Oliveira, M. E. Osugi and F. M. M. Paschoal, J. Appl. Electrochem., 2007, 37, 583 CrossRef CAS PubMed.
  22. S. p. Tong, C. A. Ma and H. Fen, Electrochim. Acta, 2008, 53, 3002 CrossRef CAS PubMed; F. L. Moralesa, P. Castillob and M. A. Garcíaa, ECS Trans., 2013, 47, 35 CrossRef PubMed.
  23. T. Duan, Q. Wen and Y. Chen, J. Hazard. Mater., 2014, 280, 304 CrossRef CAS PubMed; D. Santos, M. J. Pacheco and A. Lopes, J. Appl. Electrochem., 2013, 43, 401 CrossRef.
  24. J. Gaudet, A. Tavares and S. Trasatti, Chem. Mater., 2005, 17, 1570 CrossRef CAS; F. Montilla, E. Morallon and A. D. Battisti, J. Phys. Chem. B, 2004, 108, 5036 CrossRef.
  25. C. Pauli and S. Trasatti, J. Electroanal. Chem., 1995, 396, 161 CrossRef.
  26. L. Xua and J. D. Scantlebury, J. Electrochem. Soc., 2003, 150, 288 CrossRef PubMed.
  27. J. Aquino, K. Romeu and C. Rocha-Filho, Quim. Nova, 2010, 33, 2124 CrossRef CAS PubMed.
  28. D. Reyter, D. B. langer and L. Roue, Water Res., 2010, 44, 1918 CrossRef CAS PubMed.
  29. A. Carlos, M. Huitle and S. Ferro, Chem. Soc. Rev., 2006, 35, 1324 RSC.
  30. B. Marselli, J. G. Gomez and P. A. Michaud, J. Electrochem. Soc., 2003, 150, 79 CrossRef PubMed.
  31. X. Chen, G. Chen and P. L. Yue, Chem. Eng. Sci., 2003, 58, 995 CrossRef CAS.
  32. M. Panizza and G. Cerisola, Ind. Eng. Chem. Res., 2008, 47, 6816 CrossRef CAS.

Footnote

Electronic supplementary information (ESI) available: The degradation of 2,4-dichlorophenol is supplied in Fig. S1. See DOI: 10.1039/c5ra02838h

This journal is © The Royal Society of Chemistry 2015
Click here to see how this site uses Cookies. View our privacy policy here.