A novel method for kinetics analysis of pyrolysis of hemicellulose, cellulose, and lignin in TGA and macro-TGA
Hui Zhou,
Yanqiu Long,
Aihong Meng,
Shen Chen,
Qinghai Li and
Yanguo Zhang*
Key Laboratory for Thermal Science and Power Engineering of Ministry of Education, Department of Thermal Engineering, Tsinghua University, Beijing 100084, P. R. China. E-mail: zhangyg@tsinghua.edu.cn; Tel: +86 10 6278 3373
First published on 3rd March 2015
Abstract
The pyrolysis of three biomass components (hemicellulose, cellulose and lignin) was investigated in both a thermogravimetric analyzer (TGA) and self-designed macro-TGA. Slow and fast pyrolysis experiments were carried out in the macro-TGA. A novel peak analysis-least square method (PA-LSM) was developed to analyze the kinetics. The results showed that a complex pyrolysis reaction could be described by a series of parallel reactions, and each reaction could be described by a Gaussian peak. The kinetic parameters could be calculated via the least square method, and the Gaussian peak could be simulated very well. The slow pyrolysis in the TGA and macro-TGA is different, because of the heat transfer process. The pyrolysis and fast pyrolysis in macro-TGA also had considerable differences.
Introduction
With the energy shortage and global warming crisis, biomass, such as wood and agricultural waste, is regarded as a promising energy to ease these two issues. The thermochemical conversion of biomass, including incineration, pyrolysis and gasification is a research topic that has obtained increasing attention. Pyrolysis is regarded as the fundamental process of thermal chemical conversion of biomass.1 Through pyrolysis, syngas, oil, and char can be generated and further used as transportation fuels or chemical materials.2There are three main components of biomass, i.e. hemicellulose, cellulose, and lignin.3,4 Generally, hemicellulose accounts for 16–23% wt%; cellulose accounts for 42–49 wt%; while lignin accounts for 21–39 wt% of biomass.5
A fundamental study of pyrolysis kinetics can help us to predict the pyrolysis behavior of biomass materials as well as design efficient pyrolytic reactors for engineering applications.6,7 Several models have been developed to study the kinetics of biomass pyrolysis, such as single reaction model, segmented reaction model, and distributed activation energy model (DAEM). Single reaction model is the original and simplest model, which is suitable to describe single-step reactions, but has difficulties to simulate complex multi-step reactions such as the pyrolysis of real biomass.8 The segmented reaction model is widely used in recent years, which divided a complicated reaction into several steps according to temperature range.9 However, the kinetic parameters are sensitive to temperature demarcation point, while the temperature demarcation point is usually determined with subjectivity. In addition, it is supposed that only one reaction happens in one temperature range, which is not scientific sometimes. The DAEM is the up-to-date method for modelling the thermal decomposition of biomass.10,11 The method assumes that a series of irreversible first order parallel reactions occur simultaneously, which have a range of activation energies.7 Nevertheless, the activation energies are described as tens of numbers and even a figure, which makes them difficult to utilize and compare.12
Thermogravimetric analyzer (TGA) is the most common apparatus to study kinetics of biomass pyrolysis.13,14 Many researchers chose derivative thermogravimetric (DTG) curves to determine the kinetic parameters, because DTG curves are more convenient to identify the kinetic process. Meanwhile, DTG curves are more sensitive than TG curves, thus some changes in the TG curves will be magnified in the DTG curves.15,16
Under the ideal conditions, the pyrolysis kinetic parameters of a pure chemical reaction should be the same. However, for the research of thermochemical conversion of fuel, the kinetics parameters are apparent, which means it is usually related to the operation conditions. At this time, the main purpose of the kinetic parameters is to predict the reaction rate under specific conditions. In the TGA experiments, the temperature is elevated only after the samples are put in the TGA. Therefore, the heating rate is limited to tens of degrees per minute.17 The heating rate is known to have significant influence on the kinetic characteristics.18 Meanwhile, since the heat and mass transfer in TGA is ignored, the gap between TGA and real furnace is conspicuous.
In this paper, the pyrolytic kinetics of biomass components (hemicellulose, cellulose, and lignin) are investigated in the TGA and self-designed lab-scale macro-TGA. For the macro-TGA, slow pyrolysis and fast pyrolysis are both investigated. A novel peak analysis-least square method (PA-LSM) is applied to study the kinetics of biomass pyrolysis. In addition, the pyrolysis characteristics in different conditions are compared.
Materials and methods
Materials
Xylan (commonly representative of hemicellulose, from beech wood) and cellulose (microcrystalline) were obtained from Sigma-Aldrich. Lignin (dealkaline) used in this research was obtained from a dealkalization process of alkaline lignin provided by Tokyo Chemical Industry (TCI). The samples were in granular form with a size of less than 150 μm. Before the experiments, all the samples were dried at 105 °C to obtain the samples on a dry basis. The proximate and ultimate analyses of the samples are shown in Table 1. Cellulose shows the highest amount of volatile content, and no ash is found in cellulose. Lignin shows the highest amount of ash and fixed carbon content, and the sulfur content in lignin is also very high. The high volatile content of cellulose and high sulfur content of lignin have been reported by others.19,20| Samples | Proximate analysisd (%) | Ultimate analysisdaf (%) | ||||||
|---|---|---|---|---|---|---|---|---|
| A | V | FC | C | H | N | O | S | |
| a A: ash; V: volatile; FC: fixed carbon; d: dry basis; daf: dry ash free basis. | ||||||||
| Xylan | 2.11 | 78.57 | 19.33 | 39.18 | 6.32 | 0.00 | 54.50 | 0.01 |
| Cellulose | 0.00 | 95.21 | 4.79 | 44.51 | 6.25 | 1.29 | 47.93 | 0.01 |
| Lignin | 16.15 | 54.61 | 29.25 | 63.86 | 4.45 | 0.18 | 25.83 | 5.67 |
Thermogravimetric analysis
The TGA experiments were performed by a NETZSCH STA 449F with a flow rate of 100 mL min−1 of N2. Temperature rose from room temperature to 1000 °C at a heating rate of 10 °C min−1. Repeated experiments showed that TG curves had good reproducibility.Macro-TGA experiments
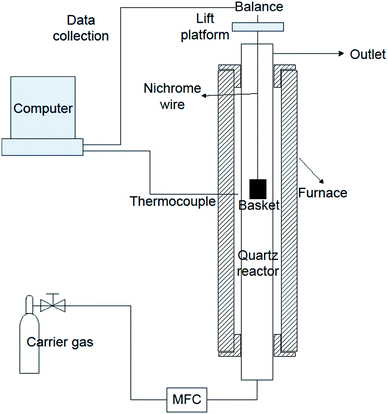
The samples investigated in TGA were also tested in a batch reactor (macro-TGA), shown in Fig. 1. The reaction system was composed of a pyrolysis reactor and a mass monitoring system. The pyrolysis reactor included a three-section furnace, a quartz reactor and a basket. During the experiment, approximate 1.5 g sample was placed in the basket, and the mass of the basket was monitored by a balance through the nichrome wire. The data of the balance and the temperature of the furnace could be collected by a computer online. During the experiment, N2 (1 L min−1) was used as carrier gas.Two types of experiments were carried out in macro-TGA: slow pyrolysis and fast pyrolysis. In the slow pyrolysis experiments, the basket loaded with the sample was first placed in the cold reactor. Then the furnace was heated from room temperature to 1000 °C at a heating rate of 10 °C min−1, which was consistent with that in TGA. In the fast pyrolysis experiments, the reactor was initially heated to the set point (800 °C). Once the temperature had stabilized, the sample was put into the hot zone of the reactor and rapidly pyrolysed. The reactor was kept at the reaction temperature until the mass of the sample was stabilized.
Before the experiments, blank test was carried out to obtain the background of the signal. For each pyrolysis experiment, the background signal was subtracted to obtain the real pyrolysis results. Repeated experiments showed that macro-TGA had good reproducibility for both slow pyrolysis and fast pyrolysis.
Kinetics analysis
Kinetics analysis of slow pyrolysis
The pyrolysis of the samples is too complex to be described by one single kinetic differential reaction. In the kinetic model of independent parallel reactions, the pyrolysis is regarded as a sum of several independent reactions, i.e.21
 | (1) |
To obtain the normalization result, αi is used to denote the normalized conversion of Reaction i, i.e.:
| αi = mi/mi∞ | (2) |
Since there are some peaks in the DTG curves of slow pyrolysis, imagining each reaction has a peak in DTG curve (including shoulder peak), peak analysis were applied to divide the overall reaction into several reactions. The progress of each reaction was regarded as a Gaussian peak, which is very common for peak analysis.22
The kinetics of each reaction can be expressed as:23,24
 | (3) |
 | (4) |
In the slow pyrolysis experiments, the heating rate β was constant:
 | (5) |
Thus,
 | (6) |
To calculate Ei, Ai, and ni, least square method (LSM) was used:
 | (7) |
 | (8) |
Kinetics analysis of fast pyrolysis
Since the process of fast pyrolysis is finished in a short time, many peaks of the slow pyrolysis will be coincident. The peak analysis can still be applied if necessary. The Avrami–Erofeev equation is widely used to describe the fast pyrolysis behavior.25,26 For each peak, it can be expressed by| 1 − αi = exp(−kiτni) | (9) |
Taking the natural logarithm of eqn (9) results in
| ln(1 − αi) = −kiτni | (10) |
Therefore, LSM can be used to determine the optimal ki and ni.
Results and discussion
Slow pyrolysis of xylan, cellulose and lignin in TGA
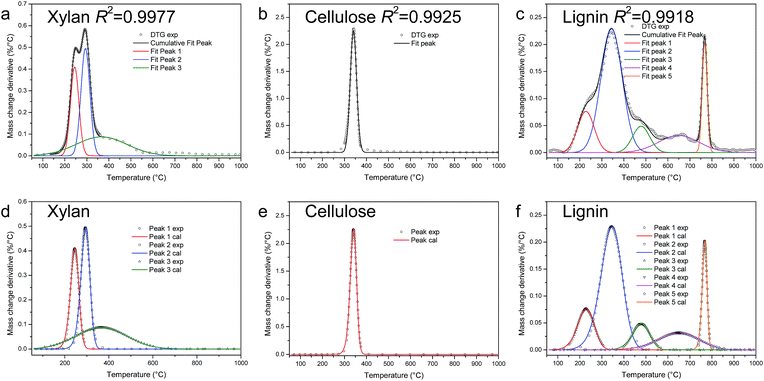 | ||
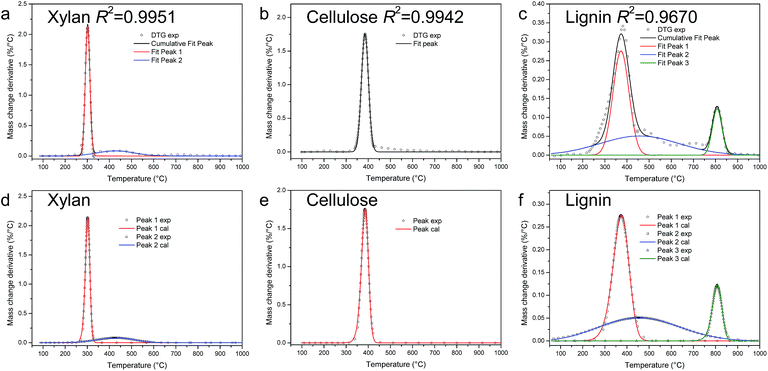
| Fig. 3 PA-LSM for kinetics calculation of pyrolysis of xylan, cellulose, and lignin in TGA (a–c: peak fit results; d–f: comparison of calculation from kinetic parameters and experimental results). | ||
The kinetic parameters calculated from PA-LSM are shown in Table 2. The percentage is the relatively mass loss of each peak, calculated from the peak area. As is well known, activated energy is an important parameter for a chemical reaction. As shown in Table 2, the activated energies of different reactions are various, from 26 to 1090 kJ mol−1. It can also be noted that the value of activated energy is related to the shape of the peak. The sharper the peak is, the larger the activated energy is.
| Sample | Reaction | Percentage (%) | Peak temperature (°C) | E (kJ mol−1) | A (min−1) | n | ADI |
|---|---|---|---|---|---|---|---|
| Xylan | 1 | 27.9 | 244.8 | 146 | 3.37 × 10¹⁴ | 1.49 | 1.58 |
| 2 | 36.1 | 293.5 | 164 | 6.58 × 10¹⁴ | 1.49 | 1.58 | |
| 3 | 40.0 | 366.1 | 26 | 9.19 | 1.08 | 0.23 | |
| Cellulose | 1 | 100.0 | 340.8 | 279 | 4.41 × 10²³ | 1.54 | 1.64 |
| Lignin | 1 | 13.6 | 227.7 | 62 | 8.61 × 10⁵ | 1.35 | 1.32 |
| 2 | 52.8 | 344.3 | 73 | 3.05 × 10⁵ | 1.34 | 1.29 | |
| 3 | 9.0 | 478.4 | 144 | 3.04 × 10⁹ | 1.43 | 1.48 | |
| 4 | 13.9 | 649.3 | 81 | 3.91 × 10³ | 1.27 | 1.13 | |
| 5 | 10.7 | 767.1 | 1090 | 5.85 × 1054 | 1.60 | 1.87 |
The index n is the order of the reaction, which is related to the reaction mechanisms.28 For different reactions, n varies from 1.08 to 1.60. The ADI is less than 2, which indicates that the DTG curves can be reproduced from kinetics parameters very well. The comparison of calculation results from kinetic parameters and the experimental results shown in Fig. 3d–f also proves this point.
Slow pyrolysis of xylan, cellulose and lignin in macro-TGA
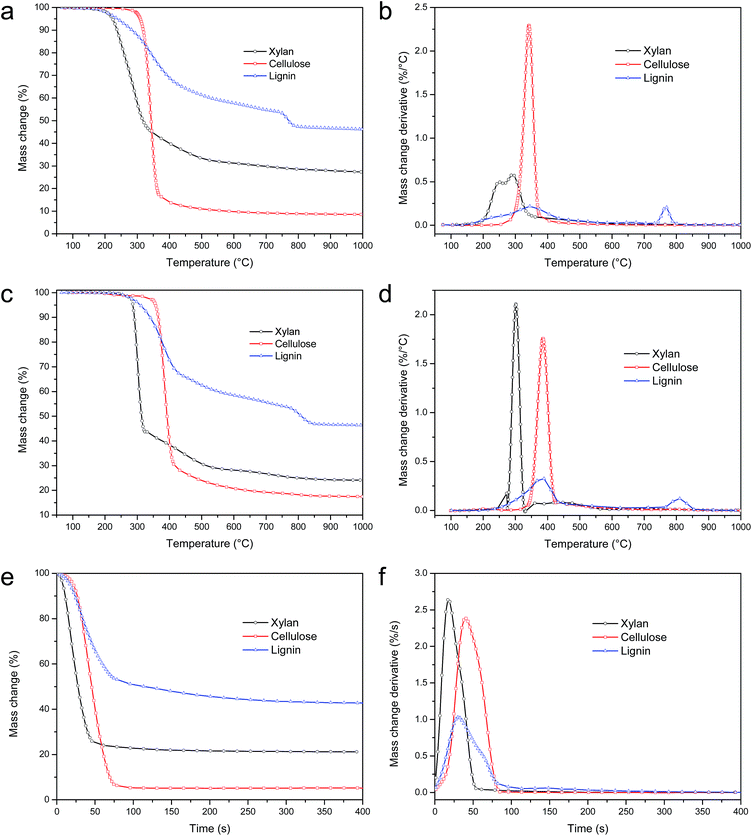
The pyrolysis of xylan can be divided into two stages: the first stage is a fast process, while the second one is a slow process. It should be noted that the three peaks in TGA merged into two peaks in macro-TGA. The pyrolysis of cellulose in macro-TGA has only one peak at 385.1 °C, as shown in Fig. 2d. The pyrolysis of lignin has two obvious peaks, as shown in Fig. 2d. The peak temperature of DTG in macro-TGA is higher than the corresponding peak temperature in TGA, because of the heat transfer process in macro-TGA.
The kinetic parameters are shown in Table 3. The ADIs are all less than 2, which are similar to that of TGA. The activated energies vary from 18 to 588 kJ mol−1. The third peak of lignin has the maximum activated energy, while the second one has the minimum activated energy. The index n is between 0.94 and 1.57. The comparison of calculation from kinetic parameters and experimental results is shown in Fig. 4d–f. The Gaussian peaks can be simulated well from the kinetic parameters shown in Table 3.
| Sample | Reaction | Percentage (%) | Peak temperature (°C) | E (kJ mol−1) | A (min−1) | n | ADI |
|---|---|---|---|---|---|---|---|
| Xylan | 1 | 76.1 | 301.5 | 350 | 8.34 × 1031 | 1.57 | 1.65 |
| 2 | 23.9 | 427.3 | 50 | 5.89 × 10² | 1.22 | 0.93 | |
| Cellulose | 1 | 100.0 | 385.1 | 291 | 8.57 × 10²² | 1.53 | 1.64 |
| Lignin | 1 | 46.3 | 373.0 | 113 | 4.16 × 10⁸ | 1.41 | 1.46 |
| 2 | 41.5 | 456.6 | 18 | 8.76 × 10⁻¹ | 0.94 | 0.78 | |
| 3 | 12.2 | 807.3 | 588 | 1.42 × 1028 | 1.55 | 1.78 |
Fast pyrolysis of xylan, cellulose, and lignin in macro-TGA
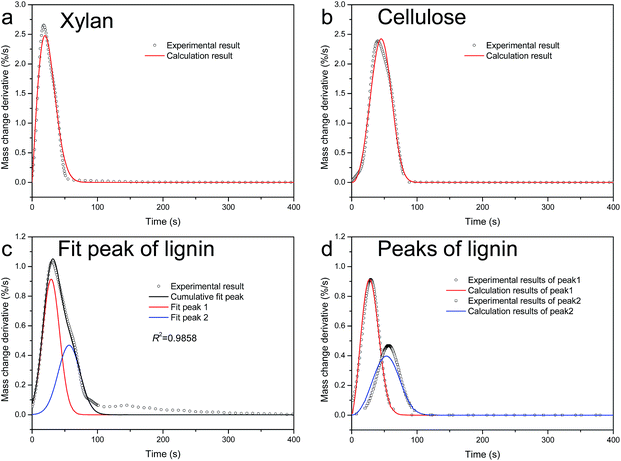
To evaluate the mass loss of fast pyrolysis quantitatively, some indexes are introduced,29 as shown in Table 4. τend is the end time of the reaction, when α = 95%; (dα/dτ)max is the maximum mass loss rate; τmax is the maximum mass loss time; F is the pyrolysis factor, which is defined as
 | (11) |
| Sample | τend (s) | (dα/dτ)max (% s−3) | τmax (s) | F (% s−3) |
|---|---|---|---|---|
| Xylan | 48.3 | 2.7 | 17.9 | 3.1 × 10⁻³ |
| Cellulose | 69.5 | 2.4 | 39.9 | 8.6 × 10⁻⁴ |
| Lignin | 208.4 | 1.0 | 30.7 | 1.6 × 10⁻⁴ |
The pyrolysis factor F is determined by the maximum mass loss rate, the maximum mass loss time and the end time, which represent the degree of difficulty of component pyrolysis. A larger F means easier pyrolysis of a component.
The pyrolysis of xylan ends very quickly (48.3 s), while pyrolysis of lignin lasts for a long time (208.4 s). Compared to pyrolysis of lignin, pyrolysis of xylan and cellulose has higher maximum mass loss rate. The maximum mass loss temperature occurs earlier for pyrolysis of xylan. The pyrolysis factor F decreasing order from easy pyrolysis to hard pyrolysis is xylan > cellulose > lignin.
| Sample | Percentage (%) | k | n | R2 |
|---|---|---|---|---|
| Xylan | 100.0 | 1.19 × 10⁻³ | 2.03 | 0.9995 |
| Cellulose | 100.0 | 2.21 × 10⁻⁶ | 3.32 | 0.9994 |
| Lignin | 59.9 | 1.25 × 10⁻⁴ | 2.57 | 0.9996 |
| 40.1 | 2.84 × 10⁻⁶ | 3.12 | 0.9970 |
Conclusions
Three main biomass components were pyrolyzed in TGA and self-designed macro-TGA at both low and high heating rates. A novel peak analysis-least square method was developed to investigate the kinetics of pyrolysis reactions. A complex pyrolysis reaction can be divided into several parallel reactions according to the number of peaks. The DTG curves can be fitted by the superposition of peaks with high related coefficients. Then each peak can be simulated well from the kinetic parameters.Acknowledgements
The financial support from National Basic Research Program of China (973 Program, no. 2011CB201502) is gratefully acknowledged.Notes and references
- H. Zhou, Y. Long, A. Meng, Q. Li and Y. Zhang, Thermochim. Acta, 2013, 566, 36–43 CrossRef CAS PubMed.
- C. Wu, V. L. Budarin, M. J. Gronnow, M. De Bruyn, J. A. Onwudili, J. H. Clark and P. T. Williams, J. Anal. Appl. Pyrolysis, 2014, 107, 276–283 CrossRef CAS PubMed.
- V. Pasangulapati, K. D. Ramachandriya, A. Kumar, M. R. Wilkins, C. L. Jones and R. L. Huhnke, Bioresour. Technol., 2012, 114, 663–669 CrossRef CAS PubMed.
- H. Zhou, C. Wu, A. Meng, Y. Zhang and P. T. Williams, J. Anal. Appl. Pyrolysis, 2014, 110, 264–269 CrossRef CAS PubMed.
- P. Sannigrahi, A. J. Ragauskas and G. A. Tuskan, Biofuels, Bioprod. Biorefin., 2010, 4, 209–226 CrossRef CAS.
- J. M. Cho, S. Chu, P. J. Dauenhauer and G. W. Huber, Green Chem., 2012, 14, 428–439 RSC.
- J. Zhang, T. Chen, J. Wu and J. Wu, RSC Adv., 2014, 4, 17513–17520 RSC.
- S. W. Bigger, J. Scheirs and G. Camino, Polym. Degrad. Stab., 1998, 62, 33–40 CrossRef CAS.
- C. Lu, W. Song and W. Lin, Biotechnol. Adv., 2009, 27, 583–587 CrossRef CAS PubMed.
- G. Várhegyi, H. Chen and S. Godoy, Energy Fuels., 2009, 23, 646–652 CrossRef.
- W. Wu, Y. Mei, L. Zhang, R. Liu and J. Cai, Energy Fuels, 2014, 28, 3916–3923 CrossRef CAS.
- T. Sonobe and N. Worasuwannarak, Fuel, 2008, 87, 414–421 CrossRef CAS PubMed.
- J. Zhang, T. Chen, J. Wu and J. Wu, Bioresour. Technol., 2014, 166, 87–95 CrossRef CAS PubMed.
- W. Chen and P. Kuo, Energy, 2010, 35, 2580–2586 CrossRef CAS PubMed.
- J. A. Caballero and J. A. Conesa, J. Anal. Appl. Pyrolysis, 2005, 73, 85–100 CrossRef CAS PubMed.
- P. Budrugeac, J. Therm. Anal. Calorim., 2002, 68, 131–139 CrossRef CAS.
- D. K. Seo, S. S. Park, Y. T. Kim, J. Hwang and T. U. Yu, J. Anal. Appl. Pyrolysis, 2011, 92, 209–216 CrossRef CAS PubMed.
- E. Biagini, A. Fantei and L. Tognotti, Thermochim. Acta, 2008, 472, 55–63 CrossRef CAS PubMed.
- C. Couhert, J. M. Commandre and S. Salvador, Fuel, 2009, 88, 408–417 CrossRef CAS PubMed.
- H. Yu, Z. Zhang, Z. Li and D. Chen, Fuel, 2014, 118, 250–256 CrossRef CAS PubMed.
- J. J. Manya, E. Velo and L. Puigjaner, Ind. Eng. Chem. Res., 2003, 42, 434–441 CrossRef CAS.
- H. Guo, IEEE Signal Process. Mag., 2011, 28, 134–137 CrossRef.
- A. W. Coats and J. P. Redfern, Nature, 1964, 201, 68–69 CrossRef CAS.
- W. Chen and P. Kuo, Energy, 2011, 36, 6451–6460 CrossRef CAS PubMed.
- J. D. Hancock and J. H. Sharp, J. Am. Ceram. Soc., 1972, 55, 74–77 CrossRef CAS PubMed.
- K. Go, S. Son and S. Kim, Int. J. Hydrogen Energy, 2008, 33, 5986–5995 CrossRef CAS PubMed.
- H. Yang, R. Yan, H. Chen, D. H. Lee and C. Zheng, Fuel, 2007, 86, 1781–1788 CrossRef CAS PubMed.
- C. Wang, B. Dou, Y. Song, H. Chen, M. Yang and Y. Xu, Energy Fuels, 2014, 28, 3793–3801 CrossRef CAS.
- J. Zheng, Y. Q. Jin, Y. Chi, J. M. Wen, X. G. Jiang and M. J. Ni, Waste Manage., 2009, 29, 1089–1094 CrossRef CAS PubMed.
| This journal is © The Royal Society of Chemistry 2015 |

