Photocatalytic degradation of imidacloprid in soil: application of response surface methodology for the optimization of parameters†
Teena Sharmaa,
Amrit Pal Toor*b and
Anita Rajora
aSchool of Energy & Environment, Thapar University, Patiala 147004, Punjab, India
bDr S. S. Bhatnagar University Institute of Chemical Engg. & Tech., Panjab University, Chandigarh, 160014, India. E-mail: aptoor@yahoo.com; Tel: +91-172-253-4904
First published on 25th February 2015
Abstract
The photocatalytic mineralization of imidacloprid (IMI) in soil to inorganic ions and the formation of various intermediates using TiO2 as the photocatalyst have been investigated under UV light. Various parameters, viz., catalyst concentration, soil depth and pH, intensity of light and initial concentration of IMI were optimized theoretically by using a central composite design based on a response surface methodology and were correlated with experimental results. The statistical analysis from the modelling results indicates that the degradation efficiency of IMI is affected by the depth of soil and the intensity of light, but the effects of the pH and the initial concentration of imidacloprid are more dominant. The optimum conditions obtained for the maximum degradation of imidacloprid were at pH = 3, intensity of UV light = 30 W m−2, soil depth = 0.2 cm and initial concentration of imidacloprid = 10 mg kg−1 of soil. Under these optimum conditions, the highest degradation efficiency of 83% was achieved after 18 h of UV light irradiation. The identification of various photoproduced intermediates of IMI by LC-MS analysis revealed its degradation, whereas the increase in the formation of inorganic ions with time of UV light irradiation confirms its mineralization.
1. Introduction
Soil, the ultimate sink for the accumulation of applied pesticides has attracted current research interest in-terms of the analysis of leaching behaviour, formation of intermediate products and the role of parameters affecting the degradation of pesticides. Upon contact, binding between the pesticide and the soil takes place, the extent of which depends on the nature, composition, texture, organic matter, pH, cation exchange capacity, electrical conductance and moisture of the soil.1 The adsorption of pesticides into soil is a crucial factor, as it is well known to influence2 their persistency, degradation and fate in the soil. For instance, adsorption and desorption processes have been reported3 to determine the mobility of pesticides and were found to be influenced by the physico-chemical properties of soil. Some studies have shown that organic matter affects the binding of pesticide molecules to soil4 and it is reported as a major controller component in the sorption, transformation, and transport of many organic pollutants in soil.5Imidacloprid (IMI), part of the neonicotinoid family of insecticides and effective on insects that are resistant to carbamates, organophosphates and pyrethroids, has been used from the past two decades over 120 crops worldwide. Due to its high water solubility, leaching behaviour and half-life, this insecticide has contaminated the soil and water reservoirs nearby agricultural fields, and is of concern for the environment.6 Its natural degradation is slow in soil under natural conditions, decomposing into, sometimes, more toxic and persistent intermediates than IMI itself. Therefore, efforts have been made to study the degradation and formation of metabolites from IMI biologically7–11 in soil and broth. The degradation of IMI has also been studied photocatalytically in water12,13 using TiO2 as the photocatalyst. The available reports reveal that approx 95% degradation of IMI can be achieved by photocatalysis in water.14 No studies have been reported on the photocatalytic degradation of IMI in soil; however, for other molecules such diuron,15 PNP and polycyclic aromatic hydrocarbons,16,17 the same process has been well reported. Therefore, using TiO2 as the photocatalyst in the soil could be useful for the mineralization of IMI, which seems to be an unexplored concept. Hence, degradation of IMI using commercially available Degussa P25–TiO2 as the photocatalyst under UV light irradiation in soil has been studied.
Generally, a single-variable-at-a-time (SVAT) method is used to study photocatalytic processes,18,19 however, it suffers from some disadvantages such as time consumption and incapability to account for interactions between different variables and, hence, to predict optimum conditions.20 On the contrary, central composite design (CCD) based on response surface methodology (RSM) has been found to be more convenient, as it provides a good correlation between various parameters in less time.21,22 Although this approach has been employed for the degradation of various pollutants in air and water,23–28 yet little work has been carried out in soil.
Hence, in this study, various parameters affecting the degradation of IMI such as intensity of light, pH, initial concentration of IMI and depth of soil have been optimized using CCD based on RSM. The predicted response values from RSM were compared to the experimental photocatalytic degradation efficiency of IMI. Under these optimized parameters, degradation of IMI was experimentally studied using HPLC along with the identification of the metabolites formed by LC-MS. The fate of the heteroatoms present (N, O, Cl) was studied by ion chromatography.
2. Experimental methodology
2.1 Materials
Imidacloprid (99%) and TiO2 (Degussa P25, average particle size of 30–50 nm, anatase![[thin space (1/6-em)]](https://www.rsc.org/images/entities/char_2009.gif) :
:![[thin space (1/6-em)]](https://www.rsc.org/images/entities/char_2009.gif) rutile::80
rutile::80![[thin space (1/6-em)]](https://www.rsc.org/images/entities/char_2009.gif) :
:![[thin space (1/6-em)]](https://www.rsc.org/images/entities/char_2009.gif) 20) were obtained as gift samples from Bayer CropScience India Ltd., Mumbai and Evonik Industries, respectively. Acetonitrile (HPLC grade), de-ionized water, H2SO4 and NaOH were obtained from Loba Chemi, India.
20) were obtained as gift samples from Bayer CropScience India Ltd., Mumbai and Evonik Industries, respectively. Acetonitrile (HPLC grade), de-ionized water, H2SO4 and NaOH were obtained from Loba Chemi, India.
2.2 Experimental procedure
Soil samples from the surface (0–10 cm) collected from the Thapar University campus, Patiala (Punjab), India, were firstly air dried and passed through a 1 mm sieve. The sieved soil samples were autoclaved (121 °C, 3 × 30 min) and stored in the dark. Adsorption and photodegradation studies (with and without TiO2) were performed in a UV reactor equipped with six UV lamps (Phillips, 20 W) with such an arrangement that the height of the soil samples with respect to the UV light can be varied (ESI, Fig. 1†), as previously reported by our group.29 The internal temperature of the chamber was maintained by using an exhaust fan. The pH3,7,11 of the soil was maintained by using 0.1 N HCl/NaOH solutions and the temperature was maintained by circulating water below the soil sample Petri-plates. The soil samples were spiked with 50 mg kg−1 of soil using an acetonitrile solution of IMI and a known amount of soil (5 g) was evenly spread on glass Petri-plates (90 mm of diameter), forming a layer of 0.2 cm, estimated from the soil bulk density and Petri-plate area. Moreover, the soil samples spiked with IMI were irradiated without TiO2, hereafter termed photolysis samples.Then, soil samples (5 g) from irradiating and non-irradiating experiments were extracted by stirring with acetonitrile in a 50 ml beaker followed by sonication in an ultrasonic water bath (EN 60 US, tank size 12” × 6” × 6”, 100 W, 33 ± 3 kHz). After extraction, the solution was separated from the soil by centrifugation and washed with acetonitrile. The extract solution thus obtained was filtered (0.22 μm Millipore syringe filter) and analysed using a UV-Vis spectrophotometer (λmax = 270 nm, Hitachi V-500 UV-Vis, Japan).
The photoproducts formed from the degradation of IMI were qualitatively analysed by LC-MS using a Waters Alliance 2795 LC-MS (Waters, UK) linked to a Micromass Q-Tof system equipped with a Shimadzu column C18 (250 × 4.6 mm, 5 μm) at 20 °C. The acidified (0.1% acetic acid) mobile phase (acetonitrile![[thin space (1/6-em)]](https://www.rsc.org/images/entities/char_2009.gif) :
:![[thin space (1/6-em)]](https://www.rsc.org/images/entities/char_2009.gif) water::50
water::50![[thin space (1/6-em)]](https://www.rsc.org/images/entities/char_2009.gif) :
:![[thin space (1/6-em)]](https://www.rsc.org/images/entities/char_2009.gif) 50) isocratically flowed at a rate of 0.3 ml min−1. Mass analysis was performed with a Z-spray source for positive electrospray ionization on the multiple reaction monitoring (MRM) scan mode in the range 50–300 m/z. The source and probe were isothermally kept at 140 and 250 °C, respectively, and N2 (1 ml min−1) was used as the source of nebulisation. The sample injection volume for LC-MS was 10 μl.
50) isocratically flowed at a rate of 0.3 ml min−1. Mass analysis was performed with a Z-spray source for positive electrospray ionization on the multiple reaction monitoring (MRM) scan mode in the range 50–300 m/z. The source and probe were isothermally kept at 140 and 250 °C, respectively, and N2 (1 ml min−1) was used as the source of nebulisation. The sample injection volume for LC-MS was 10 μl.
Quantification of the inorganic anions produced (nitrate, nitrite and chloride) was estimated by injecting 100 μl of the sample into an ion chromatograph equipped with a Waters 501 pump, a Waters 431 conductivity detector, and an ion pack (50 mm × 4.6 mm, Metrhom) column using methanol![[thin space (1/6-em)]](https://www.rsc.org/images/entities/char_2009.gif) :
:![[thin space (1/6-em)]](https://www.rsc.org/images/entities/char_2009.gif) water::60
water::60![[thin space (1/6-em)]](https://www.rsc.org/images/entities/char_2009.gif) :
:![[thin space (1/6-em)]](https://www.rsc.org/images/entities/char_2009.gif) 40 as the mobile phase @ 0.6 ml min−1.
40 as the mobile phase @ 0.6 ml min−1.
2.3 Experimental design and data analysis
Parameters such as UV light intensity, initial concentration of IMI, pH, TiO2 catalyst amount, reactor configuration etc., are some of the factors affecting a photocatalytic oxidation reaction.30 However, it is very difficult to carry out an experimental design including the above mentioned factors due to the large number of experiments that would be required.31 Therefore, four variables, pH, initial concentration of IMI, intensity of UV light and depth of soil, were investigated, including all the possible combinations for each factor. This multivariable experimental design was done according to CCD based on RSM and the photocatalytic degradation efficiency was selected as the response. The analysis of the experimental data was supported by Design-Expert Software (trial version 9.0.3.1, Stat-Ease, Inc., MN, USA).21,32,33 These variables were firstly converted to dimensionless ones (P, Q, R, S) with coded values at levels: −α, 1, 0, +1, +α, as shown in Table 1 of the ESI.† These five levels depicting the controlling factors are 3–11 for pH values (P); 10–30 W m−2 for the intensity of light (Q); 5–25 g for the amount of soil (R) in Petri-plates of fixed diameter of 90 mm (corresponding to soil depths ranging 0.2–1 cm, respectively); and 10–90 mg of IMI kg−1 of soil for the initial concentration of IMI (S) in soil. The 30 combinations obtained by the software were experimentally performed in the present study and are shown in Table 1.| Run | pH (P) | Intensity of light W m−2 (Q) | Amount of soil g (R) | Initial conc. of imidacloprid mg kg−1 (S) | R1 (%) (experimental) | R2 (%) (predicted) |
|---|---|---|---|---|---|---|
| 1 | 7 | 20 | 15 | 50 | 52 | 49 |
| 2 | 3 | 20 | 15 | 50 | 60 | 59 |
| 3 | 7 | 20 | 15 | 50 | 52 | 49 |
| 4 | 7 | 30 | 15 | 50 | 63 | 56 |
| 5 | 3 | 10 | 25 | 10 | 49 | 52 |
| 6 | 7 | 10 | 15 | 50 | 47 | 41 |
| 7 | 11 | 10 | 5 | 90 | 19 | 23 |
| 8 | 3 | 10 | 5 | 10 | 63 | 67 |
| 9 | 7 | 20 | 25 | 50 | 44 | 42 |
| 10 | 3 | 30 | 5 | 90 | 55 | 59 |
| 11 | 3 | 30 | 5 | 10 | 83 | 86 |
| 12 | 11 | 30 | 25 | 10 | 50 | 54 |
| 13 | 11 | 30 | 5 | 10 | 55 | 59 |
| 14 | 11 | 30 | 25 | 90 | 27 | 31 |
| 15 | 3 | 10 | 5 | 90 | 49 | 53 |
| 16 | 3 | 30 | 25 | 90 | 34 | 37 |
| 17 | 7 | 20 | 15 | 50 | 54 | 49 |
| 18 | 7 | 20 | 15 | 50 | 53 | 48 |
| 19 | 3 | 30 | 25 | 10 | 66 | 69 |
| 20 | 7 | 20 | 15 | 50 | 54 | 49 |
| 21 | 11 | 30 | 5 | 90 | 45 | 49 |
| 22 | 7 | 20 | 15 | 90 | 45 | 40 |
| 23 | 3 | 10 | 25 | 90 | 41 | 44 |
| 24 | 7 | 20 | 5 | 50 | 62 | 56 |
| 25 | 7 | 20 | 15 | 10 | 60 | 58 |
| 26 | 7 | 20 | 15 | 50 | 53 | 49 |
| 27 | 11 | 10 | 25 | 90 | 14 | 17 |
| 28 | 11 | 10 | 5 | 10 | 42 | 46 |
| 29 | 11 | 10 | 25 | 10 | 21 | 24 |
| 30 | 11 | 20 | 15 | 50 | 42 | 39 |
3. Results and discussion
3.1 Preliminary experiments
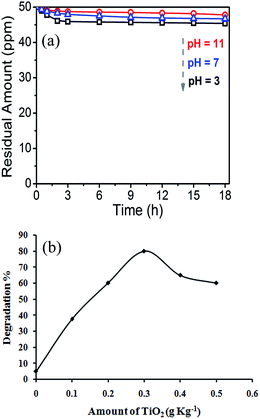
Preliminary experiments were carried out in order to evaluate the photolysis and adsorption of IMI in soil. It was observed that changes in the concentration of IMI were not significant when kept in the dark for 18 h, which was ascribed to adsorption in soil. As pH has a significant effect on the adsorption of pollutants, adsorption studies for IMI in soil at different pH3,7,11 were performed (Fig. 1a). The adsorption of IMI in soil was ∼5% at pH = 11 and it increased up to ∼9% at pH = 3. This indicates the protonation of the imidazole ring, which is in good agreement with the work of Jodeh et al.34 where protonation of imidacloprid was reported to be the cause for a decrease in its sorption in alkaline silty clay soil. Moreover, photolysis of IMI in soil at the optimum adsorption pH was carried out, showing no notable change in its concentration even after 18 h of UV light irradiation. This clearly demonstrates the stability of the IMI molecule, in accordance with previous reports12 where the half life of IMI was reported to be 40–60 days. However, when soil containing IMI was irradiated with UV light in the presence of TiO2 (0.1–0.5 g kg−1), degradation was observed and found to be dependent upon the amount of catalyst (Fig. 1b). It was observed that the degradation increased with the amount of photocatalyst up to 0.3 g kg−1 and thereafter, it decreased. Generally, an increase of the amount of catalyst actually increases the number of active sites on the photocatalyst surface, thus causing an increase in the number of ˙OH radicals which actually participate in the IMI degradation. But further increase of the amount of TiO2 results in a decline of light penetration, causing a decrease in the formation of excited charge carriers, and hence oxidative hydroxyl and superoxide radicals,35,36 therefore reducing the degradation rate.Thus 0.3 g TiO2 per kg of the soil was found to be the optimum amount, which was further used for the optimization of the other four experimental parameters (P, Q, R, S).
3.2 Response surface modelling and data analysis
The experimental design includes 30 experiments and the results were obtained from the experimental data presented in Table 1. The theoretical correlation between these parameters can be expressed as follows:| R = +64.69562 − 1.20421 pH + 1.41174 intensity − 0.36298 soil + 0.010786 conc. − 0.098242 pH intensity − 0.11836 pH soil − 0.042773 pH conc. − 0.024414 soil intensity − 0.014629 intensity conc. + 2.30469 × 10⁻³ soil conc. + 6.67969 × 10⁻³ pH intensity soil + 2.48047 × 10⁻³ pH Intensity conc. + 1.52344 × 10⁻³ pH soil conc. − 8.98438 × 10⁻⁵ intensity soil conc. − 7.42188 × 10⁻⁵ pH intensity soil conc. |
In the above expression, R is the response variable for the degradation efficiency of imidacloprid. Adequacy and significance of the model (response surface reduced quadratic model) was checked by applying ANNOVA which is one of the most important test for the evaluation of data. Thus, from Table 2, the probability values for P and S are very low (<0.0001) compared to Q and R. This shows that variables P (pH) and S (concentration of IMI) have a much more significant effect than Q (intensity of light) and R (depth of soil) in the degradation of IMI. The ANNOVA results show that the factors with a very low value of probability have a more significant effect on the degradation compared to factors having a high value of probability. Additionally, the adequacy of the selected model towards a real system was confirmed by analyzing the correlation between observed and predicted values. The parity between experimental and predicted values is given in Fig. 2a, where the experimental data has been reasonably fitted well within ±10%. The response factor of the calculated residual values is plotted and shown in Fig. 2b, which shows that all data points lie close to a straight line and within the 95% confidence interval line with mean values near zero. The plot of internally studentized residuals vs. predicted values (ESI, Fig. 2†) shows that the points are randomly scattered and the values lie within the same range (−3 to +3).
| Term | Variable | Regression coefficients | Probability |
|---|---|---|---|
| pH value | P | −10.28 | <0.0001 |
| Intensity of light | Q | 7.39 | 0.0002 |
| Depth of soil | R | −7.06 | 0.0003 |
| Imidacloprid conc. | S | −8.89 | <0.0001 |
| pH value × int. of light | PQ | 2.81 | 0.0971 |
| pH value × depth of soil | PR | 0.69 | 0.6704 |
| Int. of light × depth of soil | QR | 1.19 | 0.4652 |
| Int. of light × IMI conc. | QS | −0.81 | 0.6155 |
| pH value × IMI conc. | PS | −2.56 | 0.1275 |
| Depth of soil × IMI conc. | RS | 0.31 | 0.8462 |
| pH value × int. of light × depth of soil | PQR | 1.19 | 0.4652 |
| pH value × int. of light × IMI conc. | PQS | 2.19 | 0.1883 |
| pH value × depth of soil × IMI conc. | PRS | 0.06 | 0.9690 |
| Int. of light × depth of soil × IMI conc. | QRS | −2.44 | 0.1456 |
| pH value × int. of light × depth of soil × IMI conc. | PQRS | −1.19 | 0.4652 |
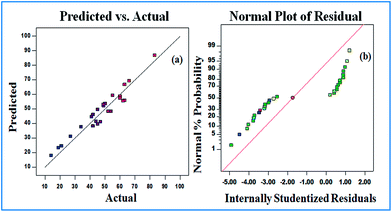 | ||
| Fig. 2 (a) Experimental and calculated values for the degradation of imidacloprid, and (b) internally studentized residuals plot during the photocatalytic process. | ||
Moreover, the 3-dimensional response surface plots (Fig. 3–5) and two dimensional contours (ESI, Fig. 3–5†) further confirm that the highest degradation (83%) could be achieved under the optimized parameters. Fig. 3 reveals the significant impact of the soil pH and initial IMI concentration on the degradation of IMI. It can be seen that in acidic soil and at low concentration of IMI, the degradation is maximum. This could be attributed to the fact that with a decrease in pH, the TiO2 surface becomes cationic37 causing an enhancement in the attractive interaction with the O atoms (partially negative) of the resonance stabilized –NO2 group in IMI (ESI, Fig. 6†). Consequently, the adsorption of IMI increases, favouring a larger number of IMI molecules present on the surface of TiO2 and hence increasing the degradation efficiency. However, at pH = 9–11, the reduction in the degradation efficiency (50% to 15%) can be ascribed to the protonation of the imidazole ring as revealed by the adsorption studies in the dark. At low concentrations of IMI, the degradation is faster than at high concentration of IMI. With the increase in the concentration of IMI, a screening effect dominates and prevents the penetration of light resulting in a reduction in the generation of OH˙ radicals on the catalyst surface.38 The degradation of IMI is further found to be affected by the soil depth and the intensity of light (Fig. 4 and 5). An increase in the soil depth (0.2–1 cm) causes a decrease in the degradation efficiency. This is because the sunlight cannot reach deep inside the soil and the necessary conditions for the photocatalytic degradation are absent, hence the degradation efficiency decreases as the soil layer becomes thicker.39,40 The degradation efficiency was found to increase with the increasing light intensity. This could be credited to an increased availability of photons for the excitation of valence band electrons, leading to the predominate formation of electron–hole pairs, and thereby diminishing charge recombination processes.41–43 However, at low light intensity, electron–hole pair separation competes with recombination, which in turn decreases the formation of free radicals thereby causing a lower effect on the degradation of IMI in the soil.
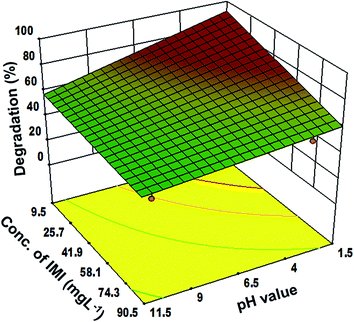 | ||
| Fig. 3 Response surface graph for the correlation between pH and initial imidacloprid concentration at a fixed depth of soil (0.2 cm) and light intensity 30 W m−2. | ||
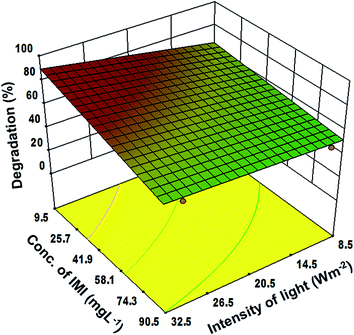 | ||
| Fig. 4 Response surface graph for the correlation between light intensity and initial imidacloprid concentration at a fixed depth of soil (0.2 cm) and pH = 3. | ||
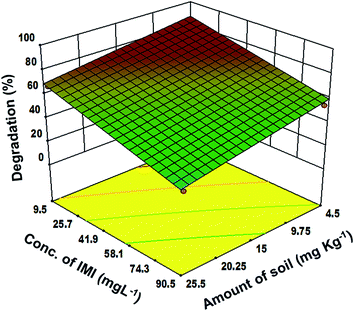 | ||
| Fig. 5 Response surface graph for the correlation between the depth of soil and initial imidacloprid concentration at a fixed intensity of light 30 W m−2 and pH = 3. | ||
The experiments carried out yielded a maximum degradation efficiency of 83%, in agreement with the predicted response of 86%, which verifies the validity of the optimal point, indicating that CCD can be effectively used to optimize the photocatalytic degradation of pollutants.
3.3 Degradation kinetics under optimized conditions
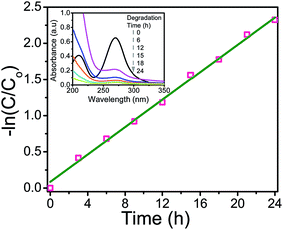
The photocatalytic oxidation kinetics of many organic compounds fits the Langmuir–Hinshelwood (L–H) model:where k is the reaction rate constant, K is the equilibrium adsorption constant, and C the substrate concentration at any time t.44 In cases of low concentrations of the reacting substrate, this equation is simplified to apparent first order kinetics:
| −ln(C/Co) = krKt = kt |
The plot for −ln(C/Co) vs. time of irradiation was found to be a straight line with slope (k) 0.0957 min−1, as shown in Fig. 6.
3.4 Degradation reaction mechanism under optimized conditions
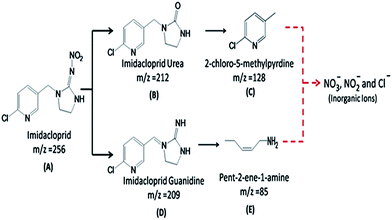
A clear contrast was found between the LC chromatograms obtained for the photolysis and photodegradation of IMI (ESI, Fig. 7†). It can be clearly seen that the peak height of IMI after 18 h of photolysis is comparatively higher than that found for the sample after photodegradation. Moreover, some new peaks at Rt = 1.6, 1.9, 2.3 and 2.5 min are present in the sample after photodegradation, while only one peak at Rt = 1.6 min is found in the photolysis sample. Various intermediate products were identified by LC-MS analysis (ESI, Fig. 8†) as compounds B (Rt = 1.95 min), C (Rt = 1.63 min), D (Rt = 2.09 min) and E (Rt = 3.32 min). The formation of these identified intermediates can be explained on the basis of the proposed pathway (Fig. 7), suggesting various possible attack positions by the hydroxyl radicals in IMI.A preliminary attack of hydroxyl radicals at the N–N position in IMI is expected to yield compound D, which is further degraded to compound E. The hydrolysis of IMI can result in the formation of intermediate compound B, which is degraded to compound C via the attack of hydroxyl radicals, which is reported to be an intermediate product of IMI photooxidation. The formation of these identified intermediates during photolysis and photodegradation is in accordance to previous reports45 concerning the same system in aqueous media.
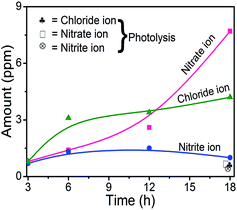
Investigation of the fate of the heteroatoms showed that the amount of inorganic ions formed after 18 h of photodegradation is notably higher than that found after photolysis of IMI (Fig. 8), indicating lower mineralization in the case of photolysis. The increase in the formation of inorganic ions with time of UV light irradiation further confirms the mineralization of IMI during photodegradation. The formulated balanced stoichiometric chemical equation for the formation of nitrate, nitrite and chloride ions during the photodegradation of IMI in the present study (eqn (1)) was found to deviate from the expected balanced equation (eqn (2)) after complete degradation. The presence of unidentified intermediates composed of heteroatoms accounts for the incomplete mineralization. The increase in the extent of nitrate ion formation with the irradiation time is probably due to the mineralization of the imidazole or pyridine-substituted ring(s). These results are in correlation with previous studies46,47 for the dissipation of cyproconazole and fenhexamid, where the nitrogen atoms present in the triazole moiety were found to decompose to nitrate and ammonium ions.
 | (1) |
 | (2) |
4. Conclusions
Photocatalytic degradation of IMI in the surface of soil can be effectively achieved using TiO2 as the photocatalyst. The present study has shown the dependence of the degradation of IMI on the pH, intensity of light, depth of soil and initial concentration of IMI. The above mentioned parameters were firstly optimized using CCD in RSM supported by Design-Expert Software, and a number of experiments obtained from the software were selected and experimentally performed to study the photocatalytic degradation efficiency. Therefore, under the optimized conditions, mineralization of IMI to inorganic ions and various metabolites can be achieved to overcome the problem of the persistence of IMI in soil.Acknowledgements
Financial and instrumentation support from the Department of Science and Technology under the DST WOS-A project (SR/WOS-A/LS-353/2012) and the Central Instrumentation Laboratory (CIL), Punjab University, Chandigarh is highly acknowledged.References
- L. Cox, M. C. Hermosin, W. C. Koskinen and J. Cornejo, Clay Miner., 2001, 36, 267–274 CrossRef CAS PubMed.
- U. Baer and R. Calvet, J. Environ. Qual., 1999, 28, 1765–1777 CrossRef CAS.
- M. C. Vagi, A. S. Petsas, M. N. Kostopoulou and T. D. Lekkas, Int. J. Environ. Anal. Chem., 2010, 90, 369–389 CrossRef CAS.
- E. Morillo, T. Undabeytia, C. Maqueda and A. Ramos, Chemosphere, 2000, 40, 103–107 CrossRef CAS.
- A. Albarran, R. Celis, M. Hermosin, A. Lopez-Pineiro and J. Cornejo, Chemosphere, 2004, 54, 717–724 CrossRef CAS PubMed.
- S. E. El-Hamady, R. Kubiak and A. S. Derbalah, Chemosphere, 2008, 71, 2173–2179 CrossRef CAS PubMed.
- J. C. Anhalt, T. B. Moorman and W. C. Koskinen, J. Environ. Sci. Health, Part B, 2007, 42, 509–514 CrossRef CAS PubMed.
- G. Pandey, S. J. Dorrian, R. J. Russell and J. G. Oakeshott, Biochem. Biophys. Res. Commun., 2009, 380, 710–714 CrossRef CAS PubMed.
- S. S. Phugare, D. D. Kalyani, Y. B. Gaikwad and J. P. Jadhav, Chem. Eng. J., 2013, 230, 27–35 CrossRef CAS PubMed.
- G. Madhuban, D. Dutta, S. K. Jha, S. Kalra, S. Bandyopadhyay and S. K. Das, Pestic. Res. J., 2011, 23, 36–40 Search PubMed.
- T. Sharma, A. Rajor and A. P. Toor, Biorem. J., 2014, 18, 227–235 CrossRef CAS.
- I. S. Grover, S. Singh and B. Pal, RSC Adv., 2014, 4, 51342–51348 RSC.
- C. Feng, G. Xu and X. Liu, J. Rare Earths, 2013, 31, 44–48 CrossRef CAS.
- S. Malato, J. Caceres, A. Aguera, M. Mezcua, D. Hernando, J. Vial and A. R. Fernandez-Alba, Environ. Sci. Technol., 2001, 35, 4359–4366 CrossRef CAS.
- M. M. Higarashi and W. F. Jardim, Catal. Today, 2002, 76, 201–207 CrossRef CAS.
- J. Wang, S. Chen, X. Quan, H. Zhao and Y. Zhao, Soil Sediment Contam., 2007, 16, 413–421 CrossRef CAS.
- L. Zhang, P. Li, Z. Gong and X. Li, J. Hazard. Mater., 2008, 158, 478–484 CrossRef CAS PubMed.
- W. S. Kuo, Y. H. Chiang and L. S. Lai, J. Environ. Sci. Health, Part B, 2006, 41, 937–948 CrossRef CAS PubMed.
- A. Mahalakshmi, B. Arabindoo, A. Palanichamy and V. Murugesan, J. Hazard. Mater., 2007, 143, 240–245 CrossRef PubMed.
- T. C. An, J. An, H. Yang, G. Li, H. Feng and X. Nie, J. Hazard. Mater., 2011, 197, 229–236 CrossRef CAS PubMed.
- V. A. Sakkas, M. A. Islam, C. Stalikas and T. A. Albanis, J. Hazard. Mater., 2010, 175, 33–44 CrossRef CAS PubMed.
- L. A. Lu, Y. S. Ma, M. Kumar and J. G. Lin, Chem. Eng. J., 2011, 166, 150–156 CrossRef CAS PubMed.
- J. Y. Chen, G. Li, Y. Huang, H. Zhang, H. Zhao and T. C. An, Appl. Catal., B, 2012, 123–124, 69–77 CrossRef CAS PubMed.
- T. C. An, J. An, Y. Gao, G. Li, H. Fang and W. Song, Appl. Catal., B, 2015, 164, 279–287 CrossRef CAS PubMed.
- J. Márquez, C. Herrera, M. Fuentes and L. Rosas, Int. J. Electrochem. Sci., 2012, 7, 11043–11051 Search PubMed.
- S. Alijani, M. Vaez and A. Z. Moghaddam, Int. J. Environ. Sci. Dev., 2014, 5, 108 CAS.
- D. Vildozo, C. Ferronato, M. Sleiman and J. M. Chovelon, Appl. Catal., B, 2010, 94, 303–310 CrossRef CAS PubMed.
- W. Wang and Y. Ku, J. Photochem. Photobiol., A, 2003, 159, 47–59 CrossRef CAS.
- A. P. Toor, A. Verma, C. Jotshi, P. K. Bajpai and V. Singh, Indian J. Chem. Technol., 2005, 12, 75–81 CAS.
- H. Lin, C. P. Huang, W. Li, C. Ni, S. I. Shah and Y. H. Tseng, Appl. Catal., B, 2006, 68, 1–11 CrossRef CAS PubMed.
- I. K. Konstantinou and T. A. Albanis, Appl. Catal., B, 2004, 49, 1–14 CrossRef CAS PubMed.
- A. Abdullah, H. J. M. Moey and N. Z. Yusof, J. Environ. Sci., 2012, 24, 1694–1701 CrossRef CAS.
- H. Yang, S. Zhou, H. Liu, W. Yan, L. Yang and B. Yi, J. Environ. Sci., 2013, 25, 1680–2168 CrossRef CAS.
- S. Jodeh, O. Khalaf, A. Obaid, B. Hammouti, T. Hadda, W. Jadeh, M. Hadded and I. Warad, J. Mater. Environ. Sci., 2014, 2, 571–580 Search PubMed.
- S. Malato, J. Blanco, M. I. Maldonado, P. Fernandez-Ibañez and A. Campos, Appl. Catal., B, 2000, 28, 163–174 CrossRef CAS.
- S. G. Muhamad, Arabian J. Chem., 2010, 3, 127–133 CrossRef CAS PubMed.
- I. S. Grover, S. Singh and B. Pal, Appl. Surf. Sci., 2013, 280, 366–372 CrossRef CAS PubMed.
- M. A. Rauf, M. A. Meetani and S. Hisaindee, Desalination, 2011, 27613–27627 Search PubMed.
- X. Xu, F. Ji, Z. Fan and L. He, Int. J. Environ. Res. Public Health, 2011, 8, 1258–1270 CrossRef CAS PubMed.
- M. P. Frank, P. G. Graebing and J. S. Chib, J. Agric. Food Chem., 2002, 50, 2607–2614 CrossRef CAS PubMed.
- V. R. Herbert and G. C. Miller, J. Agric. Food Chem., 1990, 38, 913–918 CrossRef.
- D. Dong, P. Li, X. Li, Q. Zhao, Y. Zhang, C. Jia and P. Li, J. Hazard. Mater., 2010, 174, 859–863 CrossRef CAS PubMed.
- C. X. Wang, A. Yediler, A. Peng and A. Kettrup, Chemosphere, 1995, 30, 501–510 CrossRef CAS.
- J. Saien and S. Khezrianjoo, J. Hazard. Mater., 2008, 157, 269–276 CrossRef CAS PubMed.
- H. Wamhoff and V. Schneider, J. Agric. Food Chem., 1999, 47, 1730–1734 CrossRef CAS PubMed.
- D. A. Lambropoulou, I. K. Konstantinou, T. A. Albanis and A. R. F. Alba, Chemosphere, 2011, 83, 367–378 CrossRef CAS PubMed.
- L. Lhomme, S. Brosillon and D. Wolbert, J. Photochem. Photobiol., A, 2007, 188, 34–42 CrossRef CAS PubMed.
Footnote |
| † Electronic supplementary information (ESI) available. See DOI: 10.1039/c5ra02224j |
| This journal is © The Royal Society of Chemistry 2015 |

