
 Open Access Article
 This Open Access Article is licensed under a
 Creative Commons Attribution 3.0 Unported Licence
Use of plastic-based analytical device, smartphone and chemometric tools to discriminate amines†
Lígia Buenoa,
Gabriel N. Melonia,
Subrayal M. Reddyb and
Thiago R. L. C. Paixão*a
aInstituto de Química, Universidade de São Paulo, Avenida Professor Lineu Prestes, 748, São Paulo, SP, Brazil. E-mail: trlcp@iq.usp.br
bDepartment of Chemistry, FEPS, University of Surrey, Guildford, UK GU2 7XH
First published on 12th February 2015
Abstract
Amine-based volatile compounds released by microorganisms offer an alternative diagnostic approach for the identification of foodborne pathogens. Our objective has been to solvent cast cellulose acetate membranes to immobilise dyes and to use the resultant membranes as a plastic device to discriminate between different types of amines (triethylamine, isobutylamine, isopentylamine). The plastic device consisted of an array of membranes with five pH indicators (namely alizarin, bromophenol blue, chlorophenol red, methyl red and thymol blue). To analyse the data using a portable instrument, we used an iPhone® to obtain images and to extract red, green and blue colours (RGB) using in-house software before and after contact with each individual amine. All the RGB values extracted for each analyte allowed us to generate a unique colour pattern, which was used as input for non-supervised pattern recognition methods. Based on this analysis, it was possible to clearly discriminate between the amines studied without any misclassification, demonstrating that the device is well-suited for large-scale applications such as non-destructive methods to discriminate amines and, in future, for smart packaging applications in order to give early warning of rotting food that may lead to food poisoning. Additionally, a semi-quantitative analysis was performed and we have demonstrated that it is possible to quantify concentrations of amines down to 1 ppm.
Introduction
A large number of micro-organisms are responsible for either accidental or deliberate contamination of food, potentially causing food poisoning and foodborne diseases like salmonellosis, listeriosis, botulism, E. coli infection. Some of them can be life-threatening, since they can produce toxins and release colonization products, leading to nausea or vomiting, and some more serious as abdominal pain, organ failure, abdominal pain, intoxication and even death. Examples of such organisms include Escherichia coli, Clostridium botulinum, Listeria monocytogenes, Salmonella spp., among others.1,2According to the World Health Organization (WHO), foodborne diseases are those transmitted by water or food that is contaminated with physical, chemical, or biological agents and these are classified as a hazard.3,4 Biological agents are the major causes of ill-health because of their ability to multiply and spread. This category is represented by bacteria, fungi, parasites and viruses. These microorganisms are often present naturally in foods or environments in which they find themselves, but they may be liable to the same hazards resulting from poor storage and handling or even poor hygiene and temperature control.
During the colonization process, bacteria and other organisms have the ability to produce compounds that are volatile and can be released into the environment. These volatile organic compounds (VOC), or sets of them, are unique for each genus or species of microorganisms, producing a chemical fingerprint for each of these microorganisms. As an example, volatile amines (trimethylamine, ammonia and dimethylamine) are responsible for the ‘fishy’ odour and flavour exhibited by rotting fish suggesting the food has gone past it's use-by date.5 The development of cheap analytical methods that allows real-time and non-destructive detection to quickly discriminate between different types of contamination avoiding consumption of contaminated food is of great interest to the consumer and retailer alike in order to protect the consumers from foodborne illness and to protect the reputation of retailers respectively. One solution that meets with these requirements is the development of spotted colour indicators integrated within the food packaging itself, as a form of smart packaging technology.6 The resulting real-time changes in colour of the spots in the presence of the VOCs of interest or other by-products responsible for microbial growth will be informative to stakeholders throughout the food chain. Diamond et al.5 proposed the use of a polymer matrix using a single pH sensitive dye (a single colorimetric spot) for monitoring fish spoilage. It is possible to use a matrix of colour indicators to better discriminate the microorganism responsible for food spoilage.
Odours are recognized by pattern combinations captured by olfactory cells; these patterns are carried to the brain where olfactory information is decoded. Recognition systems (receptor/transducer) have been mimicked using synthetic materials integrated with sensors and have been reported in the literature as electronic nose technologies.7 Likewise, there are other systems that mimic the taste, referred to as electronic tongues8 as well as vision (electronic eye).9,10 These electronic devices work the same way as human analogues, capturing information by patterns, using the concept of global selectivity, a system that does not identify particular substances but extracts the information into patterns that can be decoded by the brain. The brain, in the case of synthetic devices, is an unsupervised pattern recognition tool, which is able to transform these sets of signals into useful information for recognition.11 In contrast to a single colorimetric spot, or colorimetric sensor, an array of colorimetric sensors as reported by Suslick et al.10,12 and our group for explosives using a paper device,9 with pattern recognition, one can easily discriminate between more than a single compound or the total volatile basic nitrogen (TVB-N) species. These devices can qualitatively discriminate the compound released discerning the types of microorganism found based on the volatile chemical fingerprint produced.
Different substrates have been proposed for colorimetric testing of volatile compounds in solution and in the gaseous phase.13–15 Colorimetric tests have become common for a multitude of samples as food,16 beverages,17,18 explosives,9 bacteria,15,19 pathogenic fungi12 among others. Furthermore, different matrices have been proposed such as various types of papers,20,21 polymers in general,12,22,23 in order for satisfactory results to be obtained. Synthetic polymeric membranes have been used in a variety of sensor applications, for example, ion selective electrodes24 and amperometric sensors25,26 to enhance the selective permeability of ions and small molecules.27,28 They are easy to prepare from polymer powders using solvent-casting techniques and permselectivity is typically conferred by the inclusion of a plasticiser/modifying agent29 and can therefore be designed to be compatible with packaging materials for facile sensor integrations, while simultaneously observing food industry regulations for synthetic materials being in contact with food.30 Some previous works were also used some colour mechanism to discriminate amine22,23,31–39 and other works shown food spoilage sensors to detect amine using different techniques like electrochemical devices.40,41
In the literature, most of the works about amine discrimination and detection focus on biogenic amines34–36,42,43 or total volatile basic nitrogen (TVBN).44,45 In this work, we will combine membrane technology, dyes, chemometric tools and smartphone technology as a detector to develop new smart devices (electronic nose or eye) for the determination of food spoilage profiling by three volatile amines (triethylamine, isobutylamine, isopentylamine), the latter being released by microorganisms in the food spoilage process. These three amines were chosen since many food spoilage processes include the production of amines from amino acid degradation in protein-based foods.46 As examples, isopentyl and isobutylamine are commonly found from microbial degradation products of Enterobacteriaceae family.47,48 This group of bacteria include the genus Klebsiella, which is responsible for causing pneumonia and is involved in food contamination cases.49 Additionally, isobutylamine is produced from L-valine degradation by Proteus vulgaris and Pseudomonas cocovenans.46 Triethylamine is present in several kinds of foods, is an environmental pollutant and is exposed to people that ingest food contaminated with this amine.50 Additionally, an application in a real sample of meat adulterated with triethylamine, isobutylamine, isopentylamine and a detection of biogenic amines was performed to demonstrate the applicability of the device.
Experimental
Chemicals, materials and instrumentation
See ESI.†Membrane fabrication and colorimetric tests
Cellulose acetate membranes were obtained as follows. Cellulose acetate polymer was dissolved in acetone (0.1 g per 5 ml) in glass vials and the mixture shaken using a vortex until complete dissolution. In order to colour them, the dyes (methyl red, alizarin, bromophenol blue, thymol blue, chlorophenol red) were used individually at 1 mg per ml of solution. After complete solubilization of the dye, 150 μl of plasticizer Tween® 20 was added and the solution further agitated. The resulting solution was poured into a Petri dish, and the solution swirled to produce full surface coverage by solution. The Petri dish was then placed on a flat surface and left under a fume hood at room temperature overnight until complete evaporation of the solvent and formation of the membrane structure. The membranes were cut with a cork-borer (11 mm diameter) and the cutting placed on a separate Petri dish, and stored in the close chamber to avoid exposition to other chemical compounds found in the laboratory. Membranes were exposed to volatile amines for different intervals of duration in a 2 litre desiccator chamber. Additionally, for each replicate experiment a fresh membrane was used. Due to the fast volatilization of the amines studied, the gaseous phase of amine was generated adding 10 μl of each amine in a beaker inside the desiccator chamber.Real sample application
To evaluate the device for a real application, minced meat samples (2 g each one) were contaminated with gas phase containing one of each amine (isobutylamine, isopentylamine or triethylamine) per experiment. To do this, 10 μL of each amine was placed in a pre-chamber and the volatile phase was placed in contact with the non-contaminated meat sample in a second chamber. After this process, the meat contaminated with each volatile was placed in a 400 ml desiccator chamber with the membranes. An experiment without contamination of the meat was performed too.Chemometric analysis
A traditional colour difference map9,12 was obtained from the values of red, green and blue (RGB) after exposure minus the RGB values before the exposure. The RGB values were extracted using an iOS application developed for the sole purpose of measuring the RGB values of each coloured membrane.9 The RGB values for each spot were collect from the centre of the spot (260 × 260 pixels region) and the standard deviation for each RGB components were measured too. Each difference map is represented by 15 values (each difference map contains 5 dyes and each dye yields 3 values). The colour difference maps were used as input data for unsupervised chemometric tools, namely PCA (Principal Component Analysis) and HCA (Hierarchical Cluster Analysis).In order to evaluate the quantitative performance of the plastic-based device, we used an approach based on the colorimetric response of the spots expressed using the Euclidian distance (ED)9,51 versus the concentration of each amine used, which could be expressed by the eqn (1):
 | (1) |
Results and discussion
Amines discrimination using cellulose acetate membranes with pH indicators
The pH indicators are Brønsted–Lowry acids or bases and, therefore, have different colours in their protonated (HInd) and deprotonated (Ind−) forms. The colour change resulting from the conversion of the acid form and the basic form is due to the modification of the molecular structure of the indicator, which is caused by the entry or exit of proton (H+). Consequently, the structure modification of the indicator means that light is absorbed at a different wavelength, which leads to different colours for each of the forms. The balance between the acid form (HInd) and its conjugate base (Ind−) is dictated by the pKa and is given by eqn (2).| HInd ⇆ H+ + Ind− | (2) |
Based on this idea we fabricated a plastic-based colorimetric device made by cellulose acetate polymers with five different pH indicators (alizarin, bromophenol blue, chlorophenol red, methyl red and thymol blue) immobilised on the membrane structure, as reported in the Fig. 1. After the fabrication, the device was exposed to a single amine in order to evaluate the changes in the pattern colour before and after exposure of the amines (Fig. 1A–C).
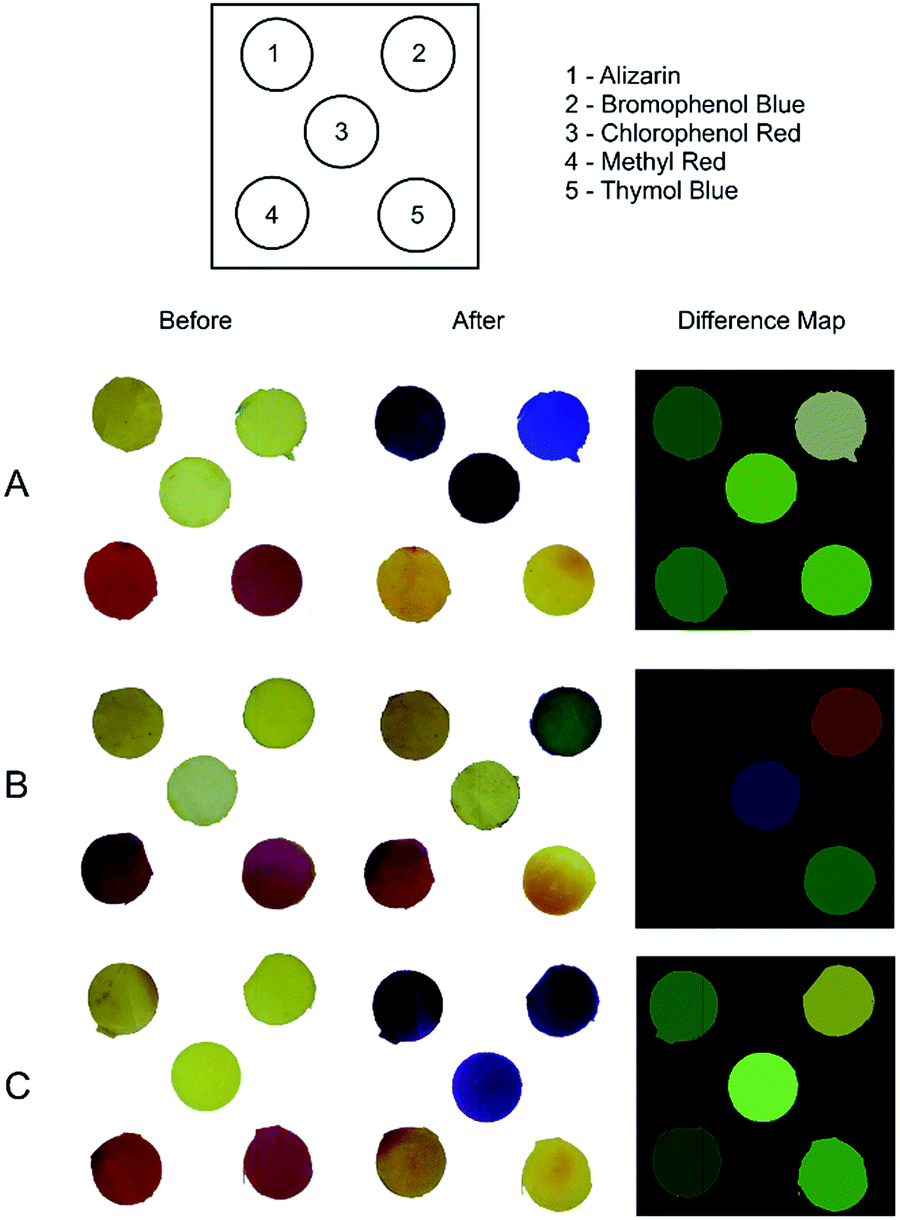 | ||
| Fig. 1 Schematic representation of the position of each pH indicator on the device and the colour changes profile of the sensor array as function of the amine exposed: isobutyl (A), triethyl (B) and isopentyl (C), as well, the difference map obtained by the subtraction of the RGB values after and before. Time of exposure 10 minutes. Concentration of amine in the experiment: 5 ppm. | ||
In Fig. 1A–C, each analyte is distinguished from others by the difference maps obtained but also by the naked eye, and although there are family resemblances among chemically similar species, any two primary amines (e.g. isopentylamine and isobutylamine) can be discriminated. The explanation for this discrimination is based on the fact that amines are weak proton donors and therefore the colour changes in presence of the pH indicators is sometimes more subtle, not reaching the extreme colour for the full acidic and full basic forms, and therefore exhibiting a mixture of the HInd/Ind− colours. Additionally, another aspect that explain the colour changes of the membranes is based on the different amine polarities, since we are using primary and tertiary amines (solubility normally decreases with the increase in the number of carbon atoms). Hence, the mechanism of colour change will be controlled by the amines' solubility and their acidity constants. According to the literature,52 the membrane permeability could be increased with addition of surfactant, such as Tween® 20; this incorporation may alter physical chemical properties of the membrane and increase the amount of amine solubilized.
From the difference maps obtained in Fig. 1, the discrimination between difference map in Fig. 1A and C could not be easily achieved by the naked eye and could be an issue for users who may be colour blind. The changes in RGB values of the spots 1, 3, 4 and 5 are subtle. However, it is possible to circumvent this limitation by using the RGB values to discriminate the difference maps. We extracted RGB values using a smartphone and an in-house software as input of the non-supervised pattern recognition methods (PCA and HCA). Fig. 2 shows a PCA scores plot using the RGB values extracted from the difference maps obtained for five replicates.
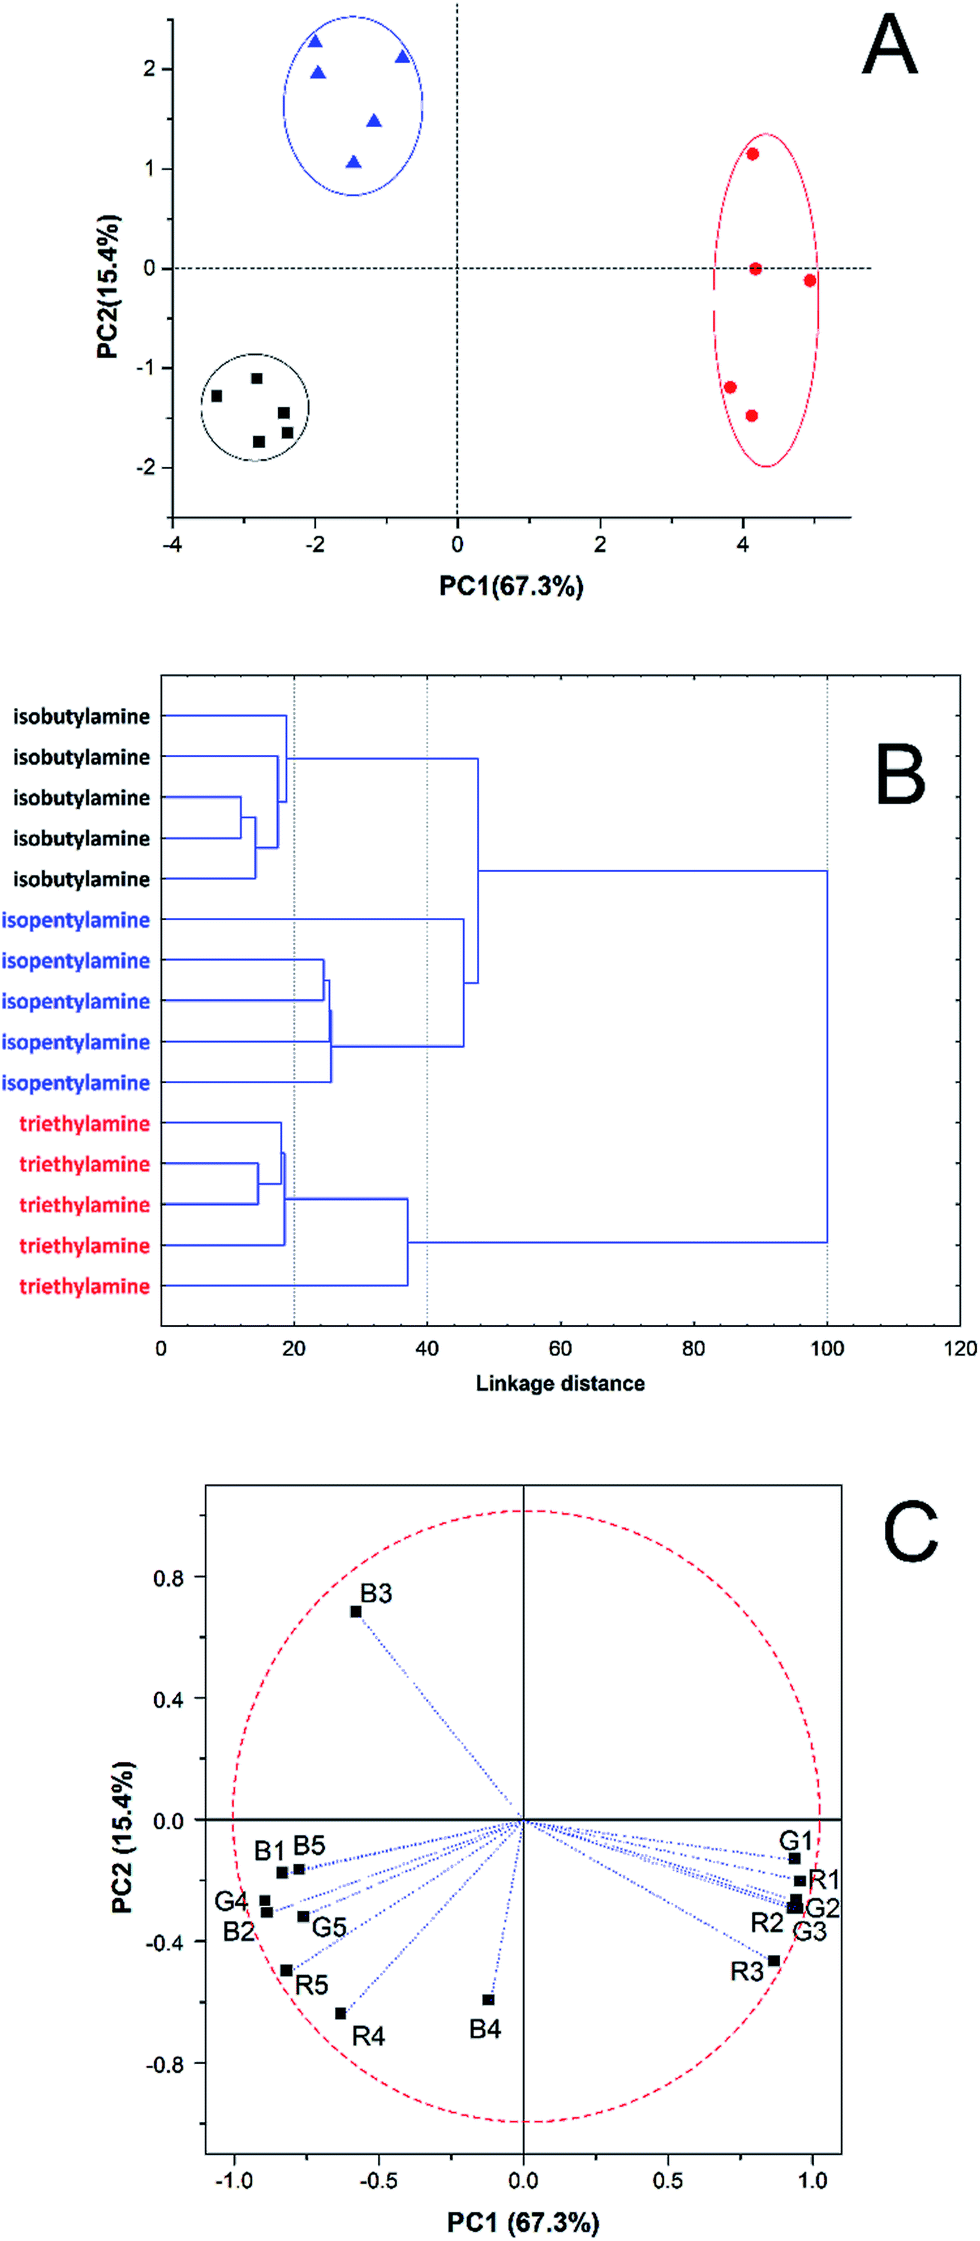 | ||
Fig. 2 (A) PCA scores plot obtained from the RGB values extracted from the coloured membranes with 5 pH indicators in contact with three different amines ( – isobutylamine; – isobutylamine;  – triethylamine and – triethylamine and  – isopentylamine) at a concentration of 5 ppm. (B) HCA plot. (C) PCA loading plot. Values of 1 to 5 indicate the R, G and B values of the spots represented in Fig. 1. – isopentylamine) at a concentration of 5 ppm. (B) HCA plot. (C) PCA loading plot. Values of 1 to 5 indicate the R, G and B values of the spots represented in Fig. 1. | ||
By analysing the data presented in Fig. 2A, a clear distinction can be made between the three amines studied using two first principal components with 82.7% of the total information collected by the RGB values extracted. This, therefore, circumvents any necessity for human intervention or interpretation to discriminate between the colours of the difference maps. Such discrimination can be confirmed with a HCA graph (or dendrogram), Fig. 2B, where three different groups are seen without any misclassification. A loading plot (Fig. 2C), was made to understand which variables were responsible for the discrimination reported in Fig. 2A. This plot shows that the blue component in the chlorophenol red is the most important variable to keep isopentylamine samples in the first quadrant. The dyes alizarin and bromophenol blue (with red and green components) prevail to discriminate triethylamine. In the discrimination process of the isobutylamine, the most predominant variables are R, G and B values of the spots with methyl red and thymol blue. This first discrimination was performed using a concentration of amines equal to 5 ppm. The amount of amine detected is already low when compared with the necessities to detect amine in the literature,53,54 which can exceed 250 ppm. However, new experiments were conducted in order to evaluate the minimum concentration that the device can show a good discrimination for the three amines. The membranes with different dyes were tested at different times, following the same procedure. After achieving good discrimination of amines with a vapour concentration of 5 ppm, we decided to reduce this concentration to 2.5 and 1 ppm (Fig. S1A and S2A, ESI†).
In Fig. S1A and S2A,† we can see an even better discrimination between the amines, which can be confirmed not only by the PCA, having approximately 70% of the original information in the first two components, but also by the HCA data (Fig. S1A and S2A†), since there is no misclassification. The HCA in Fig. S2A† shows that a lower concentration provides better relationship between samples of the same group, since the clusters of samples are much better defined and without any misclassification. In all cases, the membranes were responding to the vapours in less than five minutes with some of the dyes. The optimum exposure time was found to be 10 minutes in order to have a recognisable pattern and also to ensure that the membrane had sufficient time to interact with the volatile exposure For exposure times in excess of 10 minutes, no further changes in the PCA score plots were observed (data not shown). It is interesting to highlight that the discrimination of three amine at concentration lower than 5 ppm were only achieved using all five dyes. For concentration higher than 5 ppm it was possible to discriminate the amines using a system contain four dyes (alizarin, chlorophenol blue, methyl red and thymol blue) (data not shown). However, larger distance between the amines cluster at the score plot were always achieved using five dyes.
The membranes were tested the way mentioned in the Materials and Methods section and also in the absence of the plasticizer (results not shown). In the absence of the plasticizer, not all the membranes showed a colour change, since the polymer has formed a dense film with reduced polymer segmental motion resulting in very low permeability, to volatiles, bacteria, and water. However, the main aim is to create a permeable membrane capable of absorbing species such as amines, which have the ability to change the colour of the dye arrangement individually, thus creating a fingerprint for each species tested and allowing discrimination in real food samples. Hence, membranes composed of cellulose acetate and the surfactant Tween® 20 are more flexible and stable with homogeneous porosity that allows entry of volatile compounds such as amines, making it possible to change colour. Furthermore, the addition of dyes makes possible an array of detectors that may have applications in real food and biological samples.
In the case of food samples, the system may be useful in the future to monitor pathogenic or non-pathogenic microorganisms alike, since these both release volatiles to colonize food. These compounds can form patterns for each group of microorganisms and thus may be considered fingerprints thereof. The system proposed here could be applied to real samples such as fish and meat, since a comparison with what is reported in the literature shows that our detection limits are lower (1–5 ppm), than for biogenically produced amines such as histamine, putrescine, cadaverine, among others, for which values can reach 600 ppm.55,56
In order to demonstrate that our method was semi-quantitative, calibration curves were constructed using the Euclidean distance (ED) as previously proposed.9,51 Fig. S3 (ESI†) shows the calibration curve obtained for each amine, indicating that some quantitative information could be extracted using the proposed device with a small linear range (from 2 to 10 ppm for triethylamine, from 2 to 8 ppm for isobutylamine and from 1 to 4 for isopentylamine).
Regeneration and re-use of membranes
After the analytical application of the membranes, experiments were performed in order to show the ability for membranes to be regenerated post-exposure and to study the reversibility of the amine permeation process. After the exposure of the membranes for 10 minutes of an amine concentration, all used membranes were isolated from the amine headspace in a fume hood for some hours to guarantee complete removal of volatiles. Close to six hours after the exposure, alizarin and chlorophenol red membranes fully returned to their original colour (by eye); the methyl red modified membrane required more time to return to the original colour (approximately 20 hours). We again determined the R, G and B values for the spot number 1 (alizarin dye) with time (Fig. 3). In addition to the re-use tests, the regeneration process was also monitored by taking snapshots at different times (Fig. 3A). It is possible to see in Fig. 3B, that all the RGB values return to the original value after 365 minutes (6 hours). Bromophenol blue and thymol blue did not return to their original state and needed to be replaced with new membranes for replicate experiments. Additionally, we evaluated the number of loadings and regeneration cycles that a single membrane could undergo without affecting the RGB values and we achieved a value of 14 cycles of use without significant changes of these values (95% confidence). Therefore, while some membrane–dye systems exhibit reversibility in colour, others do not. The irreversible nature of the device could have interesting uses in tamper-resistance food packaging preventing the re-use of the plastic membrane.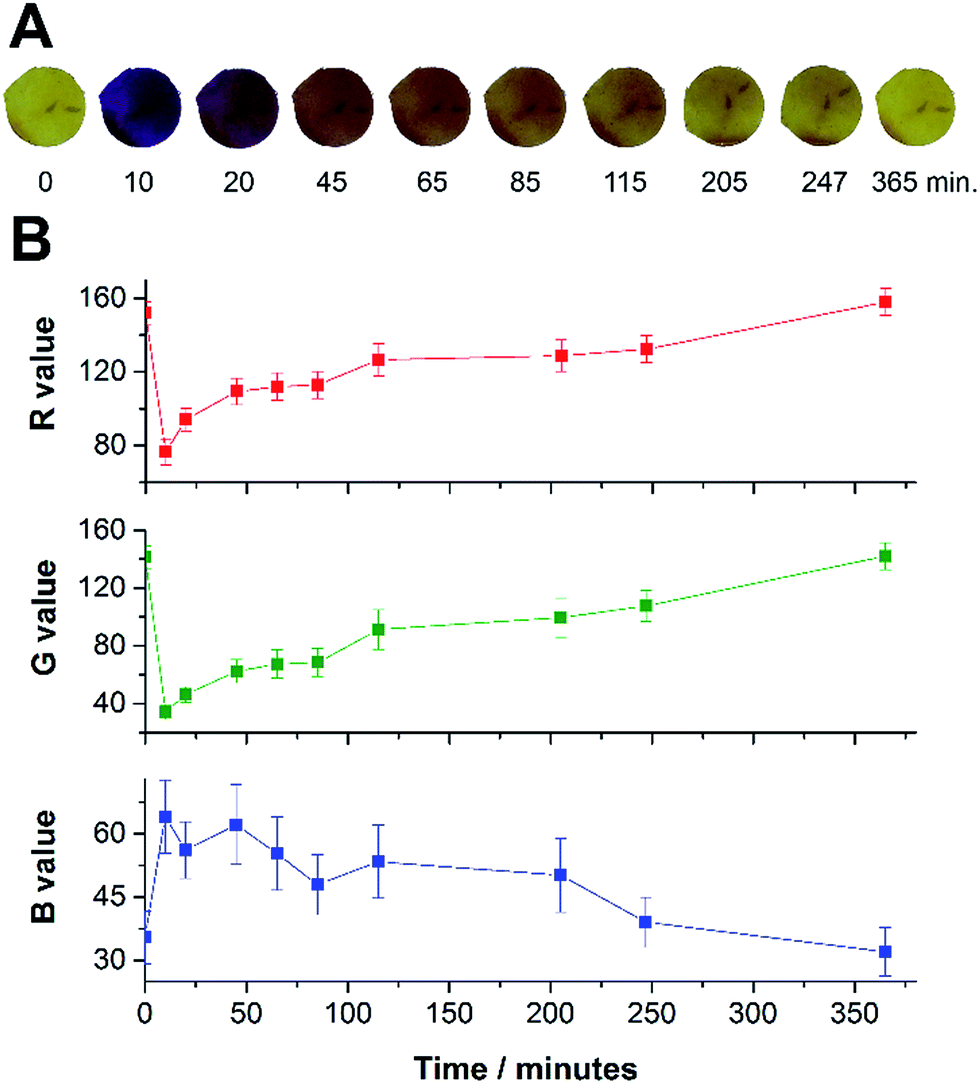 | ||
| Fig. 3 Regeneration test monitoring: images obtained for each experiment time (A) and the R, G and B values for the spot number 1 Fig. 1 (alizarin) (B). Number of replicates = 3. | ||
Application in a real sample
In order to evaluate the possibility to discriminate each compound individually, meat samples were contaminated with each compound in order to simulate samples contaminated with microorganism that produce such volatiles. Fig. 4 shows the possibility to discriminate meat samples contaminated with each of the amines. There are 3 clear clusters in the plot, following the standard of the early tests (without the real sample, Fig. 2). It is important to highlight that the sensor array did not change colour in the presence of meat without contamination, and for this reason, experimental data for non-contaminated meat sample was not included in the score plot since there were not standard deviation between each measurement (n = 4).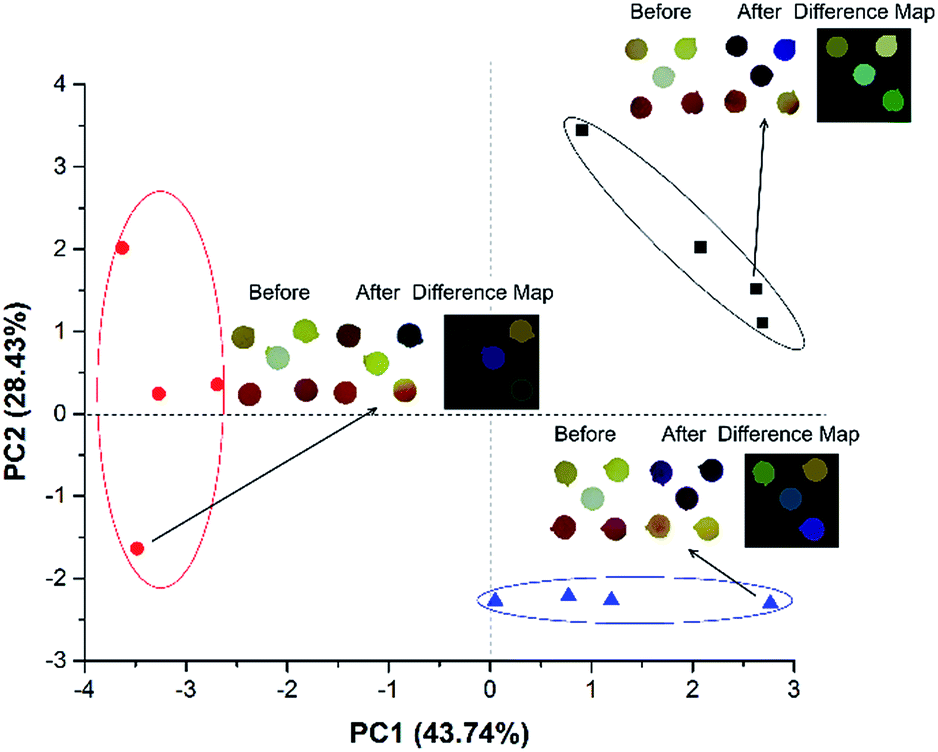 | ||
Fig. 4 PCA scores plot obtained from the RGB values extracted from the coloured membranes with 5 pH indicators in contact with volatile phase collected from a chamber containing meat contaminated with:  – isobutylamine; – isobutylamine;  – triethylamine and – triethylamine and  – isopentylamine. Highlighted images show the real images of the colour changes profile of the sensor array for one of the experiments before and after the meat is contaminated with each amine and respectively difference map for each experiment. – isopentylamine. Highlighted images show the real images of the colour changes profile of the sensor array for one of the experiments before and after the meat is contaminated with each amine and respectively difference map for each experiment. | ||
Detection of biogenic amines
Additionally, we performed experiments to demonstrate the possibility to detect biogenic amines with this proposed method in order to show the possibility to discriminate other amines released by other microorganisms. Since these amines were in the solid form and had high boiling points, a solubilisation step (in water) was necessary. Thus, the biogenic amines were used in the liquid form on the membranes, after recording a “blank” using only water. The results of this experiment can be seen in the Fig. 5, wherein each amine takes place in a different quadrant in the plot, indicating that the proposed device can be useful to discriminate biogenic amines too. Additionally, we show in the ESI (Fig. S4†) the possibility to discriminate all amines studied in this work at the same score plot. Experiments in order to evaluate better limits of discrimination for these biogenic amines will be performed in future.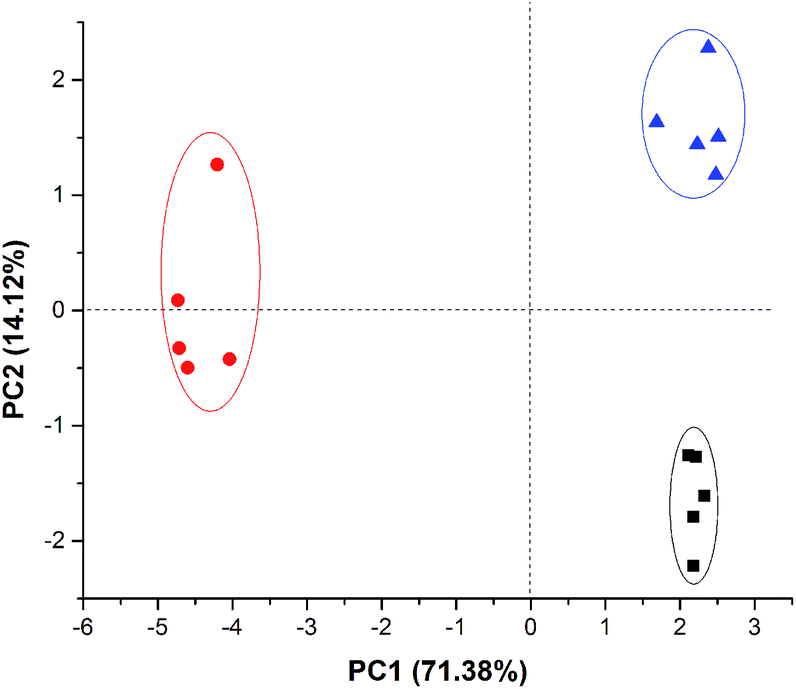 | ||
Fig. 5 PCA scores plot obtained from the RGB values extracted from the coloured membranes with 5 pH indicators in contact with three different biogenic amines ( – tyramine; – tyramine;  – putrescine and – putrescine and  – cadaverine). Amount of amine added 65 μg tyramine, 3.6 mg putrescine and 87 μg cadaverine. – cadaverine). Amount of amine added 65 μg tyramine, 3.6 mg putrescine and 87 μg cadaverine. | ||
Conclusions
In this study, we successfully applied a colorimetric plastic-based device to discriminate three amines, demonstrating that this technique is a good candidate for producing a fast discrimination process and for potential use in food packaging. The extracted information from the colorimetric plastic based-device consisted of the RGB values of each spot containing 5 pH indicators dyes, evaluated using a smartphone and custom software. These values were analyzed using chemometric methods (PCA and HCA), and a distinct and unique pattern could be obtained for each amine using this very simple and inexpensive device for concentrations down to 1 ppm of amine. Additionally, the semi-quantitative performance ability of the device was investigated and demonstrated using a Euclidian distance approach.Acknowledgements
The authors are grateful to Fundação de Amparo à Pesquisa do Estado de São Paulo (FAPESP; grant numbers 2012/12106-5 and 2011/23355-3), Coordenação de Aperfeiçoamento de Pessoal de Nível Superior (CAPES), Conselho Nacional de Desenvolvimento Científico e Tecnológico (CNPq; grant numbers 470919/2011-6 and 302700/2011-0), the Royal Society [Grant number IE130745] and the Natural Environment Research Council [Grant number NE/J01/7671] for financial support. The authors are also grateful to Eric Tavares da Costa for all the help with chamber fabrication, and to Luis Antonio Malheiros Meloni for help in coding the custom application.Notes and references
- A. Rahman, S. M. Al-Reza, J. I. Yoon and S. C. Kang, J. Sci. Food Agric., 2009, 89, 876–881 CrossRef CAS.
- M. E. Nyenje, C. E. Odjadjare, N. F. Tanih, E. Green and R. N. Ndip, Int. J. Environ. Res. Public Health, 2012, 9, 2608–2619 CrossRef PubMed.
- A. H. Havelaar, A. Cawthorne, F. Angulo, D. Bellinger, T. Corrigan, A. Cravioto, H. Gibb, T. Hald, J. Ehiri, M. Kirk, R. Lake, N. Praet, N. Speybroeck, N. de Silva, C. Stein, P. Torgerson, T. Kuchenmueller and E. Foodborne Dis Burden, Lancet, 2013, 381, 59 CrossRef.
- W. H. Organization, Foodborne diseases, http://www.who.int/topics/foodborne_diseases/en/ Search PubMed.
- A. Pacquit, J. Frisby, D. Diamond, K. T. Lau, A. Farrell, B. Quilty and D. Diamond, Food Chem., 2007, 102, 466–470 CrossRef CAS PubMed.
- J. Kerry and P. Butler, Smart Packaging Technologies for Fast Moving Consumer Goods, John Wiley & Sons, 2008 Search PubMed.
- J. W. Gardner and P. N. Bartlett, Sens. Actuators, B, 1994, 18, 211–220 CAS.
- Y. Vlasov, A. Legin, A. Rudnitskaya, C. Di Natale and A. D'Amico, Pure Appl. Chem., 2005, 77, 1965–1983 CrossRef CAS.
- M. O. Salles, G. N. Meloni, W. R. de Araujo and T. R. L. C. Paixão, Anal. Methods, 2014, 6, 2047–2052 RSC.
- C. Zhang and K. S. Suslick, J. Am. Chem. Soc., 2005, 127, 11548–11549 CrossRef CAS PubMed.
- E. A. Baldwin, J. H. Bai, A. Plotto and S. Dea, Sensors, 2011, 11, 4744–4766 CrossRef PubMed.
- Y. Zhang, J. R. Askim, W. Zhong, P. Orlean and K. S. Suslick, Analyst, 2014, 139, 1922–1928 RSC.
- L. Feng, C. J. Musto and K. S. Suslick, J. Am. Chem. Soc., 2010, 132, 4046–4047 CrossRef CAS PubMed.
- J. Long, J. Xu and S. Xia, in Proceedings of International Conference on Smart Grid and Clean Energy Technologies, ed. Q. Huang and J. Z. Kang, 2011, vol. 12 Search PubMed.
- C. L. Lonsdale, B. Taba, N. Queralto, R. A. Lukaszewski, R. A. Martino, P. A. Rhodes and S. H. Lim, PLoS One, 2013, 8, e62726 CAS.
- Y. Salinas, J. V. Ros-Lis, J.-L. Vivancos, R. Martinez-Manez, M. Dolores Marcos, S. Aucejo, N. Herranz, I. Lorente and E. Garcia, Food Control, 2014, 35, 166–176 CrossRef PubMed.
- C. Zhang and K. S. Suslick, J. Agric. Food Chem., 2007, 55, 237–242 CrossRef CAS PubMed.
- Q. Chen, A. Liu, J. Zhao and Q. Ouyang, J. Pharm. Biomed. Anal., 2013, 84, 77–89 CrossRef CAS PubMed.
- J. R. Carey, K. S. Susick, K. I. Hulkower, J. A. Imlay, K. R. C. Imlay, C. K. Ingison, J. B. Ponder, A. Sen and A. E. Wittrig, J. Am. Chem. Soc., 2011, 133, 7571–7576 CrossRef CAS PubMed.
- S.-C. Tseng, C.-C. Yu, D. Wan, H.-L. Chen, L. A. Wang, M.-C. Wu, W.-F. Su, H.-C. Han and L.-C. Chen, Anal. Chem., 2012, 84, 5140–5145 CrossRef CAS PubMed.
- A. W. Martinez, S. T. Phillips, E. Carrilho, S. W. Thomas III, H. Sindi and G. M. Whitesides, Anal. Chem., 2008, 80, 3699–3707 CrossRef CAS PubMed.
- L. Sutarlie and K.-L. Yang, Sens. Actuators, B, 2008, 134, 1000–1004 CrossRef CAS PubMed.
- N. T. Greene and K. D. Shimizu, J. Am. Chem. Soc., 2005, 127, 5695–5700 CrossRef CAS PubMed.
- G. Dimeski, T. Badrick and A. St John, Clin. Chim. Acta, 2010, 411, 309–317 CrossRef CAS PubMed.
- M. Kyrolainen, S. M. Reddy and P. M. Vadgama, Anal. Chim. Acta, 1997, 353, 281–289 CrossRef CAS.
- I. M. Christie, P. Treloar, S. Reddy, C. Hepburn, J. Hulme and P. Vadgama, Electroanalysis, 1997, 9, 1078–1082 CrossRef CAS.
- S. M. Reddy and P. M. Vadgama, Anal. Chim. Acta, 1997, 350, 67–76 CrossRef CAS.
- S. M. Reddy and P. M. Vadgama, Biosens. Bioelectron., 1997, 12, 1003–1012 CrossRef CAS.
- S. M. Reddy and P. M. Vadgama, Anal. Chim. Acta, 1997, 350, 77–89 CrossRef CAS.
- R. Catalá, P. Hernández-Muñoz and R. Gavara, in Environmentally Compatible Food Packaging, ed. E. Chiellini, Woodhead Publishing, 2008, pp. 419–438 Search PubMed.
- N. A. Rakow, A. Sen, M. C. Janzen, J. B. Ponder and K. S. Suslick, Angew. Chem., Int. Ed., 2005, 44, 4528–4532 CrossRef CAS PubMed.
- Q. Chen, H. Li, Q. Ouyang and J. Zhao, Sens. Actuators, B, 2014, 205, 1–8 CrossRef CAS PubMed.
- D. Pezo, M. Fedeli, O. Bosetti and C. Nerin, Anal. Chim. Acta, 2012, 756, 49–59 CrossRef CAS PubMed.
- X. W. Huang, X. B. Zou, J. Y. Shi, Y. N. Guo, J. W. Zhao, J. C. Zhang and L. M. Hao, Food Chem., 2014, 145, 549–554 CrossRef CAS PubMed.
- S. B. Patange, M. K. Mukundan and K. A. Kumar, Food Control, 2005, 16, 465–472 CrossRef CAS PubMed.
- Y. Salinas, J. V. Ros-Lis, J. L. Vivancos, R. Martinez-Manez, M. D. Marcos, S. Aucejo, N. Herranz and I. Lorente, Analyst, 2012, 137, 3635–3643 RSC.
- J.-D. Lee and J.-I. Hong, Tetrahedron Lett., 2013, 54, 2890–2893 CrossRef CAS PubMed.
- S.-I. Sasaki, Y. Kotegawa and H. Tamiaki, Bull. Chem. Soc. Jpn., 2009, 82, 267–271 CrossRef CAS.
- A. J. Milun, Anal. Chem., 1957, 29, 1502–1504 CrossRef CAS.
- L. K. Fiddes, J. Chang and N. Yan, Sens. Actuators, B, 2014, 202, 1298–1304 CrossRef CAS PubMed.
- A. Tricoli, M. Righettoni and A. Teleki, Angew. Chem., Int. Ed., 2010, 49, 7632–7659 CrossRef CAS PubMed.
- S. L. Snellings, N. E. Takenaka, Y. Kim-Hayes and D. W. Miller, J. Food Sci., 2003, 68, 1548–1553 CrossRef CAS PubMed.
- J. Dadamio, M. Van Tornout, S. Van den Velde, R. Federico, C. Dekeyser and M. Quirynen, J. Breath Res., 2011, 5, 5 CrossRef PubMed.
- B. Kuswandi, Jayus, A. Restyana, A. Abdullah, L. Y. Heng and M. Ahmad, Food Control, 2012, 25, 184–189 CrossRef CAS PubMed.
- P. Malle and I. Lepezennec, Sci. Aliments, 1992, 12, 257–269 CAS.
- N. A. M. Eskin, Biochemistry of Foods, Elsevier Science, 1990 Search PubMed.
- Y. Wang, S. Zhang, J. Yu, H. Zhang, Z. Yuan, Y. Sun, L. Zhang, Y. Zhu and H. Song, Food Control, 2010, 21, 302–305 CrossRef PubMed.
- L. Larsson, P. A. Mardh and G. Odham, Acta Pathol. Microbiol. Scand., Sect. B: Microbiol., 1978, 86, 207–213 CAS.
- J. M. Sabota, W. L. Hoppes, J. R. Ziegler, H. DuPont, J. Mathewson and G. W. Rutecki, Am. J. Gastroenterol., 1998, 93, 118–119 CrossRef CAS PubMed.
- EPA, United States Environmental Protection Agency, Triethylamine Hazard Summary, http://www.epa.gov/ttnatw01/hlthef/tri-lami.html.
- L. Feng, Y. Zhang, L. Wen, Z. Shen and Y. Guan, Talanta, 2011, 84, 913–917 CrossRef CAS PubMed.
- A. Maines, A. Cambiaso, L. Delfino, G. Verreschi, I. Christie and P. Vadgama, Anal. Commun., 1996, 33, 27–30 RSC.
- E. Parente, M. Martuscelli, F. Gardini, S. Grieco, M. A. Crudele and G. Suzzi, J. Appl. Microbiol., 2001, 90, 882–891 CrossRef CAS.
- J. D. Coisson, C. Cerutti, F. Travaglia and M. Arlorio, Meat Sci., 2004, 67, 343–349 CrossRef CAS PubMed.
- G. Suzzi and F. Gardini, Int. J. Food Microbiol., 2003, 88, 41–54 CrossRef CAS.
- J. Lange and C. Wittmann, Anal. Bioanal. Chem., 2002, 372, 276–283 CrossRef CAS PubMed.
Footnote |
| † Electronic supplementary information (ESI) available. See DOI: 10.1039/c5ra01822f |
| This journal is © The Royal Society of Chemistry 2015 |