 Open Access Article
Creative Commons Attribution 3.0 Unported Licence
Valorization of cellulose and waste paper to graphene oxide quantum dots†
Karin H.
Adolfsson
,
Salman
Hassanzadeh
and
Minna
Hakkarainen
 *
*
Department of Fiber and Polymer Technology, KTH Royal Institute of Technology, SE-100 44 Stockholm, Sweden. E-mail: minna@kth.se; Tel: +46 87908271
First published on 6th March 2015
Abstract
Biobased graphene oxide quantum dots (GOQD) were derived from cellulose via carbon nanospheres (CN) as intermediate products. Solid CN were synthesized from cellulose through microwave-assisted hydrothermal degradation of α-cellulose with H2SO4 as a catalyst at 160 °C. The obtained CN were further utilized for the synthesis of GOQD by a two-step reaction including 30 minutes of sonication followed by heating at 90 °C under O-rich acidic conditions (HNO3). This process broke down the 3D CN to 2D GOQD. The size of the synthesized GOQD was controlled by the heating time, reaching a dot diameter of 3.3 nm and 1.2 nm after 30 and 60 minutes of heating, respectively. The synthesis process and products were characterized by multiple analytical techniques including FTIR, TGA, SEM, TEM, XPS, XRD, BET, DLS and AFM. Interesting optical properties in aqueous solutions were demonstrated by UV/Vis and fluorescence spectroscopy. Finally we demonstrated that corresponding GOQD can be synthesized from waste paper. This production route thus uses renewable and cheap starting materials and relatively mild synthesis procedures leads to instant nanometric production of 2D dots. In addition it enables recycling of low quality waste to value-added products.
1. Introduction
Graphene,1 an sp2-hybridized carbon sheet, has arisen as a fascinating new carbon material. It possesses properties such as large surface area, high Young's modulus, high carrier mobility, high optical transparency, thermal and electrical conductivity2,3 and has great potential in applications ranging from transistors and sensors to transparent conductive films, clean energy devices and graphene–polymer nanocomposites.4–7 However, its potential in biomedical applications is limited due to poor solubility in common solvents and inadequate optoelectronic properties.8Graphene oxide, as a direct derivative of graphene, consists of small graphene domains surrounded by carboxyl, epoxyl and hydroxyl groups that provide H2O solubility.9 When the size of the sheets is less than 100 nm they are referred to as graphene oxide quantum dots (GOQD). Nano-sized graphene oxide has attracted attention due to its low C/O ratio and enhanced colloidal stability.10
Primarily, graphene oxide was mainly used as a precursor for graphene but the focus has now shifted due to its interesting heterogeneous and electronic structure with simultaneous conducting π-states and energy bandgap.11 Application alternatives have emerged in electrically conductive plastics, optical materials, solar cells, biomedical devices, biosensors and catalysis systems.12–17
The most common method for preparation of graphene oxide is through Hummers method18,19 or its modifications involving oxidation of graphite with potassium permanganate and sulfuric acid (H2SO4).20–22 Exfoliation is used for separating the oxygen-functionalized graphite into single sheets.23 Therefore, it can be considered that every carbon structure with graphite content is a possible source of graphene oxide including carbon nanospheres (CN) formed of graphitic flakes.24
CN production from various carbon precursors has recently been reported.25–27 Among the possible precursors, cellulose is especially interesting because it is an almost inexhaustible non-editable and renewable resource.28 The β-(1-4)-glycosidic linkages in cellulose are protected within the crystalline structure and by the intense intra- and intermolecular hydrogen bonding in the polymer backbone and between the fibrils.29 Conversely, this production route for synthesis of CN generally requires harsh conditions.27,29 Many of the processes used are not suitable for scaling up since they are not based on green chemistry principles. Also, they are costly and non-selective, which leads to several purification steps.
Recently, we demonstrated that CN can be synthesized as a by-product of microwave-assisted hydrothermal degradation of cellulose, starch or waste paper under relatively mild conditions.30–32 Our hypothesis here was that the CN produced through green microwave-assisted synthesis, could be further oxidized to novel value-added GOQD materials. This production route further provides the advantage of using and/or upgrading renewable and waste resources to value-added products. The oxidation–degradation reaction of the microwave synthesized cellulose based CN was performed in an O-rich environment and under mild conditions forming nano-sized sheets of GOQD. The CN precursors and obtained GOQD were characterized by multiple techniques to demonstrate a successful reaction as well as to show the fluorescence properties of the synthesized GOQD.
2. Experimental
2.1 Materials
H2SO4 (95–98%), nitric acid (HNO3) (70%) and α-cellulose were obtained from Sigma-Aldrich Chemie GmbH (Steinheim, Germany and St. Louis, USA). The cellulose rich waste products were brown paper tissues (BT) KATRIN Basic (25 × 20.6 cm). Graphitized carbon black 4 (GCB, mesh > 400, surface area: 210 m2 g−1) was provided by the Laboratori Analitici di Ricerca Associati (Formello, Rome, Italy). All chemicals were used as received.2.2 Microwave-assisted synthesis of CN
CN were derived from cellulose or waste paper through microwave-assisted synthesis according to our previously reported procedure.30,31 The reaction was performed in a MES-1000 instrument under dynamic mode (CEM Corporation with maximum power of 950 Watts ± 50). Briefly, α-cellulose was degraded in 20 ml of 0.01 g ml−1 H2SO4 solution in 100 ml Teflon PFA vessels. Temperature and pressure were followed by optical probe inserted in one of the vessels. The temperature was first set to increase to 160 °C under a RAMP-time of 20 minutes and then kept at isothermal conditions by input irradiation for 2 hours with a maximum pressure of 150 psi. The power effect was 100% for the duration of the reaction. After the reaction, the vessels were taken out and they were put into an ice bath to cool down. The resulting black solid CN were filtered from the solution and washed with 20 ml of deionized H2O. The CN samples were dried in a vacuum oven overnight at 25 °C.2.3 GOQD synthesis
For the preparation of GOQD, a 15 ml solution of CN in HNO3 (1![[thin space (1/6-em)]](https://www.rsc.org/images/entities/char_2009.gif) :
:![[thin space (1/6-em)]](https://www.rsc.org/images/entities/char_2009.gif) 100, w/w) was kept in a 100 ml one-neck round-bottom flask and sonicated at 45 °C for 30 minutes in sonication bath. GOQD-30 and GOQD-60 were obtained by 30 or 60 minutes heating of the sonicated solutions in an oil bath at 90 °C with magnetic stirring. The solutions were then poured into 50 ml of cold deionized H2O (15 °C) to stop the reaction and dilute the acidic medium. An orange/red solid was gained after removal of the acidic H2O by rotary evaporation. The products were kept in a vacuum oven for one week to remove any residues of H2O and acid. The GOQD prepared from waste paper derived CN were synthesized according to the same procedure as GOQD-30.
100, w/w) was kept in a 100 ml one-neck round-bottom flask and sonicated at 45 °C for 30 minutes in sonication bath. GOQD-30 and GOQD-60 were obtained by 30 or 60 minutes heating of the sonicated solutions in an oil bath at 90 °C with magnetic stirring. The solutions were then poured into 50 ml of cold deionized H2O (15 °C) to stop the reaction and dilute the acidic medium. An orange/red solid was gained after removal of the acidic H2O by rotary evaporation. The products were kept in a vacuum oven for one week to remove any residues of H2O and acid. The GOQD prepared from waste paper derived CN were synthesized according to the same procedure as GOQD-30.
2.4 Characterization
Mettler-Toledo TGA/SDTA 851e was utilized for the thermogravimetric analysis (TGA) of α-cellulose, CN and GOQD. 3–4 mg of each sample was placed into a 70 μl alumina cup. The samples were then heated at a rate of 10 °C min−1 from 30 °C to 550 °C with an O2 flow rate of 80 ml min−1. Fourier transform infrared spectroscopy (FTIR) of α-cellulose, waste paper, CN before and after sonication in HNO3, GOQD-30 and GOQD-60 were obtained by PerkinElmer Spectrum 2000 FTIR spectrometer (Norwalk, CT). The instrument was equipped with attenuated total reflectance (ATR) accessory (golden gate) from Graseby Specac (Kent, United Kingdom). The X-Ray Photoelectron Spectroscopy (XPS) spectra of CN and GOQD-60 were collected by a Kratos Axis Ultra DLD electron spectrometer using monochromated Al Kα source operated at 150 W. Pass energy of 160 eV were applied for wide spectra analyzer and pass energy of 20 eV for individual photoelectron lines. The surface potential was stabilized by the spectrometer charge neutralization system. The binding energy (BE) scale was referenced to the C1s line of aliphatic carbon, set at 285.0 eV. Processing of the spectra was accomplished with the Kratos software. Powder sample for the analysis was gently hand-pressed into a pellet directly on a sample holder using clean Ni spatula. The scanning electron microscopy (SEM) images, for picturing the morphologies and sizes of α-cellulose, CN and GOQD-60, were taken by Ultra-High Resolution FE-SEM (Hitachi S-4800). The samples were sputter-coated with 2 nm thick platinum/palladium layer. Ultraviolet-visible (UV/Vis) absorption of GOQD-60 in deionized H2O solution was measured by SHIMADZU UV-2550 UV/Vis. For transmission electron microscopy (TEM) images, HITACHI HT7700 instrument including the software version 02/05 was utilized. Aqueous dispersions of CN and GOQD-60 were drop-casted on the TEM grid (ultrathin carbon coated copper grid (TED PELLA, INC.)) and the excess H2O was removed with a paper tissue after 2 min to decrease the possibility of aggregation of nanoparticles or formed films of GOQD. The samples were left to dry in a dust free chamber for at least 1 h before the analyses in either high-contrast mode TEM (HC-TEM) or high-resolution mode TEM (HR-TEM). X-ray diffraction (XRD) spectra were recorded for α-cellulose, waste paper, GCB, CN, GOQD-30 and GOQD-60. The X-ray source was CuKR radiation (λ = 0.1541 nm) and the diffraction was measured by PANalytical X'Pert PRO diffractometer at 25 °C with a silicium mono-crystal sample holder. The intensity was determined in a 2θ angular range between 5–55° with a step size of 0.017° for all analyses. Furthermore, the crystallinity index (CI) of α-cellulose was calculated according to Segal method (eqn (1)).33 | (1) |
In the XRD-spectrum of α-cellulose the height of I002 includes both crystalline and amorphous material (2θ = 22.7°). Iam is the minimum height between the peaks at (002) and (110) (2θ = 18°) and corresponds to amorphous material. Fluorescence spectroscopy measurements were performed by Cary Eclipse spectrophotometer from Varian. The fluorescence emission of GOQD-60 in deionized H2O solution was measured at an excitation wavelength of 330 nm. The instrument uses xenon lamp technology. A Brunauer–Emmett–Teller (BET) measurement was made to determine the surface area of CN as an indication of particle size. The measurement was done by using Micromeritics Flow Sorb II 2300 and is based on BET theory. Dynamic light scattering (DLS) measurements of CN and GOQD-30 and GOQD-60 solutions were carried out on Zetasizer Nano ZS from Malvern Instruments (Malvern, UK) where polylactide (RI 1.46) was used as standard for all measurements. A Nanoscope IIIa multimode atomic force microscopy (AFM) (Digital Instruments, Santa Barbara, CA) in tapping mode was performed to image the materials under ambient conditions (20–25 °C). Freshly cleaved mica (grade V-1, Electron Microscopy Sciences) was used as a surface for all the samples. AFM images of CN and bulk GOQD-60 were acquired from their solid powder. H2O dispersion of GOQD-60 was also drop-casted on the mica surface under dust free conditions to be able to image smaller domains of the GOQD sheets.
3. Results and discussion
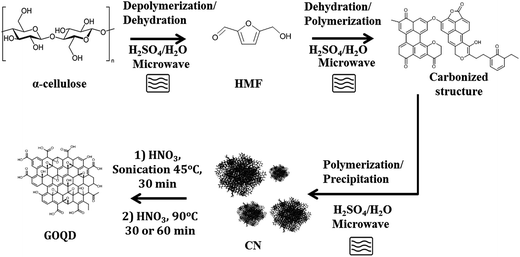
CN were synthesized from pure α-cellulose and/or waste paper by microwave-assisted reaction and utilized as novel precursors for synthesis of GOQD as shown schematically in Fig. 1. The obtained CN and the oxidized products, GOQD, were characterized by multiple techniques to establish the effect of reaction time on size and chemistry of the produced GOQD. Furthermore, the optical properties of GOQD were evaluated.3.1 Characterization of CN
Fig. 1 displays a simplified reaction scheme for the microwave-assisted synthesis of CN and the further degradation–oxidation reaction to GOQD. 5-(Hydroxymethyl)-2-furaldehyde (HMF) intermediate is formed through depolymerization of α-cellulose to glucose followed by a dehydration reaction. HMF rapidly further reacts to form either levulinic and formic acid or carbonized flake structures through polymerization and dehydration of HMF.30,34 These carbonized structures then precipitate as spherical carbon nanospheres. CN were produced during hydrothermal degradation of cellulose under conditions where the liquefaction efficiency and hydrolysis rate were high (T > 140 °C).Fig. S1 (in ESI†) shows the FTIR spectrum of the raw material, α-cellulose, and the produced CN. α-Cellulose has its typical vibration modes of hydroxyl (C–OH) (3300–3500 cm−1), sp3-hybridised carbon (C–H) (∼2980 cm−1), C–O group (1050 cm−1) and ether linkage (C–O–C) (1160 cm−1 and 950 cm−1). Formation of carbonous functional groups in the CN was confirmed by the appearance of carboxylic acid (COO–H stretching as broad band in the region 3300–2500 cm−1, C![[double bond, length as m-dash]](https://www.rsc.org/images/entities/char_e001.gif) O stretching at 1705 cm−1 and peaks in the region at 1000–1260 cm−1 due to C–O stretching) and aromatic groups (sp2-hybridized carbon C
O stretching at 1705 cm−1 and peaks in the region at 1000–1260 cm−1 due to C–O stretching) and aromatic groups (sp2-hybridized carbon C![[double bond, length as m-dash]](https://www.rsc.org/images/entities/char_e001.gif) C stretching at ∼1507 and 1618 cm−1).
C stretching at ∼1507 and 1618 cm−1).
SEM images in Fig. 2 illustrate the morphological change from untreated fibrous α-cellulose (average size of mm in length) and (μm in width) to the obtained CN, with a spherical shape and diameter sizes in the range between nm and μm. In accordance with the typical unmodified nanoparticle behavior, some agglomeration of the carbon particles was observed.
Furthermore, the morphology and size of CN were investigated by HC-TEM. The HC-TEM images in Fig. 3 confirmed the spherical morphology of the CN, their size dispersity and aggregation tendency. Both HC-TEM and SEM of the CN were further supported by BET-results that displayed a surface area of 3.1 m2 g−1, indicating that the obtained CN in their inactivated form were a collection of larger spheres with low porosity. The HC-TEM image of a single carbon nanoparticle (Fig. 3c) revealed the presence of thin carbon sheets and graphitic flakes located predominately on the surface of the CN. This appearance is in accordance with the previously reported morphology of CN, where graphitic flakes were located concentrically at the surface.24
3.2 GOQD synthesis
Novel value-added GOQD were synthesized from CN in a bulk reaction under O-rich acidic conditions. The performed degradation–oxidation under size control broke down the 3D CN to 2D GOQD. 1.5 g GOQD-60 was collected after 60 minutes of heating, when the original amount of CN added was 1 g, strongly indicating an introduction of new functional groups, especially in the form of oxygen elements.As shown in Fig. 4, the GOQD synthesis process was monitored by DLS, which in the case of 2D GOQD measures the approximate lateral dimensions, to follow the changes in particle size. A significant decrease in the size of the carbon particles occurred moving from the disassociated CN (after sonication) to GOQD-30 and GOQD-60. The particle size of the CN was 995 ± 123 nm, whereas GOQD reached approximately the average sheet sizes of 3.3 ± 0.37 and 1.2 ± 0.75 nm (dot diameter) for GOQD-30 and GOQD-60, respectively. A prolonged reaction time at a temperature of 90 °C, thus, not only resulted in cleavage of the 3D carbon structures into small 2D dots but also caused further cleavage of GOQD-30 to GOQD-60. This observation revealed that, by controlling the reaction conditions, tuned graphene oxide structures with desired sizes could be obtained.
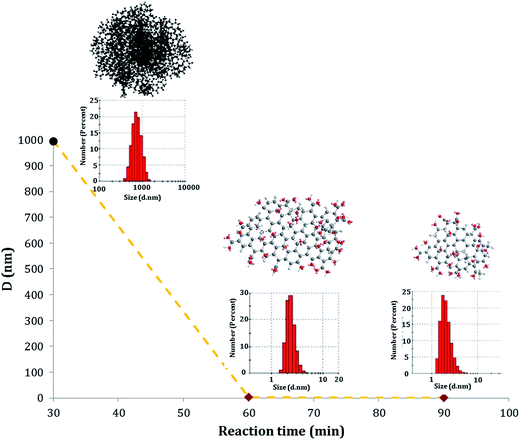 | ||
| Fig. 4 Average sizes and size distributions of CN after sonication (black), GOQD-30 (red in the middle) and GOQD-60 (red) as determined by DLS at 25 °C. | ||
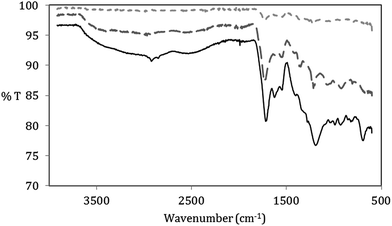
The synthesis process of the GOQD was further monitored by FTIR (Fig. 5). While the CN disassociated after sonication in HNO3, there was no additional introduction of functional groups. However, the FTIR spectrum proved that different oxygen groups were added to both GOQD-30 and GOQD-60. This further confirmed the cause of the observed mass increase. Both GOQD-30 and GOQD-60 displayed characteristic modes of alcohols (stretching of C–OH at 3560 cm−1), carboxylic acids (stretching of C![[double bond, length as m-dash]](https://www.rsc.org/images/entities/char_e001.gif) O at 1740 cm−1, broad stretching of C–OH at 2500–3350 cm−1 and stretching of C–O at 1100 cm−1), aromatic sp2 carbons (stretching of C
O at 1740 cm−1, broad stretching of C–OH at 2500–3350 cm−1 and stretching of C–O at 1100 cm−1), aromatic sp2 carbons (stretching of C![[double bond, length as m-dash]](https://www.rsc.org/images/entities/char_e001.gif) C at ∼1570 cm−1), and epoxides (stretching of C–O–C at 1230 cm−1). Some differences were also observed between GOQD-30 and GOQD-60, including more sp3-hybridized C–H stretches (2920 cm−1) and a broader peak of COOH stretches (3050–3350 cm−1) in GOQD-60. Therefore, as an outcome of increased reaction time, more defect sites were introduced in the carbon structure. Importantly, the functional groups at the edges and in the carbon structure will result in dots that are not completely flat, as is the case for graphene. The oxygen groups provide both bulkiness and absorption of H2O that will lead to a higher monolayer thickness for the graphene oxide11,35 in comparison to the thickness in dry state.
C at ∼1570 cm−1), and epoxides (stretching of C–O–C at 1230 cm−1). Some differences were also observed between GOQD-30 and GOQD-60, including more sp3-hybridized C–H stretches (2920 cm−1) and a broader peak of COOH stretches (3050–3350 cm−1) in GOQD-60. Therefore, as an outcome of increased reaction time, more defect sites were introduced in the carbon structure. Importantly, the functional groups at the edges and in the carbon structure will result in dots that are not completely flat, as is the case for graphene. The oxygen groups provide both bulkiness and absorption of H2O that will lead to a higher monolayer thickness for the graphene oxide11,35 in comparison to the thickness in dry state.
Fig. 6 shows the XPS analysis performed on CN and GOQD-60 (from now referred to as GOQD). It is important to notice that due to the 3D spherical structure and size of the CN, XPS spectrum shows the characteristics of the surface layers and not the core of the spheres. High resolution XPS spectrum of C1s for CN and GOQD exhibited components of C–C, C–O, C–O–C and O![[double bond, length as m-dash]](https://www.rsc.org/images/entities/char_e001.gif) C–O in different intensities and percentages (C1s in Fig. 7a). CN also displayed π–π* shakeup satellite peak at 290.1 eV due to the delocalized π conjugation as a characteristic of aromatic C structure, graphitic flakes and sp2-hybridized carbon sheets (in agreement with the observed graphitic flakes in the TEM images). Expectedly the synthesis of the GOQD from CN was accompanied by a decrease in the calculated C/O ratio from ∼4.2 to ∼2.0 due to increased concentration of functional groups containing oxygen. It is worthwhile to emphasize that this ratio can be even higher for the core of the CN. The concentration of the oxygen containing groups is also expected to be higher at the edges of the GOQD compared to the basal plane. The higher oxygen content of the herein synthesized GOQD compared to the previous studies on graphene oxides,36 which typically had C/O ratios of ∼2.4, is most likely explained by the larger edge/basal plane ratios due to smaller size of the GOQD.
C–O in different intensities and percentages (C1s in Fig. 7a). CN also displayed π–π* shakeup satellite peak at 290.1 eV due to the delocalized π conjugation as a characteristic of aromatic C structure, graphitic flakes and sp2-hybridized carbon sheets (in agreement with the observed graphitic flakes in the TEM images). Expectedly the synthesis of the GOQD from CN was accompanied by a decrease in the calculated C/O ratio from ∼4.2 to ∼2.0 due to increased concentration of functional groups containing oxygen. It is worthwhile to emphasize that this ratio can be even higher for the core of the CN. The concentration of the oxygen containing groups is also expected to be higher at the edges of the GOQD compared to the basal plane. The higher oxygen content of the herein synthesized GOQD compared to the previous studies on graphene oxides,36 which typically had C/O ratios of ∼2.4, is most likely explained by the larger edge/basal plane ratios due to smaller size of the GOQD.
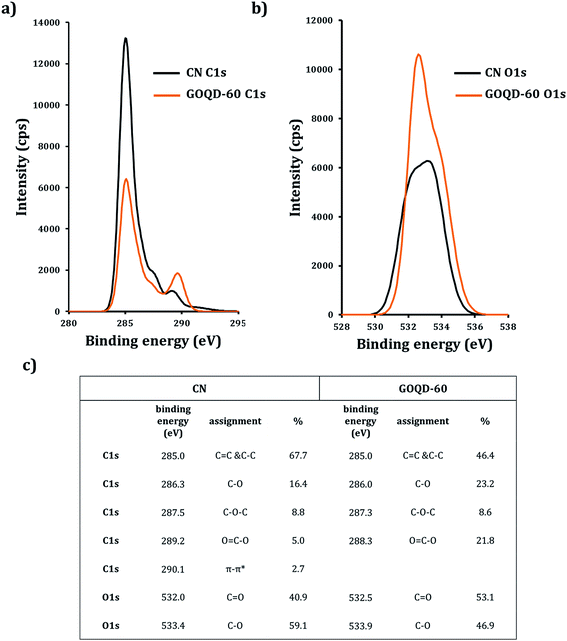 | ||
| Fig. 6 High resolution XPS: (a) C1s and (b) O1s of CN (black line) and GOQD-60 (orange line). (c) Table of C1s and O1s positions and percentages for CN and GOQD-60. | ||
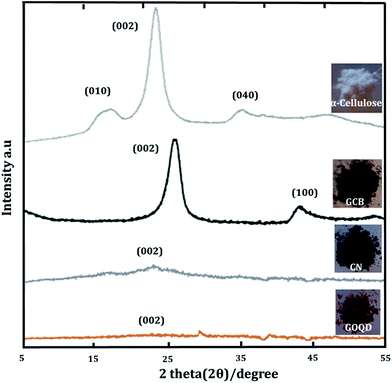
The amorphous character and solid-state structure of starting and synthesized materials were studied by XRD. CN and GOQD were originlly derived from a highly crystalline precursor, α-cellulose, with a crystal index of 64.2% (Fig. 7). While XRD revealed the dominantly amorphous character of the bulk solid-state of CN and GOQD, CN exhibited a small intensity peak at ∼25° corresponding to the (002) graphitic plane.37 The peak observed for CN was both much broader and appeared at a slightly lower diffraction angle in comparison to GCB, a fully graphitized carbon particle, with the (002) graphite peak at 26°.38 The larger interspacing between the crystal planes give rise to a lower diffraction angle39 and as a consequence of the functionalized flakes forming the CN, there was an increased distance between the graphitic layers. As expected, the CN, thus, had lower graphite content than GCB. For GOQD, while a tiny incurvation in the (002) graphitic plane located at ∼23° was detected,40 in consistency with another report,41 a broad peak was indicated as a sign of the loss of long-range order.
The solid-state morphology of bulk GOQD was first monitored by SEM. As seen in Fig. 8, wrinkles, caused by the association of the 2D dots due to the electrostatic forces present between the various functional groups, were formed.42 The single dots are visualized in the defect part of the film as shown in Fig. 8a. AFM images of the bulk GOQD surfaces (Fig. S2, ESI† file) were in agreement with the SEM image in Fig. 8b and emphasized the film-like structure of GOQD caused by the aggregation-stacking of the dots into layers of sheets.
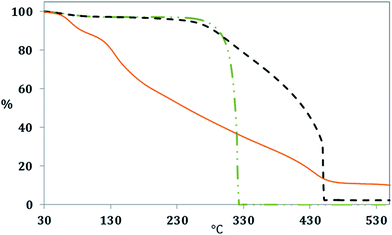
The differences in the chemical structure of the produced cellulose derived CN and GOQD were monitored by evaluating their thermal resistance (Fig. 9). The CN had the same main Ton at around 330 °C as α-cellulose but with enhanced thermal resistance in the range between 330–450 °C. The improved thermal resistance probably originated from the graphitized carbon layers at the surface of the CN and their ability to resist combustion. The combustion of α-cellulose was shown to be complete with no ash content at a temperature of approximately 330 °C, due to high oxygen content, whereas the CN contained an ash residue of 4.4 wt% at a temperature of 450 °C. GOQD were contributing to the obtained TGA curve with several Ton steps (see the DTG curves in Fig. S3 in ESI† file), which is a further indication of oxygen functionalities in the GOQD.43,44 While the first combustion stage started already at around 50 °C, due to the loss of moisture, the second combustion stage begun at approximately 110 °C and the final observed combustion stage took place at a temperature of 400 °C. Interestingly, about 10.5% of GOQD was still stable at 550 °C, even though the oxygen content is higher in comparison to CN. However, the mass loss of GOQD was shown to be lower above ∼450 °C as an outcome of stable oxygen functionalities.45
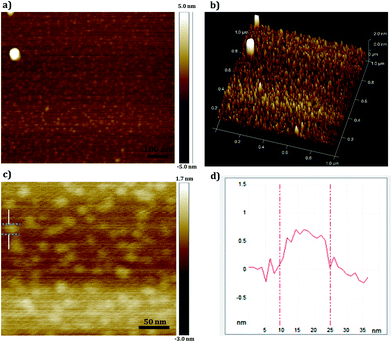
The size and thickness characteristics of a single GOQD layer were investigated by AFM using dilute aqueous solution of GOQD for the disassociation of sheets into dots (Fig. 10). In this regime and based on the DLS measurement of the aqueous solutions, single dots were obtained with Rh ∼ 1 nm. While the single sheet of graphene (atomically flat carbon structure) can reach van der Waals thickness of ∼0.34 nm, the thickness of graphene oxide would be thicker due to the covalently bonded oxygen and displacement of sp3 carbons above and below the plane of graphene. The average thickness of the synthesized GOQD was 0.5 nm (Fig. 10b) and is considered to be an exfoliated monolayer sample of GOQD as the thickness value agrees well with previously reported monolayers of dry graphene oxide.11,46 As can be seen in Fig. 10c and d, AFM visualized sheets with an average size of ∼15 nm. This somewhat larger size which was also seen in HR-TEM of exfoliated single sheet of GOQD (Fig. S4, ESI† file) is probably due to association of the dots and lateral interaction between functional groups at the edges during the drying process, as well an effect of tip convolution.
3.3 Optical properties of GOQD in H2O solution
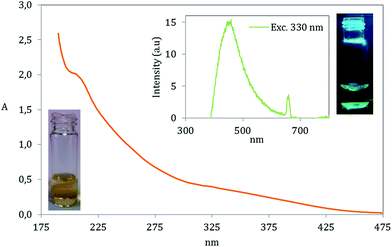
The special chemical structure of GOQD enables them to absorb UV and visible light of lower wavelengths. In accordance with previous works20,47 our GOQD particles displayed two absorption peaks in the UV-range including a small peak at 320 nm corresponding to n → π* transition in C![[double bond, length as m-dash]](https://www.rsc.org/images/entities/char_e001.gif) O and a peak at ∼200 nm having a transition in C
O and a peak at ∼200 nm having a transition in C![[double bond, length as m-dash]](https://www.rsc.org/images/entities/char_e001.gif) C by π → π*, Fig. 11. Interestingly, GOQD synthesized by utilizing the longer heating time (GOQD-60) exhibited a bathochromic shift (∼20 nm red shift) at absorption peak corresponding to n → π* transition in C
C by π → π*, Fig. 11. Interestingly, GOQD synthesized by utilizing the longer heating time (GOQD-60) exhibited a bathochromic shift (∼20 nm red shift) at absorption peak corresponding to n → π* transition in C![[double bond, length as m-dash]](https://www.rsc.org/images/entities/char_e001.gif) O, which is most likely due to the increase in the concentration of carboxyl groups (see Fig. S5, ESI† file).48
O, which is most likely due to the increase in the concentration of carboxyl groups (see Fig. S5, ESI† file).48
GOQD possess fluorescence properties due to their optoelectronic state. This was clearly visible under UV light in a H2O solution with GOQD concentration of 0.1 mg ml−1. The fluorescence emission was also evaluated with fluorescence spectroscopy showing emission at 450 nm, at the maximum intensity, by an excitation wavelength of 330 nm (close to the first absorption transition in the UV). A small emission peak appeared at the emission of 650 nm, which is not attributed to the fluorescence of GOQD. It is a result of overlap of second order emission associated to the excitation wavelength.49,50
3.4 Preparation of the GOQD from waste papers
Finally, we demonstrated that similar GOQD could be synthesized by utilizing low quality waste paper. The schematic representation of the produced CN and GOQD-30 and their diameters in the single particle regime (dilute regime) are presented in Fig. 12. During the first step, as described above for pure cellulose, the microwave-assisted recycling of the waste paper produced amorphous CN as a result of the polymerization–precipitation reaction of HMF synthesized by dehydration reaction of glucose. The synthesized CN was utilized as a precursor for the preparation of the GOQD-30 via an oxidation reaction in the presence of HNO3 as oxidizing agent. The corresponding FTIR and XRD spectra can be seen in Fig. S6, ESI† file. | ||
| Fig. 12 Reaction route for obtaining GOQD-30 from waste papers: (1) microwave synthesis, H2SO4/H2O, + Δ, and (2) oxidation in HNO3 with 30 min sonication at 45 °C and 30 min heating at 90 °C. | ||
4. Conclusions
Novel value-added graphene oxide quantum dots (GOQD) were synthesized from abundant non-editable biomass, cellulose, as well as from a large volume paper waste product through a facile process. The CN (D = 995 nm) intermediates produced by microwave-assisted hydrothermal degradation of cellulose were oxidized to 2D GOQD under O-rich acidic condition (HNO3) via a simple 2 steps reaction: (1) sonication for disintegration of CN aggregations and (2) heating at 90 °C for the main oxidation–degradation process. It was revealed that the size of final GOQD could be tuned by heating time as 30 and 60 minutes heating produced GOQD with ∼3 and ∼1 nm diameters, respectively. Furthermore, UV/Vis and fluorescence spectroscopy showed optical properties of synthesized GOQD. A novel methodology for easy synthesis of green GOQD with interesting properties from bio- or waste resources was, thus, demonstrated.Acknowledgements
The Swedish Research Council (VR) is acknowledged for financial support (contract grant number 2012-4369).Notes and references
- A. K. Geim and K. S. Novoselov, Nat. Mater., 2007, 6, 183–191 CrossRef CAS PubMed.
- M. Bala Murali Krishna, N. Venkatramaiah, R. Venkatesan and D. Narayana Rao, J. Mater. Chem., 2012, 22, 3059 RSC.
- Y. Zhu, S. Murali, W. Cai, X. Li, J. W. Suk, J. R. Potts and R. S. Ruoff, Adv. Mater., 2010, 22, 3906–3924 CrossRef CAS PubMed.
- A. K. Geim, Science, 2009, 324, 1530–1534 CrossRef CAS PubMed.
- O. M. Istrate, K. R. Paton, U. Khan, A. O'Neill, A. P. Bell and J. N. Coleman, Carbon, 2014, 78, 243–249 CrossRef CAS PubMed.
- W. Chen, S. Qin, X.-A. Zhang, S. Zhang, J. Fang, G. Wang, C. Wang, L. Wang and S. Chang, Carbon, 2014, 77, 1090–1094 CrossRef CAS PubMed.
- W. Shao, H. Liu, X. Liu, S. Wang and R. Zhang, RSC Adv., 2015, 5, 4795–4803 RSC.
- P. G. Luo, S. Sahu, S.-T. Yang, S. K. Sonkar, J. Wang, H. Wang, G. E. LeCroy, L. Cao and Y.-P. Sun, J. Mater. Chem. B, 2013, 1, 2116–2127 RSC.
- M. Sasaki, Z. Fang, Y. Fukushima, T. Adschiri and K. Arai, Ind. Eng. Chem. Res., 2000, 39, 2883–2890 CrossRef CAS.
- J. Luo, L. J. Cote, V. C. Tung, A. T. L. Tan, P. E. Goins, J. Wu and J. Huang, J. Am. Chem. Soc., 2010, 132, 17667–17669 CrossRef CAS PubMed.
- K. P. Loh, Q. Bao, G. Eda and M. Chhowalla, Nat. Chem., 2010, 2, 1015–1024 CrossRef CAS PubMed.
- L. Valentini, M. Cardinali, E. Fortunati, L. Torre and J. M. Kenny, Mater. Lett., 2013, 105, 4–7 CrossRef CAS PubMed.
- M. Azarang, A. Shuhaimi, R. Yousefi and M. Sookhakian, J. Appl. Phys., 2014, 116, 084307 CrossRef PubMed.
- H. Wu, H. Shi, Y. Wang, X. Jia, C. Tang, J. Zhang and S. Yang, Carbon, 2014, 69, 379–389 CrossRef CAS PubMed.
- Z. Wang, P. Huang, A. Bhirde, A. Jin, Y. Ma, G. Niu, N. Neamati and X. Chen, Chem. Commun., 2012, 48, 9768–9770 RSC.
- J. Chen, P. Xiao, J. Gu, Y. Huang, J. Zhang, W. Wang and T. Chen, RSC Adv., 2014, 4, 44480–44485 RSC.
- C. P. Liu, Y. Y. Hui, Z. H. Chen, J. G. Ren, Y. Zhou, L. Tang, Y. B. Tang, J. A. Zapien and S. P. Lau, RSC Adv., 2013, 3, 17918 RSC.
- J. Chen, X. Zhang, X. Zheng, C. Liu, X. Cui and W. Zheng, Mater. Chem. Phys., 2013, 139, 8–11 CrossRef CAS PubMed.
- J. T. Han, J. S. Kim, D. Kwak, B. G. Kim, B. H. Jeong, S. Y. Jeong, H. J. Jeong, K. Cho and G.-W. Lee, RSC Adv., 2011, 1, 44 RSC.
- R. Li, X. Liu, X. Deng, S. Zhang, Q. He and X. Chang, Mater. Lett., 2012, 76, 247–249 CrossRef CAS PubMed.
- S. Sayyar, E. Murray, B. C. Thompson, S. Gambhir, D. L. Officer and G. G. Wallace, Carbon, 2013, 52, 296–304 CrossRef CAS PubMed.
- D. D. Kulkarni, I. Choi, S. S. Singamaneni and V. V. Tsukruk, ACS Nano, 2010, 4, 4667–4676 CrossRef CAS PubMed.
- C. Chung, Y.-K. Kim, D. Shin, S.-R. Ryoo, B. H. Hong and D.-H. Min, Acc. Chem. Res., 2013, 46, 2211–2224 CrossRef CAS PubMed.
- A. Nieto-Marquez, R. Romero, A. Romero and J. L. Valverde, J. Mater. Chem., 2011, 21, 1664–1672 RSC.
- Z. Yang, Q. Yu, W. Dong, X. Gu, W. Qiao and X. Liang, Appl. Math. Model., 2013, 37, 7442–7451 CrossRef PubMed.
- B. Y. Geng, J. Z. Ma, Q. B. Du, X. W. Liu and L. D. Zhang, Mater. Sci. Eng. A, 2007, 466, 96–100 CrossRef PubMed.
- A. M. Herring, J. T. McKinnon, B. D. McCloskey, J. Filley, K. W. Gneshin, R. A. Pavelka, H.-J. Kleebe and D. J. Aldrich, J. Am. Chem. Soc., 2003, 125, 9916–9917 CrossRef CAS PubMed.
- Z. Xu, H. Li, W. Li, G. Cao, Q. Zhang, K. Li, Q. Fu and J. Wang, Chem. Commun., 2011, 47, 1166–1168 RSC.
- S. P. Chundawat, G. Bellesia, N. Uppugundla, L. da Costa Sousa, D. Gao, A. M. Cheh, U. P. Agarwal, C. M. Bianchetti, G. N. Phillips Jr, P. Langan, V. Balan, S. Gnanakaran and B. E. Dale, J. Am. Chem. Soc., 2011, 133, 11163–11174 CrossRef CAS PubMed.
- S. Hassanzadeh, N. Aminlashgari and M. Hakkarainen, Carbohydr. Polym., 2014, 112, 448–457 CrossRef CAS PubMed.
- S. Hassanzadeh, N. Aminlashgari and M. Hakkarainen, ACS Sustainable Chem. Eng., 2015, 3, 177–185 CrossRef CAS.
- D. Wu and M. Hakkarainen, ACS Sustainable Chem. Eng., 2014, 2, 2172–2181 CrossRef CAS.
- L. Segal, J. J. Creely, A. E. Martin and C. M. Conrad, Text. Res. J., 1959, 29, 786–794 CrossRef CAS PubMed.
- T. Yamada, M. Aratani, S. Kubo and H. Ono, J. Wood Sci., 2007, 53, 487–493 CrossRef CAS.
- D. S. Sutar, P. K. Narayanam, G. Singh, V. D. Botcha, S. S. Talwar, R. S. Srinivasa and S. S. Major, Thin Solid Films, 2012, 520, 5991–5996 CrossRef CAS PubMed.
- J. Shang, L. Ma, J. Li, W. Ai, T. Yu and G. G. Gurzadyan, Sci. Rep., 2012, 2, 792 Search PubMed.
- Y. Mi, W. Hu, Y. Dan and Y. Liu, Mater. Lett., 2008, 62, 1194–1196 CrossRef CAS PubMed.
- K. Morishige, J. Phys. Chem. C, 2013, 117, 10360–10365 CAS.
- N. Tsubokawa, M. Tsuchida, J. Chen and Y. Nakazawa, Sens. Actuators, B, 2001, 79, 92–97 CrossRef CAS.
- R. K. Gupta, Z. A. Alahmed and F. Yakuphanoglu, Mater. Lett., 2013, 112, 75–77 CrossRef CAS PubMed.
- P. Song, X. Zhang, M. Sun, X. Cui and Y. Lin, R. Soc. Chem. Adv., 2012, 2, 1168 CAS.
- X. Shen, X. Lin, N. Yousefi, J. Jia and J.-K. Kim, Carbon, 2014, 66, 84–92 CrossRef CAS PubMed.
- K. Toda, R. Furue and S. Hayami, Anal. Chim. Acta, 2015 DOI:10.1016/j.aca.2015.02.002.
- P. G. Ren, D. X. Yan, X. Ji, T. Chen and Z. M. Li, Nanotechnology, 2011, 22, 055705 CrossRef PubMed.
- G. Venugopal, K. Krishnamoorthy and S.-J. Kim, Appl. Surf. Sci., 2013, 280, 903–908 CrossRef CAS PubMed.
- S. Stankovich, D. A. Dikin, R. D. Piner, K. A. Kohlhaas, A. Kleinhammes, Y. Jia, Y. Wu, S. T. Nguyen and R. S. Ruoff, Carbon, 2007, 45, 1558–1565 CrossRef CAS PubMed.
- Y. Liu, C.-y. Liu and Y. Liu, Appl. Surf. Sci., 2011, 257, 5513–5518 CrossRef CAS PubMed.
- G. Eda, Y.-Y. Lin, C. Mattevi, H. Yamaguchi, H.-A. Chen, I. S. Chen, C.-W. Chen and M. Chhowalla, Adv. Mater., 2010, 22, 505–509 CrossRef CAS PubMed.
- K. Krishnamoorthy, R. Mohan and S. J. Kim, Appl. Phys. Lett., 2011, 98, 244101 CrossRef PubMed.
- S. Shukla and S. Saxena, Appl. Phys. Lett., 2011, 98, 073104 CrossRef PubMed.
Footnote |
| † Electronic supplementary information (ESI) available: FTIR, AFM, TGA XRD and fluorescence studies. See DOI: 10.1039/c5ra01805f |
| This journal is © The Royal Society of Chemistry 2015 |

