DOI:
10.1039/C5RA01192B
(Paper)
RSC Adv., 2015,
5, 37066-37077
Removal of Pb(II) from aqueous solution by mesoporous silica MCM-41 modified by ZnCl2: kinetics, thermodynamics, and isotherms†
Received
20th January 2015
, Accepted 17th April 2015
First published on 17th April 2015
Abstract
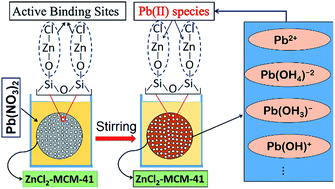
A new hybrid nanostructured sorbent ZnCl2-MCM-41, was synthesized by a post-synthesis method in toluene as the solvent. To characterize the sorbent, a number of methods were applied, including X-ray diffraction (XRD), nitrogen adsorption–desorption isotherm, Fourier transform infrared spectroscopy (FT-IR), transmission electron microscopy (TEM), and scanning electron microscopy (SEM). Characterization demonstrated that the sorbent particles are of semi-spherical shape, nanostructured with a 754 m2 g−1 surface area and a 2.86 nm pore diameter. The Pb(II) removal depended on several parameters, including the pH of solution, temperature, initial Pb(II) concentration, sorbent dosage, ionic strength, and the amount of ZnCl2 loaded on the MCM-41 surface. The results showed that the pseudo-second-order model describes the kinetics of sorption better than the pseudo-first-order model. The adsorption continuously increased in the pH range of 2.0–7.0, beyond which the adsorption could not be carried out due to the precipitation of the metal ions. The adsorbent had a considerably high Langmuir monolayer capacity of 479 mg g−1. The adsorption process was exothermic at ambient temperature and the computation of the parameters ΔG°, ΔH°, and ΔS° indicated the interactions to be thermodynamically favorable.
1. Introduction
Heavy metals are toxic, non-biodegradable, and have a tendency to accumulate in living organisms, causing a number of health problems including various diseases and disorders. Different methods have been developed to remove toxic heavy metals from wastewater – namely, chemical oxidation/reduction, precipitation, ion exchange, electrochemical processes, membrane filtration, and reverse osmosis.1 These methods are, in general, expensive and potentially risky due to the possibility of generating hazardous by-products, so such methods are not suitable for small-scale industries.2,3 However, another approach – adsorption – is widely used for metal ion removal because it is simple to operate, cost effective, and has an efficient removal capacity.4–6 Different adsorbents such as carbon nanotubes,7 mesoporous silica (SBA-15),8 biomass,9 and zeolite10 have been used for the adsorption of Pb(II) from aqueous solutions. Additionally, mesoporous silica materials have received considerable attention because of their exceptionally large surface area and well-defined pore size and pore shape.11,12 MCM-41, the adsorbent studied in this research, is one type of mesoporous silica, and has hexagonal arrays of large and uniform pore size, a large surface area, high thermal stability, and mild acidic properties.13,14 In the previous study,5 MCM-41 materials were modified by ZnCl2 particles in order to remove Hg(II) species from aqueous solutions. This study showed that the adsorption capacity of the ZnCl2-MCM-41 sorbent for Hg(II) removal from aqueous solutions was sufficiently high (204.1 mg g−1) for justifying future research. In addition, Boudrahem et al.15 observed that ZnCl2-activated carbon is an effective adsorbent for the removal of Pb ions from aqueous solutions. However, to the extent of our knowledge, the ability of ZnCl2-MCM-41 to remove Pb(II) from aqueous solutions has not been investigated previously.
The main purpose of this study was to modify synthesized MCM-41 with ZnCl2 and apply the modified MCM-41 for the removal of Pb(II) from aqueous solutions. The synthesized ZnCl2-MCM-41 adsorbent was then characterized using FT-IR, N2 adsorption–desorption, XRD, TEM, and SEM techniques. Furthermore, the influences of several operating parameters – such as pH, ionic strength, contact time, and temperature – on the sorption capacity of ZnCl2-MCM-41 were investigated, and the obtained results are reported. Pseudo-first-order, pseudo-second-order, Elovich, and intra-particle kinetic models were used to identify the possible mechanisms of the sorption process, and different isotherm models were used to analyze the sorption equilibrium. Thermodynamic parameters were calculated to determine the nature of the sorption process (i.e., chemisorption or physisorption). Moreover, the desorption of Pb(II) ions from the adsorbent was studied to understand the feasibility of recovering the sorbent and Pb(II) species. Finally, an industrial wastewater sample from a battery production factory was used to study the heavy metal sorption capability of ZnCl2-MCM-41 sorbent.
The method of least squares is the most widely used technique for predicting the optimum isotherm, and the non-linear regression method is currently the best known way to select the optimum isotherm for experimental data. This non-linear regression method involves the step of minimizing the error distribution between the experimental data and the predicted isotherm: the error distribution between the experimental equilibrium data and the predicted isotherms will be minimized either by minimizing the error function or by maximizing it based on the definition of the error function. In this study, all model parameters were evaluated by nonlinear regression. The optimization procedure was done by seven error functions to measure the goodness of fit, with smaller error function values indicating a better-fitting curve. The non-linear error functions employed in this study are presented in Table S1 (ESI† file). After computing these error functions for each model and calculating the sum of normalized errors (SNE), the optimum isotherm was recognized as the isotherm with the smallest SNE. The calculation method for SNE is presented in the ESI† file.
2. Materials and methods
2.1. Chemicals
Cetyltrimethylammonium bromide (CTAB), tetraethylorthosilicate (TEOS), lead nitrate (Pb(NO3)2), ethanol, toluene absolute, zinc chloride (ZnCl2), sodium hydroxide (NaOH), and hydrochloric acid (HCl) were all supplied by Merck and used without further purification. Aqueous ammonia (25% NH3) was supplied by Fluka.
2.2. Synthesis of the MCM-41
2.5 g of CTAB was dissolved in 50 g of deionized water. To this surfactant solution, 16.8 g of an ammonia solution (25 wt% in water) and 60 g of ethanol were added. The solution was stirred for 15 min (300 rpm) and then 4.7 g of TEOS were added drop wise. The resulting synthesis gel, with a molar composition of TEOS
:
CTAB
:
NH3
:
H2O
:
EtOH = 1
:
0.3
:
11
:
144
:
58, was stirred for an additional 2 h at room temperature. The solid product was obtained by filtration, washed with deionized water and ethanol, dried in an oven at 353 K, calcined at 823 K for 8 h with the heating rate of 1 °C min−1, and kept at this temperature for 4 h to remove the CTAB. The outcome of this method is the unmodified version of MCM-41 (throughout this manuscript MCM-41 refers to the calcined MCM-41).
2.3. Synthesis of ZnCl2-MCM-41
The ZnCl2-MCM-41 adsorbent was synthesized by post-synthesis method according to Liu et al.16 In brief, 1.0 g of the calcined MCM-41 was added to a flask containing 50 mL of dried toluene and a specific amount of anhydrous ZnCl2. To find the maximum adsorption capacity of ZnCl2-MCM-41 adsorbent for the Pb(II) species, different amounts of ZnCl2 (0.1–1.0 g) were added to the above-mentioned solution. The mixture was stirred at 35 °C for 6 h (300 rpm). The obtained solid was filtered off, washed completely with dry toluene, and dried at 100 °C for 36 h. Dried powders were washed with 100 mL deionized water to dissolve and remove unreacted Zn2+ from mesoporous silica bulk and the filtered solution was analyzed by atomic absorption spectrophotometry (AAS) technique in order to determine the amount of ZnCl2 loaded on MCM-41. The structure of ZnCl2-MCM-41 is shown in Fig. 1.
 |
| Fig. 1 Schematic structure of MCM-41 and ZnCl2-MCM-41. | |
2.4. Preparation of lead solutions
A stock solution of 1.0 M Pb(II) was prepared by dissolving 33.12 g Pb(NO3)2 in 100 mL deionized water. Other concentrations, varying between 2 and 200 mg L−1, were also prepared from stock solution. The pH of the working solutions was adjusted to the desired values with 0.1 M HNO3 or 0.1 M NaOH. Fresh dilutions were used for each experiment.
2.5. Batch adsorption studies
Batch experiments of the Pb(II) adsorption were conducted by placing 10 mg hybrid ZnCl2-MCM-41 sorbent in a series of Erlenmeyer flasks containing 30 mL of the Pb(II) at the specific initial concentrations and pH. Then the contents of the flasks were magnetically stirred for a specific time at the rate of 300 rpm, with a controlled temperature during adsorption process. The residual concentration of the Pb(II) in the solution was determined by the use of an atomic absorption emission spectrophotometer (Shimadzu AA-670). The amount of Pb(II) sorbed per gram of ZnCl2-MCM-41 was calculated according to eqn (1): |
 | (1) |
where qe is the equilibrium Pb(II) concentration on the adsorbent (mg g−1); Ce and C0 are the equilibrium and initial lead(II) concentrations in the solution, respectively (mg L−1); V is the volume of the solution (L); and m is the mass of dry sorbent used (g). The variables that were investigated for possible effects on adsorption were pH (2–7), contact time (1–60 min), initial ion concentration (2–200 mg L−1), and temperature (20, 30, 40, and 50 °C). All samples were filtered through Whatman no. 42 filter paper and then analyzed with an atomic absorption spectrophotometer.
The metal removal percentage from aqueous solution is calculated using the following equation:
|
 | (2) |
2.6. Characterization of samples
2.6.1. XRD. X-ray powder diffraction patterns were recorded in the 2θ range of 1.5 to 10 deg. at 0.02 deg. steps and 0.4 [s] scan step time on a Philips Analytical X-ray B.V. diffractometer equipped with a Cu-anode (λ = 1.54056 Å).
2.6.2. Nitrogen adsorption. N2 adsorption isotherms were measured at 77 K on a Micrometrics ASAP 2010 analyzer using standard, continuous procedures. Prior to measurement, all samples were degassed at 573 K for 5 h. The measurements were carried out over relative pressures ranging from ca. 10−3 to 0.995. Surface areas and pore size distribution were determined by Brunauer–Emmett–Teller (BET) and Barrett–Joyner–Halenda (BJH) methods, respectively.17
2.6.3. FT-IR spectroscopy. FT-IR spectra for the produced materials were recorded using a Shimadzu 4300 FT-IR spectrophotometer and a standard KBr technique in the region of 4000–400 cm−1.
2.6.4. TEM and SEM. Transmission electron microscopy (Leo 912 AB, Germany) was used to examine the pore array structure of the ZnCl2-MCM-41 sorbent. Scanning electron microscopy (KYKY-EM3200 Digital Scanning Electron Microscope) was used to determine the particle morphology and the particle size distribution of the synthesized materials.
3. Results and discussion
3.1. Adsorbent characterization
3.1.1. XRD pattern. XRD patterns of mesoporous MCM-41 and ZnCl2-MCM-41 are shown in Fig. 2. There are four MCM-41 characteristic peaks at 2.32, 4.05, 4.69, and 6.20 degrees, which could be assigned to (1 0 0), (1 1 0), (2 0 0), and (2 1 0) planes, respectively. These peaks are in good agreement with the XRD patterns obtained by Savidha and Pandurangan.18 Therefore, it could be inferred that the synthesis procedure of MCM-41 in this work has been done well and the crystalline structure is as expected. The diffraction pattern of the MCM-41 indicated the possession of an ordered structure of hexagonal pore arrays. After ZnCl2 particles were dispersed into MCM-41, none of the peaks was disappeared. Nevertheless, peak intensities of all planes of the support decreased. Moreover, a slight shift was occurred in the location of the peaks as 2.34, 4.09, 4.71, and 6.28 degrees, which are related to (1 0 0), (1 1 0), (2 0 0), and (2 1 0) planes, respectively. The decrease in peak intensities after incorporation may be explained by reasoning that either: a part of the pore structure is blocked with ZnCl2;19 or pore filling reduces the scattering contrast between the pores and walls of mesoporous silica resulting from the formation of “–O–Zn–Cl” sites inside the MCM-41 pores.20 The low intensity and peak broadening observed in the XRD pattern of ZnCl2-MCM-41 indicate that these materials are not as well ordered as MCM-41; i.e., the hexagonal array of their channels is not quite regular. It should be mentioned that no peaks were observed in the XRD pattern of ZnCl2-MCM-41 from 10 to 80 degrees, showing that all reactants were either used completely or washed off the surface and hence no unreacted ZnCl2 left in the obtained sorbent.5
 |
| Fig. 2 The X-ray diffraction patterns of MCM-41 and ZnCl2-MCM-41. | |
3.1.2. N2 adsorption–desorption isotherm. The nitrogen adsorption–desorption isotherms of MCM-41 and ZnCl2-MCM-41 samples are shown in Fig. 3a and b. The isotherms of MCM-41 and ZnCl2-MCM-41 corresponded to type IV based on the IUPAC classification scheme, which is characteristic of MCM-41 materials. The adsorption at low relative pressure (P/P0 < 0.2) increased considerably due to monolayer adsorption on the external surface. The lower adsorption volume on ZnCl2-MCM-41 indicated lower surface area. The N2 adsorption increased again before reaching a nearly constant volume in the relative pressure range of 0.2–0.4, which corresponded to nitrogen adsorption in the mesopores. As indicated in Fig. 3b, the adsorption on the surface of ZnCl2-MCM-41 decreased in this range, indicating the partial blocking of mesopores by the ZnCl2 particles. The general and the main feature of adsorption isotherms on MCM-41 is a characteristic step associated with the capillary condensation in pores. It has been shown that, depending on adsorbate, pore size, and temperature, the capillary condensation desorption in MCM-41 may occur both with and without a hysteresis loop.5 For both cases, a hysteresis loop occurred in the mesopores. The specific surface areas and pore diameters of both samples are shown in Table 1. The decrease in the surface area of ZnCl2-MCM-41 indicated that ZnCl2 particles reduced the pore volume of MCM-41. This may be attributed to the dispersion of ZnCl2 onto the walls of mesoporous support. In addition, the pore diameters of ZnCl2-MCM-41 calculated from the BJH equation were in the range of 25–35 Å (figure not presented). This implies that, after ZnCl2 incorporating into MCM-41 pores, the ZnCl2-MCM-41 pores are still mesoporous. The long plateau at higher relative pressures indicates that there was a slight pore filling after P/P0 > 0.40. Textural characteristics of prepared adsorbents were obtained from isotherms using BET and BJH methods, and the results are depicted in Table 1. The specific surface area of MCM-41 was decreased from 1169 to 754 m2 g−1 by ZnCl2 incorporation. After ZnCl2 loading, a decrease in the Vp and BJH average pore diameter was observed that can be interpreted due to the fact that the ZnCl2 particles were dispersed onto the MCM-41 mesopores channels.
 |
| Fig. 3 N2 adsorption–desorption isotherm of (a) MCM-41 and (b) ZnCl2-MCM-41. | |
Table 1 Physicochemical properties of calcined and ZnCl2-loaded MCM-41
Samples |
SBET (m2 g−1) |
Vp (cm3 g−1) |
dBJH (nm) |
davg (nm) |
MCM-41 |
1169 |
0.97 |
3.25 |
3.55 |
ZnCl2-MCM-41 |
754 |
0.58 |
2.86 |
3.15 |
3.1.3. FT-IR analysis. FT-IR patterns of mesoporous silica materials between 4000 and 400 cm−1 are shown in Fig. 4. Generally, the main feature of the mesoporous silica sample spectra is a large, broad band between 3200 and 3500 cm−1, which is attributed both to –OH bond stretching of the surface silanol groups, and to the remaining adsorbed water molecules. The broad absorption band at around 1030–1240 cm−1 is assigned to the Si–O–Si stretching. The spectrum for the uncalcined MCM-41 (Fig. 4a) shows a group of strong, intense bands at 3396, 2923, 2852, 1639, and 1479 cm−1 and a group of bands in the region below 1400 cm−1. The bands at 3396 and 1639 cm−1 are related to the stretching and bending modes of adsorbed water molecules, while the bands at 2923 and 2854 cm−1 are attributed to the stretching mode of νCH(–CH3) and νCH(–CH2–) groups, respectively. The band at 1479 cm−1 is assignable to the bending mode of δCH(–CH3) and δCH(–CH2–) groups. The group of bands observed below 1400 cm−1 is related to the framework vibration of MCM-41. For the calcined MCM-41 as shown in Fig. 4b, the band at 2923, 2852 and 1479 cm−1 were disappeared, showing that the CTAB template has been removed completely after calcination. The band at 1058 cm−1 is assigned to νas(Si–O–Si); the band at 968 cm−1 is assigned to νas(Si–OH); the band at 796 cm−1 is assigned to νs(Si–O–Si); and the band at 459 cm−1 is assigned to δ(Si–O–Si). The band at 1634 cm−1 and the broad absorption band centered at 3441 cm−1 are attributed to hydrogen-bonded Si–OH groups perturbed by physically adsorbed water.21 For ZnCl2-MCM-41 (Fig. 4c), the absorption intensity of 3565, 1735, 1614, and 802 cm−1 bands increased and shifted toward greater wave numbers, which could be considered as evidence for the incorporation of ZnCl2 in the MCM-41 pores. Moreover, there was a change in the intensity and broadening of the 965 cm−1 band, which indicates a structural change for the surface Si–OH group due to the presence of ZnCl2 species in the MCM-41 material, and might be due to the formation of a new vibration band, νas(Si–O–Zn).5
 |
| Fig. 4 The FT-IR spectra of (a) uncalcined-MCM-41, (b) calcined MCM-41, and (c) ZnCl2-MCM-41. | |
3.1.4. TEM images. The TEM image of ZnCl2-MCM-41 is displayed in Fig. 5. The determined-field image at high magnification of the ZnCl2-MCM-41 particles shows a mesostructure with a well-defined hexagonal arrangement of uniform pores. The pore size was estimated to be ∼2.7 nm, which is in good agreement with the average pore sizes calculated by the BJH model from N2 adsorption data. The micrograph confirmed the highly ordered hexagonal arrays and one-dimensional mesoporous parallel channels.
 |
| Fig. 5 The TEM image of ZnCl2-MCM-41. | |
3.1.5. SEM micrograph. The representative SEM image of the ZnCl2-MCM-41 is displayed in Fig. 6. From this, it is clear that all of the ZnCl2-MCM-41 particles have an ovoid morphology without any agglomeration.
 |
| Fig. 6 The SEM micrographs for the ZnCl2-MCM-41. | |
3.2. Adsorption of Pb(II) species
3.2.1. Effect of ZnCl2 loading. In order to obtain the maximum adsorption capacity of Pb(II) species by ZnCl2-MCM-41 sorbent, different amounts of ZnCl2 (0–7 mmol) were incorporated into 1 g of calcined MCM-41. These samples were used for Pb(II) removal while other operating parameters were kept constant. As shown in Fig. 7, the optimum adsorption was attained when 4 mmol ZnCl2 was employed for loading onto 1 g of MCM-41. Hence, the rest of the experiments were carried out with the 4 mmol g−1 ZnCl2-modified MCM-41 sorbent samples. It is worth mentioning that the Pb(II) removal efficiency of the pure MCM-41 was only about 17%, while the modified MCM-41 could remove almost 97% percent of the Pb(II) ions. This significant increase in the Pb(II) removal efficiency of the modified sorbent is attributed to the formation of O–Zn–Cl binding sites by incorporating ZnCl2 into MCM-41 structure.
 |
| Fig. 7 Pb(II) removal efficiency of ZnCl2-MCM-41 as a function of ZnCl2 loading (C0 = 20 mg L−1, T = 20 °C, pH = 7, sorbent dosage = 0.333 g L−1, 60 min, 300 rpm). | |
3.2.2. Effects of contact time and initial concentration. The sorption data for the uptake of Pb(II) versus contact time at different initial concentrations ranging from 2 to 200 mg L−1 are displayed in Fig. 8. It can be observed that the sorption capacity increased with time and then reached a constant value where no more metal was removed from the solution. At this point, the amount of Pb(II) being sorbed by the sorbent was in a state of dynamic equilibrium with the amount of Pb(II) desorbed from the sorbent. The required contact time for Pb solutions with initial concentrations of 2 to 200 mg L−1 to reach equilibrium was approximately 30 min. Therefore, it can be deduced that the equilibrium time was virtually independent of initial lead concentration. This is because the large pores of the sorbent allow lead species to move through the pores easily and readily access the active binding sites of the sorbent. It was observed that the Pb(II) removal varied with variations in the initial metal concentration. The removal of lead was found to be dependent on the initial concentration; the adsorbed amount increased with increases in the initial concentration. In addition, the adsorption was fast in the early stages, and then attained an asymptotic value for longer contact times. The initial rate of sorption was greater due to higher initial lead concentration; in other words, the resistance to the metal uptake decreased as the mass transfer driving force increased. Equilibrium uptake increased with the increase of initial metal concentration at the range of experimental concentration. This is due to the increase in the driving force – i.e., the concentration gradient. It is also noticed that an increase in the initial lead concentration led to a decrease in the metal removal percentage. This effect can be explained as follows: at low metal/sorbent ratios, there are a number of sorption sites in ZnCl2-MCM-41 structure, but as the metal/sorbent ratio increases, sorption sites become saturated, resulting in decreases in the sorption efficiency.
 |
| Fig. 8 Effect of contact time and initial concentration on the adsorption of Pb(II) onto ZnCl2-MCM-41 (T = 20 °C, pH = 7, sorbent dosage = 0.333 g L−1, 300 rpm). | |
3.2.3. Effect of temperature. Fig. 9 shows the amount of lead sorbed versus time at different temperatures. Experimental results showed that the adsorption of Pb(II) ions onto ZnCl2-MCM-41 was significantly dependent on the temperature until the contact time of 30 min. The adsorption of Pb(II) onto ZnCl2-MCM-41 at different temperatures showed a decrease in the adsorption capacity with an increase in temperature. As temperature increased from 20 to 50 °C for the equilibrium time, 30 min, the sorption amount decreased from 58.08 to 54.18 mg g−1 for Pb(II). These results indicated the exothermic nature of Pb(II) sorption onto ZnCl2-MCM-41 pores. The decrease in the sorption of Pb(II) ions resulting from an increase in temperature may be due to an increasing tendency to desorb metal ions from the interface to the solution. Aksu and Kutsal22 have commented that the thickness of the boundary layer decreases at relatively high temperatures, due to the increased tendency of the metal ion to escape from the adsorbent surface to the solution phase, which results in a decrease in adsorption.
 |
| Fig. 9 Effect of contact time and temperature on the sorption of Pb(II) onto ZnCl2-MCM-41 (C0 = 20 mg L−1; pH = 7; sorbent dosage = 0.333 g L−1; 300 rpm). | |
As it is evident from Fig. 9, the maximum adsorption capacity is achieved at 20 °C. Therefore, the optimum temperature was selected as 20 °C for further sorption experiments.
3.2.4. Effect of pH. The pH parameter has been identified as one of the most influential parameters on metal sorption, and it strongly influences hydrolysis, complexation by organic and/or inorganic ligands, redox reactions, and precipitation, as well as the speciation and adsorption availability of heavy metals.23 Additionally, pH is directly related to hydrogen ions' ability to compete with metal ions to occupy active sites on the sorbent surface.24 Several experiments were performed to optimize the pH of the solution for maximum Pb(II) adsorption by ZnCl2-MCM-41. The initial solution pH was varied at the range of 2–7 in order to avoid precipitation of lead in the form of metal hydroxides and hydrolytic action from metal ions,25 and as pH increased from 2 to 7, the removal of Pb(II) increased from 72.46 to 97.24% (Fig. 10). Lead speciation is great concern in the studies associated with the effect of initial pH of solution. It is known that lead species are present in the forms of Pb2+, Pb(OH)+, Pb(OH)02, Pb(OH)3−, and Pb(OH)42− at different pH values (Fig. S1†).26 Fig. S1† shows that the predominant speciation of lead ions at pH values higher than 7 is Pb(OH)2 and therefore in that pH range precipitation occurs. In order to prevent lead precipitation, the pH range of 2–7 was selected for this study. According to the well-known speciation of lead in aqueous solutions, the predominant ionic form at pH < 6 is Pb2+. However, at low pH levels, the large amount of H+ ions could compete with the Pb2+ ions for the binding sites, resulting in low Pb(II) adsorption.
 |
| Fig. 10 The effect of pH on the adsorption of Pb(II) ions onto ZnCl2-MCM-41 (C0 = 20 mg L−1; T = 20 °C; sorbent dosage = 0.333 g L−1; 300 rpm). | |
By increasing the pH, the effect of H+ competition was decreased, which made the binding sites more accessible to Pb(II) ions. In addition, increasing the pH caused the negative charges on the surface of the adsorbent to increase due to deprotonation of active binding sites. Hence, the electrostatic attraction between ZnCl2-MCM-41 and Pb(II) was enhanced, further increasing the amount of Pb(II) adsorption. At pH 7–10, the main species of lead are Pb(OH)+ and Pb(OH)02, and thus the removal of lead is possibly accomplished by the simultaneous precipitation of Pb(OH)02 and sorption of Pb(OH)+. Consequently, this condition is often not desirable. Nevertheless, almost 97 percent of lead ions are adsorbed on ZnCl2-MCM-41 at pH 7, and thereby it is impossible to form precipitation because of the very low concentration of remaining lead in the solution. Therefore, pH 7 was selected as the optimum condition for the sorption of Pb(II) on ZnCl2-MCM-41. At pH values greater than 10, the predominant lead species are Pb(OH)02 and Pb(OH)3−, which are difficult to adsorb on the negatively charged surface of the adsorbent.27 (effect of pH on Pb(II) sorption at C0 = 50 mg L−1 has been presented in Fig. S2†).
3.2.5. Effect of sorbent dosage. The sorption capacity (mg g−1) and sorption efficiency (%) of ZnCl2-MCM-41 for Pb(II) ions as a function of sorbent dosage was investigated (Fig. 11). The percentage of the sorption increased from 96.7% to 99.9% as the sorbent concentration was increased from 0.01 to 0.05 g (30 mL)−1 solution. This is because of the availability of more binding sites, resulting in greater access to the sorption sites for Pb(II) ions. Further increases in the sorbent concentration did not cause significant improvement in sorption capacity. This may be due to the binding of almost all ions to the sorbent, as well as the establishment of equilibrium between the ions bound to the sorbent and those remaining unsorbed in the solution. The maximum sorption was found to be 99.9% at a ZnCl2-MCM-41 concentration of 0.05 g (30 mL)−1 solution. On the other hand, the adsorption capacity of Pb(II) on ZnCl2-MCM-41 decreased gradually with the increase of sorbent dosage. At low adsorbent content, all kinds of surface sites are entirely exposed for adsorption and the surface reaches saturation faster, resulting in a higher adsorption capacity. However, at higher sorbent concentrations the availability of higher energy sites decreases as a larger fraction of lower energy sites is occupied, leading to a lower adsorption capacity.28 Since the lead removal percentage did not change drastically by increasing the sorbent dosage, while the adsorption capacity diminished tremendously, 0.01 g (30 mL)−1 was selected as the optimum sorbent dosage for the rest of the experiments.
 |
| Fig. 11 Adsorption of Pb(II) on ZnCl2-MCM-41 as a function of sorbent dosage (C0 = 20 mg L−1, T = 20 °C, pH = 7, 60 min, 300 rpm). | |
3.2.6. Influence of ionic strength. The influence of ionic strength on the adsorption of Pb(II) onto ZnCl2-MCM-41 is shown in Fig. 12. As can be seen, the adsorption of Pb(II) onto ZnCl2-MCM-41 was clearly affected by ionic strength. The adsorption decreased steeply with increasing NaNO3 concentration, which suggests that sodium ions greatly affected Pb(II) adsorption. With increasing Na+ concentration in the solution, competition between Pb(II) and Na+ for adsorption on the ZnCl2-MCM-41 surface increases, and thereby the adsorption of Pb(II) on ZnCl2-MCM-41 decreases. Furthermore, the Na+ in solution may influence the double layer thickness and interface potential, and thereby affect the binding of the adsorbed species. Ion exchange and outer-sphere complexes are affected by the variations of ionic strength more easily than are inner sphere complexes, since the background electrolyte ions are placed in the same plane as outer-sphere complexes.
 |
| Fig. 12 Influence of ionic strength on the adsorption of Pb(II) onto ZnCl2-MCM-41 (C0 = 20 mg L−1, T = 20 °C, pH = 7, sorbent dosage = 0.333 g L−1, 60 min, 300 rpm). | |
3.3. Adsorption kinetics
To evaluate the adsorption kinetics of Pb(II) ions, four different kinetic models were applied to the experimental data: (1) the pseudo-first order model, (2) the pseudo-second order model, (3) the Elovich model, and (4) the intra-particle diffusion model. Table 2 shows the equations associated with these models. The parameters of the models were calculated by linear and non-linear (using Excel Add-in Solver) regression methods separately. In this study, the coefficient of determination (R2) was used to find the best-fitting kinetic and isotherm models for the experimental data: |
 | (3) |
where qm is the equilibrium capacity obtained from the model, qe is the equilibrium capacity obtained from experimental data, and
e is the average of qe.
Table 2 Equations of the kinetic models
Model |
Equation |
Ref. |
Pseudo-first order |
ln(qe − qt) = ln qe − k1t |
30 |
Pseudo-second order |
 |
31 |
Elovich |
 |
32 |
Intra-particle diffusion |
qt = kidt1/2 + ci |
33 |
All kinetic parameters and correlation coefficients are listed in Table 3. As can be seen, the pseudo-second order model had the highest R2 value at all Pb(II) initial concentrations in both linear and non-linear regression methods. This model assumes that the rate limiting step in the adsorption of Pb(II) species is chemisorption, involving valence forces through the sharing or exchange of electrons between lead ions and active binding sites on the sorbent surface. For all kinetic models, the results obtained from linear regression differ from the results from non-linear regression, especially for the pseudo first-order model. This difference shows that linearization changed the error structure of models and verifies that it is inappropriate to use the coefficient of determination of a linear regression analysis for comparing the best-fitting solution of different isotherms. Detailed explanations about linear and non-linear regression are presented in our previous study.29 For all models, the calculated qe values are not completely consistent with the experimental data. The R2 value of intra-particle diffusion was less than the R2 values in other models, which verifies that the diffusion through the sorbent pores is not the rate-limiting step. In fact, the uniform, regular, and large pores of ZnCl2-MCM-41 allow lead ions to move easily through the pores to access the binding sites without any diffusivity barrier. The Elovich equation does not provide any mechanistic evidence in this study, although previous work has proved that it is suitable for highly heterogeneous systems.29 Consequently, the inability of the Elovich equation to describe the Pb(II) sorption process of the ZnCl2-MCM-41 sorbent confirms that the sorption system of this study is homogeneous. A comparison of the different kinetic models for the adsorption of Pb(II) onto ZnCl2-MCM-41 at different initial concentrations is illustrated in Fig. 13.
Table 3 Parameters of the kinetic models for Pb(II) adsorption onto ZnCl2-MCM-41 (C0 = 50, 100, and 200 mg L−1, T = 20 °C, pH = 7, sorbent dosage = 0.333 g L−1, 300 rpm)
Kinetic model |
Model parameters |
Linear regression |
Non-linear regression |
50 |
100 |
200 |
50 |
100 |
200 |
Pseudo-first order |
qe,meas (mg g−1) |
145.8 |
287.1 |
552.4 |
145.8 |
287.1 |
552.4 |
qe,model (mg g−1) |
35.3 |
74.6 |
110.8 |
144.3 |
284.4 |
548.6 |
k1 (min−1) |
0.186 |
0.223 |
0.244 |
0.791 |
0.743 |
0.929 |
R2 |
0.9858 |
0.9927 |
0.9875 |
0.8909 |
0.9509 |
0.9255 |
Pseudo-second order |
qe,meas (mg g−1) |
145.8 |
287.1 |
552.4 |
145.8 |
287.1 |
552.4 |
qe,model (mg g−1) |
149.2 |
294.1 |
555.6 |
148.1 |
294.5 |
561.3 |
k2 (g mg−1 min−1) |
0.013 |
0.007 |
0.005 |
0.013 |
0.0057 |
0.0047 |
R2 |
0.9999 |
0.9999 |
0.9999 |
0.9986 |
0.9880 |
0.9916 |
Elovich |
a × 10−8 (g mg−1 min−1) |
0.011 |
0.047 |
2.14 |
0.011 |
0.022 |
0.785 |
b (mg g−1) |
0.101 |
0.045 |
0.034 |
0.101 |
0.042 |
0.032 |
R2 |
0.9207 |
0.8549 |
0.8591 |
0.9036 |
0.8481 |
0.8499 |
Intra-particle diffusion |
kid (mg g−1 min−1/2) |
6.06 |
13.2 |
17.5 |
6.5 |
15.9 |
21.1 |
ci (mg g−1) |
116.6 |
224.7 |
469.9 |
114.1 |
212.6 |
453.9 |
R2 |
0.7921 |
0.7092 |
0.7071 |
0.7933 |
0.7369 |
0.7381 |
 |
| Fig. 13 Comparison of different kinetic models for Pb(II) adsorption onto ZnCl2-MCM-41 at three different initial concentrations (a) C0 = 50 mg L−1, (b) C0 = 100 mg L−1, and (c) 200 mg L−1 (T = 20 °C, pH = 7, sorbent dosage = 0.333 g L−1, 300 rpm). | |
3.4. Adsorption isotherm
Three isotherms, namely the Langmuir, Freundlich, and Redlich–Peterson (R–P) models, were fitted to the experimental data to find out more details about the process. These details include maximum theoretical adsorption capacity, process mechanism, physisorption or chemisorption, and monolayer or multilayer adsorption, to name a few. To make a comparison, the isotherm parameters were calculated by linear and nonlinear regression methods. All isotherm equations and their linearized forms are presented in Table S2.†
3.4.1. Linear regression. Linear regression using the method of least squares is the most commonly-used method in determining isotherm parameters. The best-fit isotherm was selected based on the coefficient of determination that produced the minimum error distribution between the predicted and experimental isotherms. The Freundlich, Langmuir, and Redlich–Peterson constants can be obtained from the slope and intercept of the plots between ln(qe) versus ln(Ce), Ce/qe versus Ce, and ln(ACe/qe − 1) versus ln(Ce), respectively. In the case of the Redlich–Peterson isotherm, the constant A was obtained by maximizing the R2 value using a trial and error method in the solver add-in function of Microsoft Excel, Microsoft Corporation. The calculated isotherm parameters at the studied solution conditions, and the corresponding R2 values, are shown in Table 4. The R2 values were lower for the Freundlich isotherm, which suggests that this isotherm cannot appropriately represent the uptake of Pb(II) by ZnCl2-MCM-41 particles. In contrast, the very higher R2 values for both the Langmuir and the Redlich–Peterson isotherms suggest that these two models can be used for explaining the equilibrium Pb(II) uptake. The Redlich–Peterson isotherm is a hybrid of the Langmuir and Freundlich isotherms into a single equation. Two limiting behaviors exist: the Langmuir form for m = 1 and Henry's law form for m = 0. The m value was 0.693, which indicates that the number of homogeneous active sites on ZnCl2-MCM-41 was higher than the number of heterogeneous ones. In fact, the higher R2 value of the R–P isotherm denotes that both the Langmuir and Freundlich isotherms can describe this sorption process, but most of Pb(II) sorption onto ZnCl2-MCM-41 takes place according to the assumptions of the Langmuir isotherm. The Freundlich model proposes an adsorption with a heterogeneous energetic distribution of active sites, accompanied by interactions between adsorbed molecules. The Langmuir model suggests that the uptake occurs on a homogeneous surface through monolayer sorption without interaction between adsorbed molecules.34 Thus, according to a linear regression method, most of the Pb(II) uptake is due to monolayer coverage of solute species onto the surface of ZnCl2-MCM-41. Fig. S1† illustrates the linear behavior of these three isotherm models.
Table 4 The isotherm parameters for the sorption of Pb(II) onto ZnCl2-MCM-41 obtained by linear regression method (T = 20 °C, pH = 7, sorbent dosage = 0.333 g L−1, 60 min, 300 rpm)
Freundlich |
Langmuir |
Redlich–Peterson |
Kf |
1/n |
R2 |
qm |
Ka |
R2 |
A |
B |
m |
R2 |
49.4 |
0.546 |
0.9674 |
454.5 |
0.110 |
0.9947 |
71.3 |
0.481 |
0.693 |
0.9964 |
3.4.2. Non-linear regression. The Freundlich, Langmuir, and Redlich–Peterson isotherm constants and error values were determined by a non-linear regression method based on different error functions. These data are presented in Table S3.† For each isotherm, seven sets of error functions with model parameters were calculated, and then the SNE value of each set was computed. The lowest SNE value indicates the best set of error functions. The SRE, χ2, and ARE sets were obtained as the optimum sets of error functions for the Freundlich, Langmuir, and Redlich–Peterson isotherms, respectively. The optimum sets of the Freundlich and Langmuir models do not have higher R2 values than the other sets. Therefore, it is not appropriate to use the coefficient of determination (R2) for comparing the best-fitting isotherms. The parameters obtained by linear regression differ from the non-linear parameters (in the optimum set), especially for the R–P isotherm. This difference verifies that the non-linear method is a better way to obtain the isotherm parameters, since the linearization of non-linear experimental data may distort the error distribution structure of an isotherm.17 Fig. S3† presents the Langmuir, Freundlich, and R–P isotherms' deviations from experimental data. A comparison of monolayer maximum adsorption capacities (qmax) of some adsorbents for Pb(II) removal from aqueous solution were listed in Table S4.†
3.5. Sorption nature
In addition to the studied isotherms mentioned previously, the equilibrium data were analyzed by the Dubinin–Radushkevitch (D–R) isotherm model to determine whether the adsorption process is physical or chemical. The linear form of the D–R isotherm equation is:5 |
ln qe = ln qm − βε2
| (4) |
where qe is the amount of adsorbate per unit weight of sorbent (mol g−1), qm is the maximum sorption capacity (mol g−1), β is the activity coefficient related to sorption mean free energy (mol2 J−2), and ε is the Polanyi potential (ε = RT
ln(1 + 1/Ce)). The D–R model parameter values are given in Table 5. The mean free energy (E; kJ mol−1) is defined as follows: |
 | (5) |
Table 5 The D–R isotherm linear equations and parameters for the adsorption Pb(II) onto ZnCl2-MCM-41 (T = 20 °C, pH = 7, sorbent dosage = 0.333 g L−1, 60 min, 300 rpm)
ln qm |
β (mol2 J−2) |
E (kJ mol−1) |
R2 |
−5.63 |
6.64 × 10⁻⁹ |
8.68 |
0.9845 |
The E (kJ mol−1) value presents information about the adsorption mechanism, describing whether it is occurring physically or chemically. A mean free energy between 8 and 16 kJ mol−1 denotes that an adsorption process takes place chemically, while E < 8 kJ mol−1 shows that an adsorption process proceeds physically. The mean sorption energy was determined as 8.68 kJ mol−1 for the sorption of Pb(II). This result suggests that the sorption process of Pb ions onto ZnCl2-MCM-41 may be carried out by a chemical mechanism.7 However, because of the small difference between 8 and 8.68 kJ mol−1, it could be said that Pb(II) adsorption onto ZnCl2-MCM-41 might be carried out by a physico-chemical mechanism.
3.6. Thermodynamic study of the adsorption process
Thermodynamic parameters can be determined using the equilibrium constant (K = qe/Ce), depending on temperature. The Gibbs free energy change (ΔG°) is the fundamental criterion of spontaneity. Reactions occur spontaneously at a given temperature if ΔG° has a negative quantity. The changes in free energy (ΔG°), enthalpy (ΔH°), and entropy (ΔS°) associated with the adsorption process were calculated using the following equations:29 |
ΔG° = −RT ln K
| (6) |
|
 | (7) |
The plot of ln
K versus 1/T provides the numerical values of ΔH° and ΔS° from slope and intercept, respectively (Fig. 14). The values obtained from eqn (6) and (7) are tabulated in Table 6. A negative value for the standard enthalpy change shows that the adsorption is exothermic. The results indicate that the adsorption of Pb(II) onto ZnCl2-MCM-41 was favored at low temperatures and blocked at high temperatures. The negative values of ΔG° indicate that the adsorption process had a spontaneous nature. In addition, the negative value of the entropy change (ΔS°) implies that some structural changes occurred in sorbate and sorbent during the adsorption process, which led to a decrease in the disorderedness of the solid–solution system. The thermodynamic analysis derived from temperature-dependent adsorption isotherms shows that the adsorption process of Pb(II) onto ZnCl2-MCM-41 was spontaneous and exothermic. As the initial concentration of Pb(II) increased from 20 to 200 mg L−1, the free energy change shifted to lower negative values for all studied temperatures. This demonstrates that the adsorption was more spontaneous at low concentrations. From Table 6, it is worth mentioning that the ΔH°, ΔS° and ΔG° obtained at variable initial Pb(II) concentrations are different. The enthalpy change (ΔH°) varied from −29.4 to −10.1 kJ mol−1 in the Pb(II) concentration range of 20–200 mg L−1 while the entropy change (ΔS°) varied from −63.39 to −4.88 J mol−1 K−1. The decrease in enthalpy was in conformity with the exothermic and spontaneous nature of the adsorption process. The distribution of Pb(II) ions in the solution is by nature more chaotic than the distribution of the Pb(II) ions bound to the ZnCl2-MCM-41 surface, so the binding of Pb(II) ions onto the sorbent surface resulted in a net decrease in entropy. Overall, the values of ΔH°, ΔS°, and ΔG° obtained at variable initial Pb(II) concentrations were different, especially in the case of higher initial Pb(II) concentrations.
 |
| Fig. 14 Plot of ln KD versus 1/T for the determination of thermodynamic parameters. | |
Table 6 Thermodynamic parameters for the sorption of Pb(II) onto ZnCl2-MCM-41
C0 (mg g−1) |
ΔG° (kJ mol−1) |
ΔH° (kJ mol−1) |
ΔS° (J mol−1 K−1) |
20 °C |
25 °C |
35 °C |
50 °C |
20 |
−10.91 |
−10.09 |
−9.46 |
−9.02 |
−29.4 |
−63.39 |
50 |
−10.76 |
−10.05 |
−9.43 |
−8.90 |
−28.9 |
−62.32 |
100 |
−10.12 |
−9.56 |
−9.22 |
−8.70 |
−23.7 |
−46.29 |
200 |
−8.67 |
−8.62 |
−8.53 |
−8.54 |
−10.1 |
−4.88 |
3.7. Adsorbent regeneration and lead recovery
Desorption of the adsorbed Pb(II) ions from ZnCl2-MCM-41 using different concentrations of HNO3 was studied. For these studies, different volumes of HNO3 were used for regenerating 10 mg of the wasted ZnCl2-MCM-41 adsorbent. The effect of using various volumes of different concentrations of HNO3 as eluent was investigated in the range of 3–10 mL, the results of which are tabulated in Table 7. The highest recovery for Pb(II) ions was found to be 95% through the use of 10 mL of 1.0 M HNO3. Furthermore, the adsorbents regenerated by different volumes of 1.0 M HNO3 were utilized for the uptake of Pb species from 20 mg L−1 Pb(II) solution. This assessment shows that the synthesized sorbents were effectively capable of being regenerated and reutilized, which is of extreme importance in industrial applications. The evaluation of removal efficiency after regenerating the sorbents by HNO3 is also presented in Table 7.
Table 7 Adsorbent regeneration, Pb(II) recovery, and evaluation of removal efficiency after regeneration by nitric acid
Volume HNO3 (M) |
Pb(II) recovery (%) |
Pb(II) removal after regeneration by different volumes of 1.0 M HNO3 (%) |
0.3 M |
0.5 M |
0.8 M |
1.0 M |
3 mL |
47 |
52 |
61 |
68 |
62 |
5 mL |
49 |
57 |
66 |
73 |
68 |
8 mL |
56 |
68 |
78 |
91 |
76 |
10 mL |
72 |
83 |
90 |
95 |
87 |
3.8. Adsorption ability of ZnCl2-MCM-41 for an industrial wastewater sample
To examine the performance of ZnCl2-MCM-41 for the removal of Pb(II) ions in the presence of other cations, the sorbent was added to a 50 mL sample of wastewater from a battery production factory. The sample consists of different heavy metals such as Pb(II), Ni(II), Fe(III), Cr(III), and Zn(II), with different initial concentrations. The results obtained at pH 7, 20 °C, 60 min, and a stirring rate of 300 rpm are listed in Table 8. The results showed that 0.333 g L−1 of sorbent can remove Pb(II) and Fe(III) completely. Moreover, these results illustrated that ZnCl2-MCM-41 sorbent is capable of considerably adsorbing all contaminants. According to the outcome of these tests, it can be concluded that ZnCl2-MCM-41 is an effective sorbent for removing a number of heavy metals from aqueous solution.
Table 8 Heavy metal uptake from an industrial wastewater sample onto ZnCl2-MCM-41
Heavy metal |
Initial concentration (μg L−1) |
Removal (%) |
Pb(II) |
7540 |
100 |
Ni(II) |
0.575 |
89.6 |
Fe(III) |
0.76 |
100 |
Cr(III) |
0.15 |
91.3 |
Zn(II) |
0.69 |
88.4 |
4. Conclusion
The present study shows that ZnCl2-MCM-41 is an effective adsorbent for the removal of Pb(II) ions from aqueous solutions. The SEM and TEM images show that the new synthesized sorbent particles have a spherical morphology with no agglomeration. Other characterization tests indicate that the porosity of particles after modification was preserved. However, the regularity of crystalline structure, surface area, pore volume, and pore diameter was reduced. The adsorption process was a function of ZnCl2 loading, the solution pH, temperature, adsorbent dose, initial metal concentration, and agitation time. The optimum conditions for the lead removal by ZnCl2-MCM-41 were 4 mmol ZnCl2 per gram of MCM-41, pH = 7, 20 °C, and 0.01 g (30 mL)−1 adsorbent dose. Equilibrium was achieved practically in 30 min, but the experiments were done for 1 h to ensure equilibrium. The Freundlich, Langmuir, and Redlich–Peterson isotherms were fitted to the equilibrium sorption data by linear and non-linear regression methods in the following order, according to the SNE values: Redlich–Peterson > Langmuir > Freundlich. According to the analysis results, the non-linear regression method has smaller deviations from the experimental data. Adsorption kinetics followed the pseudo-second order kinetic model. Moreover, the inability of the Elovich equation to describe the sorption process denotes that this process was homogeneous. The influence of ionic strength on the adsorption of Pb(II) onto ZnCl2-MCM-41 showed that this sorbent was to some degree tolerant against the interference of other ions. The obtained values of ΔH°, ΔG°, and ΔS° indicate that the process was exothermic, spontaneous, and eventually of decreased randomness. Finally, desorption studies using different concentrations of HNO3 and the adsorption of heavy metals from an industrial wastewater sample demonstrated the feasibility of using this adsorbent for industrial applications.
References
- F. Luo, Y. Liu, X. Li, Z. Xuan and J. Ma, Chemosphere, 2006, 64, 1122–1127 CrossRef CAS PubMed.
- S. Klimmek, H.-J. Stan, A. Wilke, G. Bunke and R. Buchholz, Environ. Sci. Technol., 2001, 35, 4283–4288 CrossRef CAS.
- M. Gavrilescu, Eng. Life Sci., 2004, 4, 219–232 CrossRef CAS PubMed.
- M. R. Panuccio, A. Sorgonà, M. Rizzo and G. Cacco, J. Environ. Manage., 2009, 90, 364–374 CrossRef CAS PubMed.
- F. Raji and M. Pakizeh, Appl. Surf. Sci., 2013, 282, 415–424 CrossRef CAS PubMed.
- B. Sen Gupta, M. Curran, S. Hasan and T. Ghosh, J. Environ. Manage., 2009, 90, 954–960 CrossRef CAS PubMed.
- D. Xu, X. Tan, C. Chen and X. Wang, J. Hazard. Mater., 2008, 154, 407–416 CrossRef CAS PubMed.
- Z. L. Yan Liu, J. Gao, J. Dai, J. Han, Y. Wang, J. Xie and Y. Yan, J. Hazard. Mater., 2011, 186, 197–205 CrossRef PubMed.
- T. Akar and S. Tunali, Bioresour. Technol., 2006, 97, 1780–1787 CrossRef CAS PubMed.
- R. Han, W. Zou, H. Li, Y. Li and J. Shi, J. Hazard. Mater., 2006, 137, 934–942 CrossRef CAS PubMed.
- C. Kresge, M. Leonowicz, W. Roth, J. Vartuli and J. Beck, Nature, 1992, 359, 710–712 CrossRef CAS.
- J. Beck, J. Vartuli, W. Roth, M. Leonowicz, C. Kresge, K. Schmitt, C. Chu, D. Olson and E. Sheppard, J. Am. Chem. Soc., 1992, 114, 10834–10843 CrossRef CAS.
- S. Morin, P. Ayrault, S. El Mouahid, N. Gnep and M. Guisnet, Appl. Catal., A, 1997, 159, 317–331 CrossRef CAS.
- N. Kumar, V. Nieminen, L. E. Lindfors, T. Salmi, D. Y. Murzin, E. Laine and T. Heikkilä, Catal. Lett., 2002, 78, 105–110 CrossRef CAS.
- F. Boudrahem, F. Aissani-Benissad and H. Aït-Amar, J. Environ. Manage., 2009, 90, 3031–3039 CrossRef CAS PubMed.
- J. Liu, D. Yin, L. Qin and D. Yin, Stud. Surf. Sci. Catal., 2005, 156, 815–822 CrossRef CAS.
- Y.-S. Ho, Carbon, 2004, 42, 2115–2116 CrossRef CAS PubMed.
- R. Savidha and A. Pandurangan, Appl. Catal., A, 2004, 276, 39–50 CrossRef CAS PubMed.
- B. Sun, E. P. Reddy and P. G. Smirniotis, Appl. Catal., B, 2005, 57, 139–149 CrossRef CAS PubMed.
- Y. Shan and L. Gao, Mater. Chem. Phys., 2005, 89, 412–416 CrossRef CAS PubMed.
- K. M. S. Khalil, J. Colloid Interface Sci., 2007, 315, 562–568 CrossRef CAS PubMed.
- Z. Aksu and T. Kutsal, J. Chem. Technol. Biotechnol., 1991, 52, 109–118 CrossRef CAS PubMed.
- M. A. Acheampong, K. Pakshirajan, A. P. Annachhatre and P. N. Lens, J. Ind. Eng. Chem., 2013, 19, 841–848 CrossRef CAS PubMed.
- P. Lodeiro, J. Barriada, R. Herrero and M. Sastre de Vicente, Environ. Pollut., 2006, 142, 264–273 CrossRef CAS PubMed.
- G. Zeng, Y. Pang, Z. Zeng, L. Tang, Y. Zhang, Y. Liu, J. Zhang, X. Lei, Z. Li and Y. Xiong, Langmuir, 2011, 28, 468–473 CrossRef PubMed.
- R. Wang, Q. Li, D. Xie, H. Xiao and H. Lu, Appl. Surf. Sci., 2013, 279, 129–136 CrossRef CAS PubMed.
- Y. Niu, R. Qu, C. Sun, C. Wang, H. Chen, C. Ji, Y. Zhang, X. Shao and F. Bu, J. Hazard. Mater., 2013, 244, 276–286 CrossRef PubMed.
- J. Huang, Y. Liu and X. Wang, J. Hazard. Mater., 2008, 160, 382–387 CrossRef CAS PubMed.
- F. Raji and M. Pakizeh, Appl. Surf. Sci., 2014, 301, 568–575 CrossRef CAS PubMed.
- S. Lagergren, K. Sven. Vetenskapsakad. Handl., 1898, 24, 1–39 Search PubMed.
- Y.-H. Li, Z. Di, J. Ding, D. Wu, Z. Luan and Y. Zhu, Water Res., 2005, 39, 605–609 CrossRef CAS PubMed.
- M. K. Aroua, S. Leong, L. Teo, C. Y. Yin and W. M. A. W. Daud, Bioresour. Technol., 2008, 99, 5786–5792 CrossRef CAS PubMed.
- W. Weber and J. Morris, J. Sanit. Eng. Div., Am. Soc. Civ. Eng., 1963, 89, 31–60 Search PubMed.
- A. Sari, D. Mendil, M. Tuzen and M. Soylak, J. Hazard. Mater., 2009, 162, 874–879 CrossRef CAS PubMed.
Footnote |
† Electronic supplementary information (ESI) available. See DOI: 10.1039/c5ra01192b |
|
This journal is © The Royal Society of Chemistry 2015 |
Click here to see how this site uses Cookies. View our privacy policy here.