DOI:
10.1039/C5RA00988J
(Paper)
RSC Adv., 2015,
5, 38223-38234
A predictive mass transport model for gas separation using glassy polymer membranes
Received
17th January 2015
, Accepted 13th April 2015
First published on 17th April 2015
Abstract
In this work, a predictive mass transfer model was developed based on the solution-diffusion mechanism for gas permeation through glassy polymer membranes. For this purpose, the non-equilibrium lattice fluid (NELF) theory in conjunction with the modified Fick's law and the free volume theory were employed for prediction of gas sorption and permeation and the computational fluid dynamics (CFD) method was used to solve the governing transport equations. This CFD modeling was solved based on the two different cases for the gas diffusion coefficients inside the membrane: (Case 1) concentration dependent diffusion coefficients from the literature and (Case 2) developed diffusion coefficient based on the free volume theory. The proposed models were validated by the experimental data collected in this work as well as the experimental data reported in the literature. The results revealed that the NELF model enables us to predict the sorption behavior of N2, O2, CO2 and CH4 into the polysulfone membrane and the predicted sorption values were in very good agreement with experimental results. Furthermore, the developed mass transport model is able to determine the influence of operating parameters such as temperature and pressure on the separation performance of the membrane and the experimental flux and selectivity were satisfactorily predicted by the proposed model.
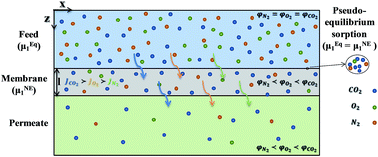
1 Introduction
Various techniques like cryogenic distillation, condensation, absorption, adsorption, pressure swing adsorption and membrane separation processes have been employed for gas separation and purification. Among these separation methods, the membrane processes deserve special attention due to inherent advantages such as low capital cost, low maintenance requirement, low weight and space requirement, high process flexibility and simplicity as well as ease of installation and operation.1 Nowadays, polymers are the most widely used materials for fabrication of membranes for gas separation due to their processability and low cost production. Various glassy and rubbery polymeric materials including polyphenylene oxide (PPO),2 polycarbonate (PC),3 polysulfone (PSf),4 polyethersulfone (PES),5 polyimide (PI),6 polydimethylsiloxane (PDMS)7 and poly(ether block amide) (PEBA)8 have been used for preparation of the different types of gas separation membranes.
Mathematical modeling and simulation of gas transport in the glassy polymeric membrane have considerable importance from an industrial point of view. The solution-diffusion model9 is widely employed to describe the permeation through the polymer membranes in the membrane processes like pervaporation, reverse osmosis, dialysis and gas separation. Based on the solution-diffusion mechanism, permeability of gases in the polymeric membrane depends on the gas sorption and diffusion phenomena. Therefore, prediction of sorption and diffusion in the membrane is a critical step for the mathematical modeling of the membrane gas separation process. Diffusion is a kinetics phenomenon related to the rate at which the gaseous permeants go through the membrane down a concentration gradient. Sorption is a thermodynamic phenomenon and the interactions between the gaseous permeants and the polymeric membrane directly determine the sorption level. On the other words, the sorption into the polymeric membranes is controlled by sorption equilibria at the interfaces, diffusion through the polymer matrix and the relaxation of the polymer network. The state of polymer, rubbery or glassy, affects on these phenomena.10,11 Different models such as Henry's law,12 dual sorption model,13 Flory–Huggins lattice model,14 non-equilibrium lattice fluids (NELF) model15 and statistical associating fluid theory (SAFT) equation of states16 have been extensively applied to model the gas sorption into the glassy polymer membranes. Among these models, the NELF model has a rather reliable predictive ability as reported by previous researchers.17–19 For example, Angelis et al.17 used the NELF model to predict the infinite dilution gas and vapor sorption into the glassy polymeric membranes like PPO, PC, PSf and poly(methyl methacrylate) (PMMA) and observed satisfactory agreement between the predictive results and experimental data. Minelli and Doghieri18 applied the NELF model for the description of the solubility and volume swelling isotherm of different permeant/polymer pairs. Recently, De Angelis et al.19 employed the NELF model to determine the solubility isotherms of various gases into a polymer of intrinsic microporosity (PIM-1) mixed matrix membranes with different fumed silica nanoparticles loadings. In gas permeation, the transfer of diffusing species through the polymeric membrane is often expressed by Fick's law20 and the Maxwell–Stefan theory.21 For using these theories, the diffusion coefficient of permeants inside the membrane should be determined. The gas diffusion coefficients may be estimated by various approaches including the constant diffusion coefficient,20 empirical models,21 free volume theory,22,23,24 activated state theory25,26 and molecular dynamic simulation.27 For instance, Dhingra and Marand20 employed Fick's law with constant diffusion coefficient to model the permeation of CO2/CH4 binary gas through polydimethyl siloxane (PDMS) as a rubbery polymer and thermoplastic polyimide (TPI) membrane as a glassy polymer. Moaddeb and Koros28 presented an exponential correlation for the diffusion coefficient of O2 and N2 thin polymeric membranes. Lin et al.29 coupled Fick's law with the free volume theory to interpret the temperature and fugacity dependence of pure gas permeability in the poly(ethylene glycol)-based membranes. Choudalakis and Gotsis30 also applied the free volume theory to determine the gas diffusivity in the polymer nanocomposite membranes and investigated the effect of nanoparticles incorporation on the free volume of the membrane. Nilsson et al.31 developed a predictive model for the permeation of single gases in the polycarbonate (PC) and poly(ether-ether-ketone) (PEEK) membranes using the NELF and free volume theories to estimate the solubility and diffusion coefficients, respectively. Also, Raharjo et al.26 described the pure and mixed gas permeations in the PDMS membranes and used the Maxwell–Stefan model based on free volume theory and activated state theory for description of the diffusion coefficients. Heuchel and Hofmann32 used molecular modeling to predict the solubility and diffusion coefficient of O2, N2 and CO2 in the polyimide membranes. Tocci et al.33 employed the molecular dynamics simulations to determine the diffusivity of gases in PEEK membranes.
Furthermore, the computational fluid dynamics (CFD) techniques have been employed to solve the transport equations in the membrane gas separation process. The CFD modeling which is a computational technology to evaluate numerical methods and algorithms can be used to simulate the transport in the membrane separation processes. The CFD has been widely applied for the modeling of the membrane processes like ultrafiltration,34 reverse osmosis35 and pervaporation.36 The CFD technique was also applied for the modeling and simulation of the membrane gas separation. The initial studies were focused on the application of the CFD modeling to investigate the concentration polarization phenomena and hydrodynamics of the membrane modules.37–39 Bao and Lipscomb37 employed the CFD method to analyze the influence of random fiber packing on shell flow distribution and performance of shell-fed hollow fiber gas separation modules. Takaba and Nakao38 performed a CFD study on the effect of the concentration polarization on the separation of H2/CO by a ceramic membrane. Abdel-jawad et al.39 also studied the flow fields on the feed and permeate sides of tubular molecular sieving silica membranes using the CFD technique as well as the Stefan–Maxwell and Navier–Stokes equations. Moreover, Kawachale et al.40 utilized the CFD technique to investigate the effect of cell geometry and operating parameters on the separation performance of a gas separation module and validated their model with the experimental data. Dal-Cin et al.41 applied the CFD modeling to develop a transport based model to simulate the gas permeation of CO2 and N2 through the PDMS coated membranes. Farno et al.42 investigated the separation behavior of a gas mixture containing C3H8, CH4 and H2 at various operating conditions through the PDMS membrane using CFD modeling.
Since the gas separation using the glassy polymer membranes has important industrial applications, it is necessary to develop a predictive model for mass transfer through the membrane gas separation process. For this purpose, a mass transfer model was developed based on the solution-diffusion mechanism and using the NELF model and free volume theory for the prediction of the gas sorption and diffusion in glassy membranes, respectively. The CFD technique was employed to solve the transport equations simultaneously in order to acquire the concentration profile inside the membrane. Finally, to validate the proposed model, the gas permeation experiments were conducted using a lab-scale gas separation module with the polysulfone membrane that was fabricated via the phase inversion method in our lab. Also, the modeling results were compared with the experimental data reported in previous works.
2 Model development
The model was proposed for the steady state gas permeation through the membranes in a plate and frame membrane module. The model domain used for modeling is demonstrated in Fig. 1.
 |
| Fig. 1 The model domain for the gas membrane module. | |
According to the solution-diffusion mechanism, mass transfer across the membrane occurred in three consecutive steps: (i) selective sorption of the gas into the membrane at the feed–membrane interface, (ii) selective diffusion of the gaseous permeant through the membrane, (iii) desorption from the membrane–permeate interface to the permeate stream. Generally, desorption of the diffusing species from the membrane (step 3) is very fast relative to the two other steps (step 1 and 2). The procedure used to develop the model is presented in the following.
2.1 Model assumptions
The model was developed by the following assumptions:
- The mass transport through the membrane is steady state and isothermal.
- The permeation for each species through the membrane is one-dimensional.
- Non-equilibrium sorption and transport were assumed for glassy polymers.
- The concentration polarization is negligible.
- The deformation of the membrane under applied pressures is negligible.
2.2 Gas flow through the feed side
The conservation equation of momentum and mass were simultaneously solved to simulate the gas flow through the feed side of the membrane module. The conservation equation of momentum (Navier–Stokes equation) for the undertaken system can be written as:43 |
 | (1) |
where v is velocity, p is pressure, ρ is density, μ is viscosity and g is the gravity.
To solve the Navier–Stokes equation, the following boundary conditions were applied:
|
at x = 0, vx = v0 (inlet velocity)
| (2) |
|
at x = xl, p = p0 (outlet pressure)
| (3) |
|
 | (4) |
where
v and
vw,t are the velocity and velocity of moving wall, respectively,
Ls is the slip length and
τ is shear stress.
In addition, the conservation equation of mass for component i is:43
|
 | (5) |
where
ci is concentration and
Ri is generation term.
Ji is molar flux and can be determined by Fick's law in the feed side:
Di is gas diffusion coefficient and can be estimated by the following equation for self diffusion of a single gas in the feed:
44 |
 | (7) |
where
T is temperature (K),
rAB is the molecular separation at collision (
rAB = (
rA +
rB/2)) in nm,
M is the molecular weight (kg mol
−1),
k is Boltzmann's constant,
f is collision function and
εAB shows the energy of molecular attraction (kg m
−2 s
−2).
The following boundary conditions were applied to solve the mass equation in the feed:
|
 | (9) |
|
 | (11) |
where
ci,f and
ci,M are the component concentration in the feed and membrane at the feed/membrane interface and
m is the partition coefficient for the permeating gas between the feed and the membrane.
2.3 Gas sorption in the glassy membranes
In the sorption step, the gas molecules sorb into the membrane due to the concentration gradient. In comparison to the rubbery polymers, sorption in the glassy polymers is completely different and cannot be explained by most conventional models. In particular, the NELF model which is an extension of the lattice fluid equation of state to the non-equilibrium state has been employed to estimate the sorption into the glassy polymer membranes.15,45
Under non-equilibrium conditions, in the NELF model the chemical potential of the diffusing gas in the glassy membrane (μMi) is given as follows:47
|
 | (12) |
where
T is operating temperature (K) and
R is gas constant.
T*,
p*,
v* and
ρ* are the independent characteristic parameters of pure components which are reported in the previous studies.
15,46,47 The values of these parameters for the gases and membrane considered in this study are given in
Table 1.
Table 1 The values of characteristic parameters for the gases and membrane
Component |
T* (K) |
p* (MPa) |
v* (m3 mol−1) |
ρ* (g cm−3) |
Ref. |
N2 |
145 |
160 |
7.5 × 10⁻⁶ |
0.043 |
46 |
O2 |
170 |
280 |
5.04 × 10⁻⁶ |
1.29 |
47 |
CO2 |
300 |
630 |
3.95 × 10⁻⁶ |
1.515 |
15 |
CH4 |
215 |
250 |
7.15 × 10⁻⁶ |
0.5 |
46 |
PSf |
830 |
600 |
1.15 × 10⁻⁵ |
1.31 |
46 |
The component volume fraction (φi) in terms of the component mass fraction (wi) and the characteristic density (ρ*i) of the pure components is calculated as:
|
 | (13) |
is the dimensionless density that is defined as:
|
 | (14) |
The characteristic density for the mixture (ρ*) is related to the characteristic density of the pure components as follow:
|
 | (15) |
Δp* is a binary parameter and for each gas/polymer couple is determined by the following approximation:48
|
 | (16) |
where
kij is binary coefficient which for solubility of hydrocarbon penetrants and light gases like O
2, N
2 and CH
4 into a hydrocarbon-based polymer is generally given by the first order approximation,
i.e. kij = 0.
Also, in the NELF model roi is for the lattice site and can be obtained by the following relation:
|
 | (17) |
where
Mi is the molecular weight of the diffusing gas.
According to the NELF model, a pseudo-equilibrium condition is obtained after contacting the gaseous feed phase with the glassy polymer membrane, therefore the equality of the component chemical potential between two phases can be written as follows:
where
μGi is the chemical potential of component in the gaseous feed and may be calculated by usual Gibbs free energy relation.
In the NELF model, the gas solubility in a glassy polymer membrane under non-equilibrium conditions can be derived based on eqn (18) as follows:17
|
 | (19) |
where
TSTP and
PSTP are the standard temperature (273.15 K) and pressure (1 atm), respectively and
ρo2 is the density of the glassy pure polymer. In
eqn (19), the first two terms in brackets represent the entropic contribution to solubility and the third term that contains the binary adjustable parameter (
Ψ) represents the enthalpic contribution. In the present study,
Ψ is set equal to 1 (
i.e. ideal mixtures), so that the model is used in an entirely predictive way to estimate the solubility coefficient.
17
2.4 Gas diffusion through the membrane
Generally, it is assumed that the mass transport in the dense membranes used in the gas separation is due to diffusion.49 Thus, the convective term in eqn (5) can be neglected and based on the assumptions mentioned so far, eqn (5) is simplified to:
The diffusive mole flux (Ji) through the membrane is determined by the generalized Fick's law:50
|
 | (21) |
where
DMi is the diffusion coefficient in the membrane,
μi is the chemical potential of diffusing gas in the membrane and
ci is the concentration of diffusing gas in the membrane, which can be related to the volume fraction (
φi) by the following relation:
36
By substituting eqn (22) in eqn (21) and rearrangement the following relation is obtained:
|
 | (23) |
Therefore, by assuming that ρ is distance independent and substituting eqn (23) in eqn (20), the following differential equation can be derived:
|
 | (24) |
In the above equation, term d
μi/d
φi was calculated by a derivative of
eqn (12) with respect to
φi.
The following boundary conditions were used to solve the mass equation in the membrane:
|
at z = zl, φi,M = mφi,f
| (25) |
|
at z = zl + l, φi = 0
| (26) |
Eqn (24) will be solved in two different cases: (i) diffusion coefficient from the literature as function of feed pressure51 and (ii) diffusion coefficient based on the free volume theory. The values of diffusion coefficient for the gases studied in this work are given in Table 2.
Table 2 The gas diffusion coefficient (cm2 s−1) in the polysulfone membrane as function of feed pressure51
Gas |
Pressure (bar) |
2.5 |
5 |
7.5 |
10 |
O2 |
2.85 × 10⁻⁸ |
3 × 10⁻⁸ |
3.1 × 10⁻⁸ |
3.3 × 10⁻⁸ |
N2 |
7 × 10⁻⁹ |
7.5 × 10⁻⁹ |
8 × 10⁻⁹ |
8.5 × 10⁻⁹ |
CO2 |
1 × 10⁻⁸ |
1.4 × 10⁻⁸ |
1.7 × 10⁻⁸ |
2 × 10⁻⁸ |
CH4 |
2.1 × 10⁻⁹ |
2.4 × 10⁻⁹ |
2.6 × 10⁻⁹ |
2.8 × 10⁻⁹ |
2.5 Free volume theory
The diffusion coefficient of components in the membrane should be determined to solve the mass transport equation through the membrane. Basically, diffusion through the polymeric membranes occurs due to the passage of permeating molecules through the voids between the polymer chains. The free volume theory has been successfully employed to estimate the diffusion coefficient of gaseous components through various polymeric membranes.22,52
In this work, the Doolittle relation is used to predict the gas diffusion through the polysulfone membrane. Based on the Doolittle relation, the penetrants/membrane diffusion coefficient is related to the fractional free volume of the polymer:24
|
 | (27) |
where FFV is the fractional free volume and
A and
B are constants.
The fractional free volume can be written as follows:
|
 | (28) |
where

and

are the specific volume of polymer and occupied specific volume, respectively.
52 The values of free volume constants are presented in
Table 3.
Table 3 The free volume constants for the Doolittle relation22
Gas |
A (cm2 s−1) |
B |
O2 |
1.38 × 10⁻⁵ |
0.9394 |
N2 |
7.94 × 10⁻⁶ |
1.059 |
CO2 |
2.08 × 10⁻⁵ |
1.09 |
CH4 |
5.24 × 10⁻⁶ |
1.19 |
For the gas mixture diffusion coefficient through the membrane, coupling of fluxes were considered. Based on the Duda's free volume theory for the ternary system, the diffusion coefficient of gas mixture in membrane are calculated by the following equation:53,54
|
DMi = D0[(1 − φi)2(1 − 2χi3φi)]
| (29) |
where
D0 is the pure gas diffusion coefficient and
χi3 is the penetrant/polymer interaction parameter that can be calculated as follows:
53,54 |
 | (30) |
where, index
i and 3 represent the permeating gas and PSf, respectively.
2.6 Method of solution
In this study, the governing equations in the feed side (eqn (1) and (5)) as well as in the membrane (eqn (24)) are discretized based on the finite element method. For this purpose, the COMSOL multi-physics software (Version 4.3a) was used to solve the governing equations and to find the permeation flux of gaseous components through the membrane. COMSOL generated meshes in triangular shape and in isotropic size. Fig. 2 shows the meshes generated by COMSOL software.
 |
| Fig. 2 Magnified segments of the mesh used in the COMSOL modeling. | |
3 Experimental
3.1 Materials
The commercial polysulfone (PSf) with molecular weight of 54
000 g mol−1 (Ultrason® S 6010) was purchased from BASF (Ludwigshafen, Germany) and N,N-dimethyl-formamide (DMF) as organic solvent was received from Merck Co. Ltd. (Darmstadt, Germany) and were used for membrane preparation. O2, N2 and CO2 gases with purity of 99.99% were utilized as feed gas in this work.
3.2 Membrane preparation
The PSf membrane was prepared by the evaporation-induced phase separation technique. First, the polymer was dried at 120 °C for 5 h, then weighted and dissolved in the DMF solvent. The polymer solution contained 20% wt PSf and 80% wt DMF. The polymer solution was stirred at room temperature for 24 h. Afterwards, the PSf solution was degassed by a vacuum process for 4 h and cast on a glass plate with a 300 μm knife gap. The PSf membranes were formed in an oven at 80 °C for 24 h. Finally, the resulted membrane was separated from the glass plate. The thickness of this dense polymeric membrane was about 35 ± 5 μm.
3.3 Gas permeability measurement
A pre-calibration cross flow flat sheet permeation cells with constant volume and variable pressure were employed for measurements of permeation in these polymeric membranes. The membrane module consists of two stainless steel pressure housing for the feed and permeate streams and gaskets for sealing. The permeate side of module has a mesh spacer and the membrane supported on it. Also, the module equipped with a flow path cavity on each side of the membrane for the feed and permeate flows. The effective area of the membrane was 10 cm2. Pure gas permeation was tested in the sequence of N2, O2 and CO2 with purity of 99.99%. The permeation experiments were conducted at a temperature of 300 K and feed pressure from 2.5 to 7.5 bar. Each permeability experiment was measured at least two times and the average value was reported. The pressure of the permeate was recorded each 0.3 seconds and the rate of pressure enhancement (dp/dt) was imported to eqn (31) for the permeation measurements. The gas permeability of the prepared membranes was determined using the following equation: |
 | (31) |
where P is the permeation coefficient of gas in Barrer, V is downstream volume (cm3), S is the effective area of membrane (cm2), T is temperature (K), p0 is feed pressure (psia) and l is membrane thickness (μm).
The permeation molar flux was determined using the gas permeation experiment by the following relation:
|
 | (32) |
where
J is molar flux (mol m
−2 h
−1), Δ
p is the pressure difference (Psi) between the feed and permeate streams.
Also, the ideal selectivity of the membrane (αA/B) was calculated from the pure gas permeation experiments as follow:
|
 | (33) |
4 Results and discussion
The NELF model that was used to predict the sorption behavior of gaseous components into the PSf membrane is validated with the experimental data reported by Choi et al.55 and Ghosal et al.51 The proposed mass transfer model for the gas permeation through the PSf membrane also validated with the experimental data were conducted in the present work as well as with the data reported by Ghosal et al.51 and the effect of feed pressure on the selectivity and flux of components through the PSf membrane is investigated. Finally, the concentration profile of the permeating compounds inside the membrane is determined by the proposed model.
To compare the predicted results of the model with the experimental ones, the error is assessed by applying the average absolute relative deviation (AARD) which is defined as follows:
|
 | (34) |
where
n is the number of experimental data and
Jexp and
Jpre are the experimental and predicted value of the permeation flux, respectively.
4.1 Validation of sorption model
The sorption level of O2, N2, CO2 and CH4 into the PSf membrane as a glassy membrane which was calculated by the NELF model as a function of the critical temperature of each gas species is presented in Fig. 3 and compared with the experimental data.51,55 As can be seen from this figure, there are very good agreements between the sorption values predicted by the NELF model and the reported experimental values. Also, Fig. 3 indicates that there is a linear relationship between the logarithm of the sorption value and the gas critical temperature as follows: |
ln(S0) = 0.0202Tc − 4.2583
| (35) |
 |
| Fig. 3 The gas solubility into the polysulfone membrane as a function of critical temperature at 35 °C. | |
Based on eqn (37), the amount of gas sorption into the PSf membrane is increased by the critical temperature of the sorbed gas. In other words, the more condensable gaseous penetrant has more sorption values into the PSf membrane. The selected gas is sorbed into the PSf membrane in the order of CO2 > CH4 > O2 > N2. A similar trend was also observed by other researchers.55,56
Furthermore, the influence of feed temperature on the sorption of CO2 into the PSf membrane is indicated in Fig. 4. It can be observed that the gas solubility into the membrane decreases with an enhancement in temperature. This behavior can be related to the kinetics of the sorption into the polymeric membranes. Generally, gas sorption into the polymeric membranes is an exothermic phenomenon.58,59 Therefore, an enhancement in the gas temperature leads to lower sorption level into the membrane. Also, Fig. 4 shows that the proposed sorption model is able to predict the effect of temperature on the gas sorption into the membrane.
 |
| Fig. 4 The effect of feed temperature on the sorption of CO2 into the polysulfone membrane. | |
The sorption for binary gas mixture of CO2 and CH4 (CO2/CH4 = 57.5/42.5 vol%) into the PSf membrane as function of the feed pressure is shown in Fig. 5. It can be seen that the sorption isotherm for CO2 and CH4 are concave to the pressure axis which are typical for glassy polymers.57 Also, the modeling results concurs the experimental data of gas mixture.
 |
| Fig. 5 The solubility of CO2/CH4 gas mixture into the polysulfone membrane as a function of pressure at 30 °C. | |
4.2 Validation of mass transfer model
The gas separation performance of the fabricated PSf membrane was evaluated by the permeation test of O2, N2 and CO2 gases. Also, in order to study the influence of the feed pressure on the gas separation performance of the fabricated membranes, the pressure was varied from 2.5 to 7.5 bar and the results are presented in Fig. 6. As shown in this figure, the permeation flux of all gases increases with an enhancement in the feed pressure. This behavior can be explained based on the solution-diffusion mechanism. According to the solution-diffusion model, both sorption and diffusion of components in the membrane characterize the membrane transport properties. A change in the feed pressure directly affects the sorption phenomena at the feed/membrane interface, and the gas sorption enhances with an increase in the operating pressure, especially for more condensable gases like CO2.57 Also, higher gas sorption into the membrane at higher feed pressure affects the gas diffusion through the membrane. On the other hand, the increase in free volume due to gas sorption increases the polymer chain mobility and gas diffusion inside the membrane. Therefore, the enhancement in the sorption and diffusion leads to higher gas permeation flux with an increase in feed pressure. A similar trend has been observed in other studies60,61 For example, Lin et al.63 reported the CO2 permeability into the cross-linked poly(ethylene glycol diacrylate) membrane that increased as the operating pressure varied from 2.5 to 11 bar.
 |
| Fig. 6 The effect of feed pressure on the permeation flux at 300 K and a comparison between the predicted and experimental results: (a) N2, (b) O2 and (c) CO2. | |
Fig. 6 also indicates that there is a relatively good agreement between the experimental data and the modeling results. Both modeling cases enable to predict the gas permeation with the PSf membrane and to determine the influence of the feed pressure on the gas fluxes through the membrane. It can be seen that the CO2 permeation flux predicted by the proposed models are lower than the experimental values. This discrepancy for the CO2 can be attributed to high sorption of this penetrant into the PSf membrane which may be caused dilation effect and membrane swelling and consequently the CO2 gas permeation increases significantly. The proposed models are not able to consider the membrane swelling phenomena and this may be the cause of under-prediction the experimental data of the CO2 by the models. Furthermore, in order to evaluate the predictability of the proposed mass transfer model, the model is validated by the experimental data for gas permeation of four gases, i.e. O2, N2, CO2 and CH4, that were reported by Ghosal et al.51 and the results are shown in Fig. 7. It can be observed that the modeling case 1 and 2 can well predict the experimental data.
 |
| Fig. 7 The effect of feed pressure on the permeation flux at 308 K and a comparison between the predicted results and experimental data reported by Ghosal et al.:51 (a) N2, (b) O2, (c) CO2 and (d) CH4. | |
Furthermore, the O2/N2 and CO2/N2 selectivities which are determined using the experimental data and modeling results as a function of pressure are shown in Fig. 8. As shown in this figure, the pressure has no significant effect on the gas selectivities as the gas pressure varied from 2.5 to 7.5 bar. This behavior can be attributed to the influence of pressure on the partial gas permeation fluxes. As indicated in Fig. 6 and 7, the permeation flux of N2, O2 and CO2 increases in the same order as the gas pressure enhances, therefore the selectivity that is related to the ratio of the partial fluxes is almost constant with increasing pressure.
 |
| Fig. 8 The effect of feed pressure on the O2/N2 (a) and CO2/N2 (b) selectivities at 300 K and a comparison between the predicted and experimental results. | |
Furthermore, the proposed mass transfer model was validated for the gas mixture. For this purpose, the modeling results were compared with the experimental data reported by Kim and Hong64 for binary gas mixture of CO2 and CH4 (CO2/CH4 = 57.5/42.5 vol%) and the results are presented in Fig. 9 and 10. As shown in these figure, the CO2 and CH4 permeabilities in the binary mixture as well as the real CO2/CH4 selectivity were satisfactory predicted by the proposed model.
 |
| Fig. 9 The experimental and predicted permeability of CO2/CH4 gas mixture as function of pressure at 303 K. | |
 |
| Fig. 10 The experimental and predicted real CO2/CH4 selectivity of gas mixture as function of pressure at 303 K. | |
Finally, the error analysis based on the calculated AARD values indicates that both modeling cases satisfactorily enable to predict the permeation of gaseous components through the polysulfone membrane. The average AARD values of modeling case 1 and 2 for single component permeation were 29.8 and 26.4%, respectively. However, the average AARD values of modeling case 1 and 2 for permeation of binary gas mixture of CO2 and CH4 were 11.4% and 13.5%, respectively. The differences between the modeling results and the experimental data may be attributed to limitations of the model in terms of swelling phenomena and the free volume model used to predict the gas diffusion coefficients in the membrane. As previously mentioned, the proposed models are not able to consider the membrane swelling phenomena and this may be the cause of under-prediction the experimental data of the CO2 by the models.
4.3 Concentration profile in the membrane
The concentration profile of the permeating gas inside the membrane is calculated using modeling case 2 and the predicted results at feed pressure of 2.5 bar are presented in Fig. 11. As shown, the concentration profile of the penetrants depends on the type of permeating gas and decreased mostly by the membrane thickness from the left side of the membrane. Fig. 11 shows that the predicted concentration profile for O2 and N2 linearly changes with the distance inside the membrane, while CO2 and CH4 have a parabolic concentration gradient. This behavior can be related to the high sorption of CO2 and CH4 into the membrane and non-equilibrium behavior of the glassy polymer membrane. As observed in Fig. 3, the sorption of CO2 and CH4 into the PSf membrane was higher than that of the N2 and O2 and this results in higher volume fraction of CO2 and CH4 in the membrane. Furthermore, the amount of gas content in the glassy membrane is explained mostly based the dual mode sorption model.57 Based on this model, the glassy membrane shows non-equilibrium behavior which can be explained based on the Henry's law (linear term) and Langmuir's law (non-linear term), thus gas sorption in this membrane is more alike to parabolic concave shape, especially for the penetrants with high gas solubility. Similar trends were also observed in the previous studies.51,57
 |
| Fig. 11 Concentration profile of different permeating gas inside the membrane (volume fraction) at feed pressure of 2.5 bar. | |
5 Conclusion
The gas sorption and permeation in the polysulfone membrane were modeled using the basic transport equations and predictive models were developed. The NELF model was used to determine the sorption behavior of various gases into the membrane. The modified Fick's equation in combination with the free volume theory were employed to model the gas transport through the membrane and the CFD technique was applied to solve the governing mass transfer equations. The developed models were validated by the experimental data collected in this work as well as the experimental data reported in the literature and the following results were obtained:
- The solubility of gases into the membrane was predicted by the NELF model and very good agreement was observed between the predicted results and the experimental data which previously reported by other researchers.
- The experimental flux and selectivity were satisfactorily predicted by the developed mass transfer model.
- The proposed model enables to predict the effect of feed pressure and temperature on the gas permeation through the membrane.
- The concentration profile of O2 and N2 inside the membrane shows mostly linear trends with a distance from the left side of the membrane, whereas the concentration profile of CO2 and CH4 has a parabolic trend.
Finally, it can be concluded that the gas sorption and permeability permeation through the glassy polymer membrane are satisfactorily predicted by the proposed model without the need of any adjustable parameters and the developed model is able to predict the influence of some operating parameters like feed temperature and pressure on the performance of the membrane in the gas separation process.
Nomenclature
A | Constant in free volume theory |
AARD | Average absolute relative deviation (%) |
B | Constant in free volume theory |
c | Concentration (mol m−3) |
D | Diffusion coefficient (m2 s−1) |
f | Collision function |
FFV | Fractional free volume |
g | Gravity (m s−2) |
J | Molar flux (mol m−2 h−1) |
k | Boltzmann's constant |
kij | Binary coefficient |
l | Membrane thickness (μm) |
Ls | Slip length (m) |
M | Molecular weight (kg mol−1) |
m | Partition coefficient |
n | Number of experimental data |
P | Permeability (Barrer) |
p | Pressure (kg m−1 s−2) |
p* | Lattice fluid characteristic pressure (kg m−1 s−2) |
Δp* | Binary parameter (kg m−1 s−2) |
![[p with combining tilde]](https://www.rsc.org/images/entities/i_char_0070_0303.gif) | Dimensionless pressure |
R | Gas constant (m3 bar K−1 kmol−1) |
Ri | Generation term |
roi | Number of occupied lattice site |
rAB | Molecular separation at collision (nm) |
S | Effective area of membrane (cm2) |
So | Solubility (cm3(STP) cm−3 bar−1) |
T | Temperature (K) |
Tc | Critical temperature (K) |
t | Time (s) |
![[T with combining tilde]](https://www.rsc.org/images/entities/i_char_0054_0303.gif) | Dimensionless temperature |
T* | Lattice fluid characteristic temperature (K) |
V | Molar volume (m3 mol−1), specific volume (m3 kg−1) |
v | Velocity (m s−1) |
vw,t | Velocity of moving wall (m s−1) |
v* | Lattice fluid characteristic volume (m3 mol−1) |
v* | Specific volume of polymer (m3 mol−1) |
 | Occupied specific volume (m3 mol−1) |
w | Weight fraction |
x, y, z | Axis coordinate |
xl | Length of feed channel (m) |
zl | Height of feed channel (m) |
Greek symbol
α | Selectivity |
εAB | Energy of molecular attraction (kg m−2 s−2) |
μ | Viscosity (Pa s) |
μi | Chemical potential |
ρ | Density (kg m−3) |
![[small rho, Greek, tilde]](https://www.rsc.org/images/entities/i_char_e0e4.gif) | Dimensionless density |
ρ* | Lattice fluid characteristic density (kg m−3) |
ρo2 | Pure polymer density (kg m−3) |
T | Shear stress (kg m−1 s−2) |
φ | Volume fraction |
Ψ | Binary adjustable parameter |
Subscripts
f | Feed |
i | Component |
m | Membrane |
s | Slip |
STP | Standard condition |
Superscripts
References
- R. W. Baker, Ind. Eng. Chem. Res., 2002, 41, 1393–1411 CrossRef CAS.
- G. H. Hong, D. Song, I. S. Chae, J. H. Oh and S. W. Kang, RSC Adv., 2014, 4, 4905–4908 RSC.
- D. Şen, H. Kalıpçılar and L. Yilmaz, J. Membr. Sci., 2007, 303, 194–203 CrossRef PubMed.
- M. Aroon, A. Ismail, M. Montazer-Rahmati and T. Matsuura, Sep. Purif. Technol., 2010, 72, 194–202 CrossRef CAS PubMed.
- A. F. Ismail, R. Norida, W. Rahman, T. Matsuura and S. Hashemifard, Desalination, 2011, 273, 93–104 CrossRef CAS PubMed.
- X. Y. Chen, H. Vinh-Thang, D. Rodrigue and S. Kaliaguine, RSC Adv., 2014, 4, 12235–12244 RSC.
- I. De Bo, H. Van Langenhove, P. Pruuost, J. De Neve, J. Pieters, I. F. Vankelecom and E. Dick, J. Membr. Sci., 2003, 215, 303–319 CrossRef CAS.
- R. S. Murali, K. P. Kumar, A. Ismail and S. Sridhar, Microporous Mesoporous Mater., 2014, 197, 291–298 CrossRef PubMed.
- J. Wijmans and R. Baker, J. Membr. Sci., 1995, 107, 1–21 CrossRef CAS.
- M. Laatikainen and M. Lindström, J. Membr. Sci., 1986, 29, 127–141 CrossRef CAS.
- J. Vrentas and C. Vrentas, Macromolecules, 1991, 24, 2404–2412 CrossRef CAS.
- T. Merkel, V. Bondar, K. Nagai, B. Freeman and I. Pinnau, J. Polym. Sci., Polym. Phys. Ed., 2000, 38, 415–434 CrossRef CAS.
- S. Kanehashi and K. Nagai, J. Membr. Sci., 2005, 253, 117–138 CrossRef CAS PubMed.
- A. Singh, B. Freeman and I. Pinnau, J. Polym. Sci., Polym. Phys. Ed., 1998, 36, 289–301 CrossRef CAS.
- F. Doghieri and G. C. Sarti, Macromolecules, 1996, 29, 7885–7896 CrossRef CAS.
- F. Mueller, S. Naeem and G. Sadowski, Ind. Eng. Chem. Res., 2013, 52, 8917–8927 CrossRef CAS.
- M. De Angelis, G. Sarti and F. Doghieri, J. Membr. Sci., 2007, 289, 106–122 CrossRef CAS PubMed.
- M. Minelli and F. Doghieri, Ind. Eng. Chem. Res., 2012, 51, 16505–16516 CrossRef CAS.
- M. G. De Angelis, R. Gaddoni and G. C. Sarti, Ind. Eng. Chem. Res., 2013, 52, 10506–10520 CrossRef CAS.
- S. S. Dhingra and E. Marand, J. Membr. Sci., 1998, 141, 45–63 CrossRef CAS.
- J. Kangas, L. Sandström, I. Malinen, J. Hedlund and J. Tanskanen, J. Membr. Sci., 2013, 435, 186–206 CrossRef CAS PubMed.
- A. Thran, G. Kroll and F. Faupel, J. Polym. Sci., Polym. Phys. Ed., 1999, 37, 3344–3358 CrossRef CAS.
- J. Park and D. Paul, J. Membr. Sci., 1997, 125, 23–39 CrossRef CAS.
- A. W. Thornton, K. M. Nairn, A. J. Hill and J. M. Hill, J. Membr. Sci., 2009, 338, 29–37 CrossRef CAS PubMed.
- R. Barrer, J. Barrie and P.-L. Wong, Polymer, 1968, 9, 609–627 CrossRef CAS.
- R. D. Raharjo, B. D. Freeman, D. R. Paul, G. C. Sarti and E. S. Sanders, J. Membr.
Sci., 2007, 306, 75–92 CrossRef CAS PubMed.
- M. Amani, S. Amjad-Iranagh, K. Golzar, G. M. M. Sadeghi and H. Modarress, J. Membr. Sci., 2014, 462, 28–41 CrossRef CAS PubMed.
- M. Moaddeb and W. J. Koros, J. Membr. Sci., 1997, 125, 143–163 CrossRef CAS.
- H. Lin, B. D. Freeman, S. Kalakkunnath and D. S. Kalika, J. Membr. Sci., 2007, 291, 131–139 CrossRef CAS PubMed.
- G. Choudalakis and A. Gotsis, Curr. Opin. Colloid Interface Sci., 2012, 17, 132–140 CrossRef CAS PubMed.
- F. Nilsson, K. Hallstensson, K. Johansson, Z. Umar and M. Hedenqvist, Ind. Eng. Chem. Res., 2012, 52, 8655–8663 CrossRef.
- M. Heuchel and D. Hofmann, Desalination, 2002, 144, 67–72 CrossRef CAS.
- E. Tocci, E. Bellacchio, N. Russo and E. Drioli, J. Membr. Sci., 2002, 206, 389–398 CrossRef CAS.
- R. Ghidossi, J. Daurelle, D. Veyret and P. Moulin, Chem. Eng. J., 2006, 123, 117–125 CrossRef CAS PubMed.
- A. Alexiadis, D. Wiley, A. Vishnoi, R. Lee, D. Fletcher and J. Bao, Desalination, 2007, 217, 242–250 CrossRef CAS PubMed.
- A. Mafi, A. Raisi and A. Aroujalian, J. Food Eng., 2013, 119, 46–55 CrossRef CAS PubMed.
- L. Bao and G. G. Lipscomb, Desalination, 2002, 146, 243–248 CrossRef CAS.
- H. Takaba and S.-i. Nakao, J. Membr. Sci., 2005, 249, 83–88 CrossRef CAS PubMed.
- M. Abdel-Jawad, S. Gopalakrishnan, M. Duke, M. Macrossan, P. S. Schneider and J. D. da Costa, J. Membr. Sci., 2007, 299, 229–235 CrossRef CAS PubMed.
- N. Kawachale, A. Kumar and D. M. Kirpalani, J. Membr. Sci., 2009, 332, 81–88 CrossRef CAS PubMed.
- M. M. Dal-Cin, K. Darcovich, S. Saimani and A. Kumar, J. Membr. Sci., 2010, 361, 176–181 CrossRef CAS PubMed.
- E. Farno, M. Rezakazemi, T. Mohammadi and N. Kasiri, Polym. Eng. Sci., 2014, 54, 215–226 CAS.
- R. B. Bird, W. E. Stewart and E. N. Lightfoot, Transport phenomena, John Wiley & Sons, 2007 Search PubMed.
- R. E. Treybal and E. T. Robert, Mass-transfer operations, McGraw-Hill, New York, 1968 Search PubMed.
- G. C. Sarti and F. Doghieri, Chem. Eng. Sci., 1998, 53, 3435–3447 CrossRef CAS.
- F. Doghieri and G. C. Sarti, J. Membr. Sci., 1998, 147, 73–86 CrossRef CAS.
- M. De Angelis, T. Merkel, V. Bondar, B. Freeman, F. Doghieri and G. Sarti, J. Polym. Sci., Polym. Phys. Ed., 1999, 37, 3011–3026 CrossRef CAS.
- I. C. Sanchez and R. H. Lacombe, Macromolecules, 1978, 11, 1145–1156 CrossRef CAS.
- A. F. Ismail, T. D. Kusworo, A. Mustafa and H. Hasbullah, in Regional Conference on Engineering Education RCEE 2005, Johor, Malaysia, 12–13 December 2005 Search PubMed.
- C. H. Lee, J. Appl. Polym. Sci., 1975, 19, 83–95 CrossRef CAS PubMed.
- K. Ghosal, R. T. Chern, B. D. Freeman and R. Savariar, J. Polym. Sci., Polym. Phys. Ed., 1995, 33, 657–666 CrossRef CAS PubMed.
- A. Bondi, J. Phys. Chem., 1964, 68, 441–451 CrossRef CAS.
- J. Vrentas, J. Duda and H. C. Ling, J. Polym. Sci., Polym. Phys. Ed., 1984, 22, 459–469 CrossRef CAS PubMed.
- J. M. Zielinski and J. Duda, AIChE J., 1992, 38, 405–415 CrossRef CAS PubMed.
- S.-H. Choi, M.-K. Lee, S.-J. Oh and J.-K. Koo, J. Membr. Sci., 2003, 221, 37–46 CrossRef CAS.
- J. McHattie, W. J. Koros and D. R. Paul, Polymer, 1991, 32, 840–850 CrossRef CAS.
- C. Aitken, W. Koros and D. Paul, Macromolecules, 1992, 25, 3424–3434 CrossRef CAS.
- K. Díaz, M. López-González, L. F. del Castillo and E. Riande, J. Membr. Sci., 2011, 383, 206–213 CrossRef PubMed.
- Y. Yampolskii, I. Pinnau and B. D. Freeman, Materials science of membranes for gas and vapor separation, Wiley Online Library, 2006 Search PubMed.
- C. A. Scholes, G. Q. Chen, G. W. Stevens and S. E. Kentish, J. Membr. Sci., 2010, 346, 208–214 CrossRef CAS PubMed.
- H.-J. Kim and S.-I. Hong, Korean J. Chem. Eng., 1997, 14, 168–174 CrossRef CAS.
- Y. Maeda and D. R. Paul, J. Polym. Sci., Polym. Phys. Ed., 1987, 25, 1005–1016 CrossRef CAS PubMed.
- H. Lin, E. Van Wagner, B. D. Freeman, L. G. Toy and R. P. Gupta, Science, 2006, 311, 639–642 CrossRef CAS PubMed.
- H.-J. Kim and S.-I. Hong, Korean J. Chem. Eng., 1997, 14, 382–389 CrossRef CAS.
|
This journal is © The Royal Society of Chemistry 2015 |
Click here to see how this site uses Cookies. View our privacy policy here.